

bernardbodo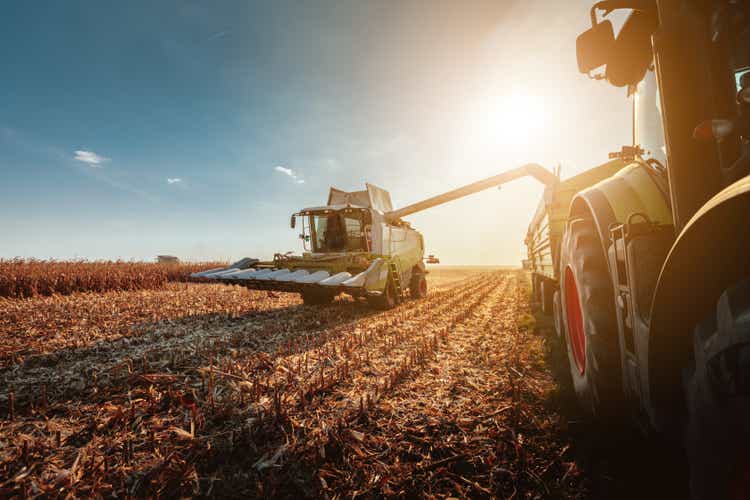
As someone that’s toyed with the idea of a slower and more rural lifestyle, Tractor Supply Company (NASDAQ:NASDAQ:TSCO) is a business that I would expect to spend a lot of my time and money at.
At the end of FY 2021, Tractor Supply operated 2,003 Tractor Supply stores as well as 178 Petsense stores. Compare that to the 1,187 Tractor Supply stores as of the end of FY 2012 and you can easily see that growth has been very strong. Total store count is up 85% over that time.
TSCO Store Count 2021 Annual Report (FY 2021 Annual Report)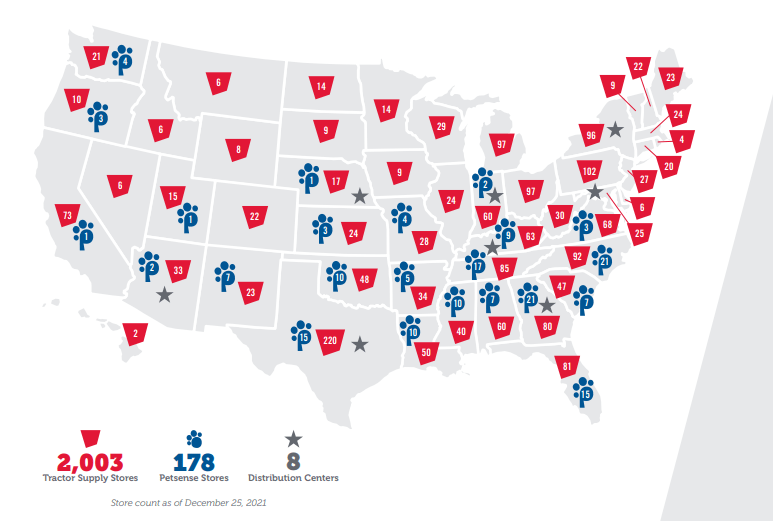
Tractor Supply focuses on rural and exurban locales with a niche market centered on recreational farmers and ranchers. The smaller target markets allow Tractor Supply to execute on their goal of providing excellent customer service. Most areas will generally support similar demands from their customers, i.e., cattle ranching, horses…, which allows Tractor Supply to better customize their product offerings for the needs of their clients.
Additionally, focusing on rural/exurban markets allows Tractor Supply to carry smaller stores by square feet, which helps to keep competitors at bay. It’s similar to Dollar General’s (DG) focus on similar markets where the local population doesn’t support the big-box retail competitors.
While the last couple of years have hurt many retail storefronts, especially those that are in more direct competition with Amazon (AMZN), Tractor Supply has navigated the uncertainty very well. Total sales rose by over 50% from FY 2021 compared to FY 2019, which suggests that their target markets haven’t been affected.
Tractor Supply has had some truly eye-popping dividend growth, with the most recent increase coming in at 77% and previous raises being 30.0%, 14%, 13% and 15%.
Dividend History
Dividends, and subsequently dividend growth, are one of the surest and most reliable ways for a business to tell its shareholders that the business is doing well. While I typically aim for companies that are closer to the “sweet spot” for dividend growth investors, i.e., initial yields in the 2.5% – 4.0% range with annual dividend growth in the 7% to 10% area, I also understand the importance of holding some of the lower yielding but faster-growing businesses that can provide a higher total return opportunity.
Tractor Supply Company Dividend History (TSCO Investor Relations)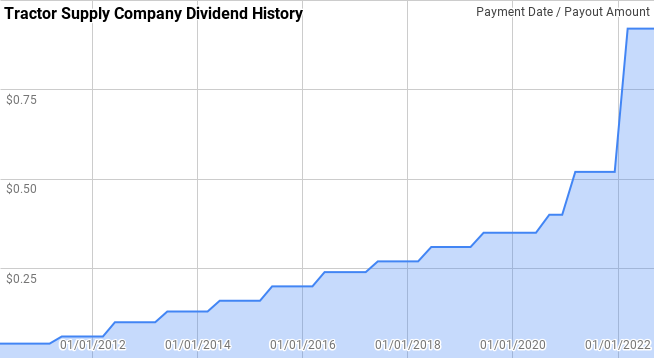
That’s an incredible run of dividend growth from Tractor Supply. From their first $0.035 quarterly payment in March 2010 to the most recent payment of $0.92, the dividend has increased an incredible 2,500%+. Tractor Supply has now grown their dividend for 13 consecutive years, giving them the title of Dividend Contender.
During Tractor Supply’s streak, year-over-year dividend growth has ranged from 10.35% to 76.9% with an average of 32.9% and a median of 24.5%.
Over that time, there’s been 10 rolling 3-year periods with annualized dividend growth coming in between 12.6% to 51.8% with an average of 26.7% and a median of 21.7%.
There has also been 8 rolling 5-year periods with annualized dividend growth from Tractor Supply spanning from 14.6% to 40.3% with an average of 24.5% and a median of 21.7%.
To say that Tractor Supply has been a fantastic dividend grower would be an understatement.
The rolling 1-, 3-, 5-, and 10-year annualized dividend growth rates from Tractor Supply since 2010 can be found in the following table.
| Year | Annual Dividend | 1 Year | 3 Year | 5 Year | 10 Year |
| 2010 | $0.14 | ||||
| 2011 | $0.22 | 53.57% | |||
| 2012 | $0.36 | 67.44% | |||
| 2013 | $0.49 | 36.11% | 51.83% | ||
| 2014 | $0.610 | 24.49% | 41.57% | ||
| 2015 | $0.760 | 24.59% | 28.28% | 40.26% | |
| 2016 | $0.920 | 21.05% | 23.37% | 33.74% | |
| 2017 | $1.050 | 14.13% | 19.84% | 23.87% | |
| 2018 | $1.200 | 14.29% | 16.45% | 19.62% | |
| 2019 | $1.360 | 13.33% | 13.92% | 17.39% | |
| 2020 | $1.500 | 10.29% | 12.62% | 14.57% | 26.76% |
| 2021 | $2.080 | 38.67% | 20.12% | 17.72% | 25.48% |
| 2022* | $3.680 | 76.92% | 39.35% | 28.51% | 26.17% |
Source: Author; Data Source: Tractor Supply Investor Relations
*Assumes a 4Q payment of $0.92 per share will be announced in November
The dividend payout ratio, whether comparing to free cash flow or profits, lets you know how safe the dividend and whether the dividend is at potential risk. All else being equal, a lower payout ratio is better than a higher one since it gives a lot of wiggle room for the inevitable business disruptions. Additionally, a low payout ratio can act as a coiled spring for future dividend growth as the business continues to improve over time, and the payout ratio can subsequently be increased as there’s less use for the retained earnings within the enterprise.
TSCO Dividend Payout Ratios (TSCO SEC filings)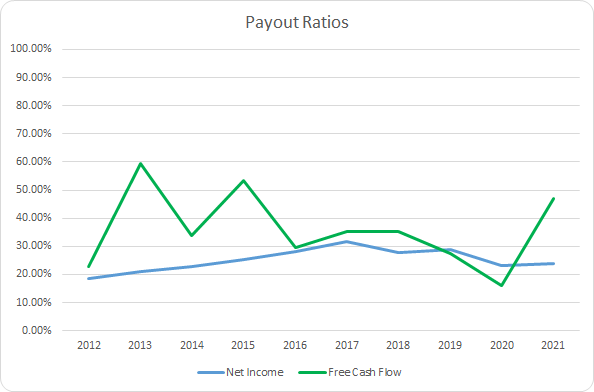
Even in light of the fantastic dividend growth from Tractor Supply, their payout ratio hasn’t risen that much, which suggests that the dividend growth has been supported by growth in the underlying business. The 10-year average net income payout ratio for Tractor Supply comes to 25.1% with the 5-year average at 27.1%. Similarly, the average free cash flow payout ratios are 36.0% and 32.1%, respectively.
Quantitative Quality
As a long-term investor, my goal is to purchase what I believe are quality businesses at reasonable valuations. It’s the quality of the business and management’s continued execution on long-term goals that will drive investment results over time.
TSCO Revenue Profits and Cash Flow (TSCO SEC filings)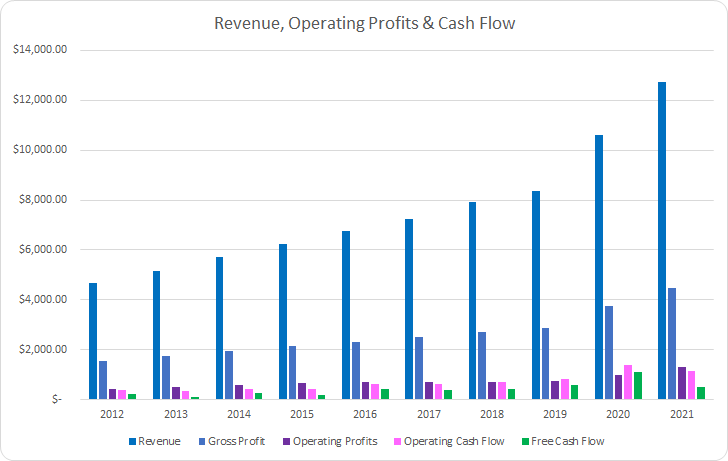
Tractor Supply has shown a steady rise in revenues and profits during the last decade. Between FY 2012 and FY 2021, revenues grew by 173.0% or 11.3% annualized. Considering that’s been all organic growth, that’s very impressive. Gross profits increased by 185.9% or 12.4% annualized.
Operating profits rose by 199.2% or 12.9% annualized with operating cash flow showing growth of 201.0% and 13.0%. Free cash flow has lagged behind increasing just 126.4% or 9.5% annualized.
My expectation is that good businesses will be able to defend their margins over time and preferably show rising levels of profitability. While gross margins aren’t likely to move significantly, I do expect to see margins further down the financial statements show improvement over time.
TSCO Margins (TSCO SEC filings)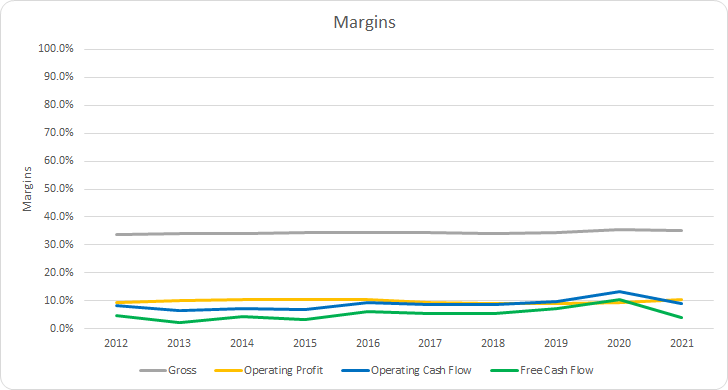
Tractor Supply’s gross margin has averaged 34.4% for the prior decade with a 34.7% average for the previous 5 years. Free cash flow margins have been stable although they saw a significant bump in 2020. The 10-year average FCF margin is 5.3% with the 5-year average at 6.4%. While I prefer to see a 10% level for free cash flow margin, that’s a level that’s hard to meet for most retail operations that primarily compete on price and inventory availability.
Additionally, I want to see how efficient the business is as generating free cash flow from its asset and capital base. My preferred metric is the free cash flow return on invested capital, FCF ROIC, which measures the amount of free cash flow the business earns each year compared to the capital currently invested in the business. I believe a 10% or greater FCF ROIC is a strong sign of a business that is very efficient with its capital.
TSCO Free Cash Flow Returns (TSCO SEC filings)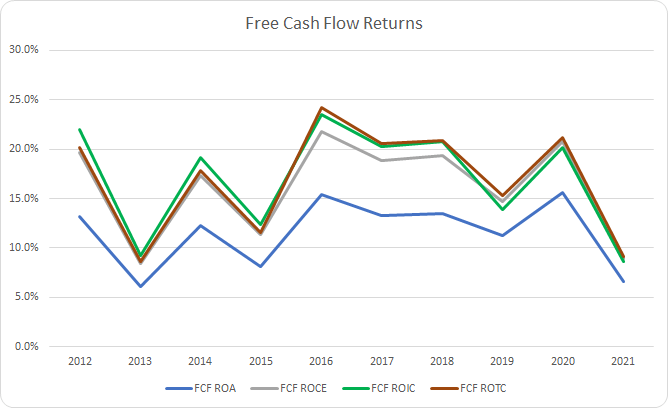
Tractor Supply has routinely surpassed a 10% FCF ROA with just 3 years not meeting the mark. The 10-year average is 11.5% with the 5-year average coming to 12.0%.
Tractor Supply has been able to achieve consistently strong FCF ROICs that have exceeded my 10% minimum target in all but two years out of the last decade. The 10-year average FCF ROIC comes to 17.0% with the 5-year average at 16.7%.
To understand how Tractor Supply uses its free cash flow, I calculate three variations of the metric, defined below:
- Free Cash Flow, FCF: Operating cash flow less capital expenditures
- Free Cash Flow after Dividend, FCFaD: FCF less total cash dividend payments
- Free Cash Flow after Dividend and Buybacks, FCFaDB: FCFaD less net cash used on share repurchases
TSCO Free Cash Flows (TSCO SEC filings)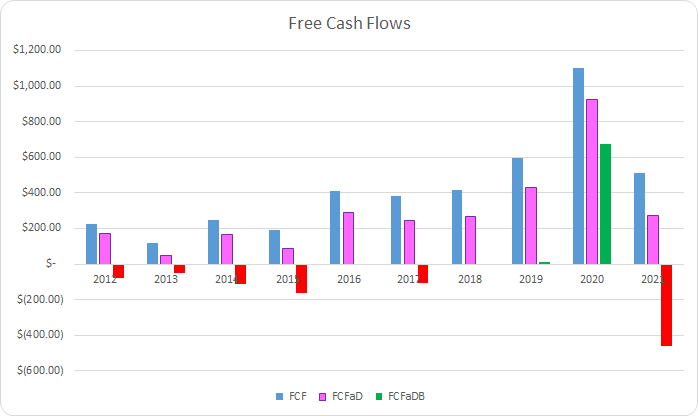
Tractor Supply has generated a cumulative total of $4.2 B in FCF between FY 2012 and FY 2021. With that FCF, they have sent to shareholders $1.3 B in dividend payments, which brings the 10-year total FCFaD to $2.9 B.
Tractor Supply has been quite aggressive with share repurchases effectively spending all or more of annual FCFaD on net buybacks except for FY 2020. In total, Tractor Supply has spent $3.2 B on cumulative repurchases during the last decade bringing the 10-year FCFaDB to -$0.3 B.
Tractor Supply has favored share repurchases as a means to return cash to shareholders when compared to dividends. Based on the cumulative dividends and net repurchases over the last decade, Tractor Supply has spent $0.50 on dividends for every $1.00 used on buybacks.
Share repurchases can be a solid way for a management team to return excess cash to shareholders. When done around fair value or cheaper, buybacks can generate value for remaining shareholders.
TSCO Shares Outstanding (TSCO SEC filings)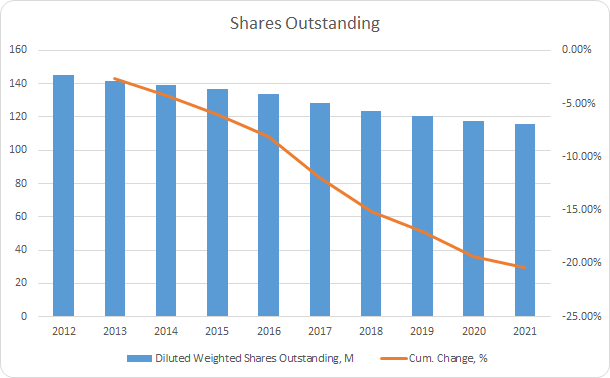
With the heavy allocation towards share repurchases, Tractor Supply’s share count has fallen by 20.4% in total over the last decade. That’s good for an annual reduction in share count of 2.5%.
When I invest in a business, my intention is to hold my stake for at least a 3-5 year period and longer should the business continue to perform. As such, the debt the business carries plays a bigger role in the decision. One measure that I track is the debt-to-capitalization ratio to see how the enterprise is capitalized.
TSCO Debt to Capitalization (TSCO SEC filings)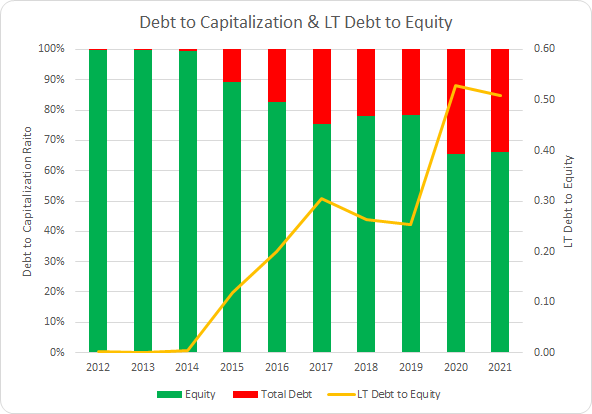
Tractor Supply still carries modest leverage in terms of the capital structure although it has been rising over time. Given the persistently low interest rates, I’m comfortable with the increase in leverage especially given the low initial leverage and large cash position. The 10-year average debt-to-capitalization ratio is 17% with the 5-year average at 27%.
While the capital structure is important in determining how the business is financed, I place more emphasis on the net debt ratios. The net debt ratios examine the total debt less cash versus some measure of profitability or cash flow. In short, it lets you know how quickly the business could de-lever should the capital markets demand higher rates due to macro or company-specific issues.
TSCO Net Debt Ratios (TSCO SEC filings)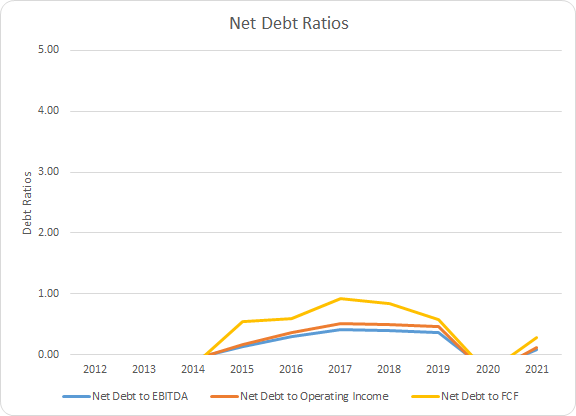
Tractor Supply carries a large cash balance in comparison to the debt placed on the business which significantly reduces the debt burden. The 10-year average net debt-to-EBITDA, net debt-to-operating income, and net debt-to-FCF ratios are 0.3x, 0.4x, and 0.6x, respectively, excluding the net cash balance years. Accordingly, the 5-year averages come to 0.3x, 0.4x, and 0.7x.
Valuation
Once I decide on a business that appears to be of high quality and one I might purchase, I try to value the business in order to determine a fair price to pay by utilizing several valuation methods. The valuation methods that I use are dividend yield theory, a reverse discounted cash flow analysis, and a minimum acceptable rate of return, “MARR”, analysis.
Dividend yield theory is a simple and straight-forward valuation method that’s built on the idea of reversion to the mean. In other words, it operates under the assumption that investors will value a business around a “normal” dividend yield over time.
Tractor Supply Company Dividend Yield Theory (TSCO Investor Relations and Google Finance)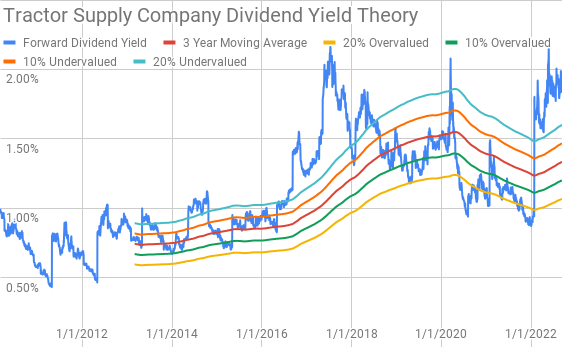
Since Tractor Supply initiated a dividend payment in 2010 shares have rarely offered a strong initial yield; however, that’s come with fantastic dividend growth as shown previously. When the forward dividend yield has exceeded the 20% undervalued yield band, it has usually marked a good time for intermediate-term purchases with favorable returns.
Currently, Tractor Supply offers a forward dividend yield of 1.83%, which shares have rarely offered a going-in yield this high. The 3-year average forward dividend yield sits at 1.33%.
A reverse discounted cash flow model works backwards from the current market valuation to determine what the growth and margin profile of the business must be to generate the cash flows that justify the market value.
I use a simplified DCF model based on revenue growth, an initial FCF margin of 4.5% that improves to 7.0% over the forecast period. The terminal growth rate is estimated at 2.5%.
For the discount rate, I’ve used estimated after-tax cost of debt of 2.57% with both a 10% and 8% cost of equity. That yields a discount rate of 9.7% for the 10% cost of equity scenario and a 7.8% discount rate for the 8% cost of equity.
Based on those assumptions, Tractor Supply needs to grow revenues 12.3% annually, or increase margins substantially higher, during the forecast period in order to generate the cash flows that would support the current market valuation with a 10% cost of equity / 9.7% discount rate. With the 8% cost of equity / 7.8% discount rate scenario, the required revenue growth comes to 7.1% annually during the forecast period.
The MARR analysis requires you to estimate the future earnings and dividends that a business will produce over a given time period. You then use a reasonable, and hopefully conservative, exit multiple in order to determine the possible future share price and calculate what the expected return would be. If the expected return is greater than your minimum hurdle for investment, then you can feel free to invest in the business.
Analysts expect Tractor Supply to report FY 2022 EPS of $9.59 and FY 2023 EPS of $10.44. They also expect Tractor Supply to be able to grow EPS 9.0% annually over the coming 5 years. I then assumed that Tractor Supply’s earnings would grow at a 5.0% annual rate for the following 5 years. Dividends are assumed to target a 35% payout ratio.
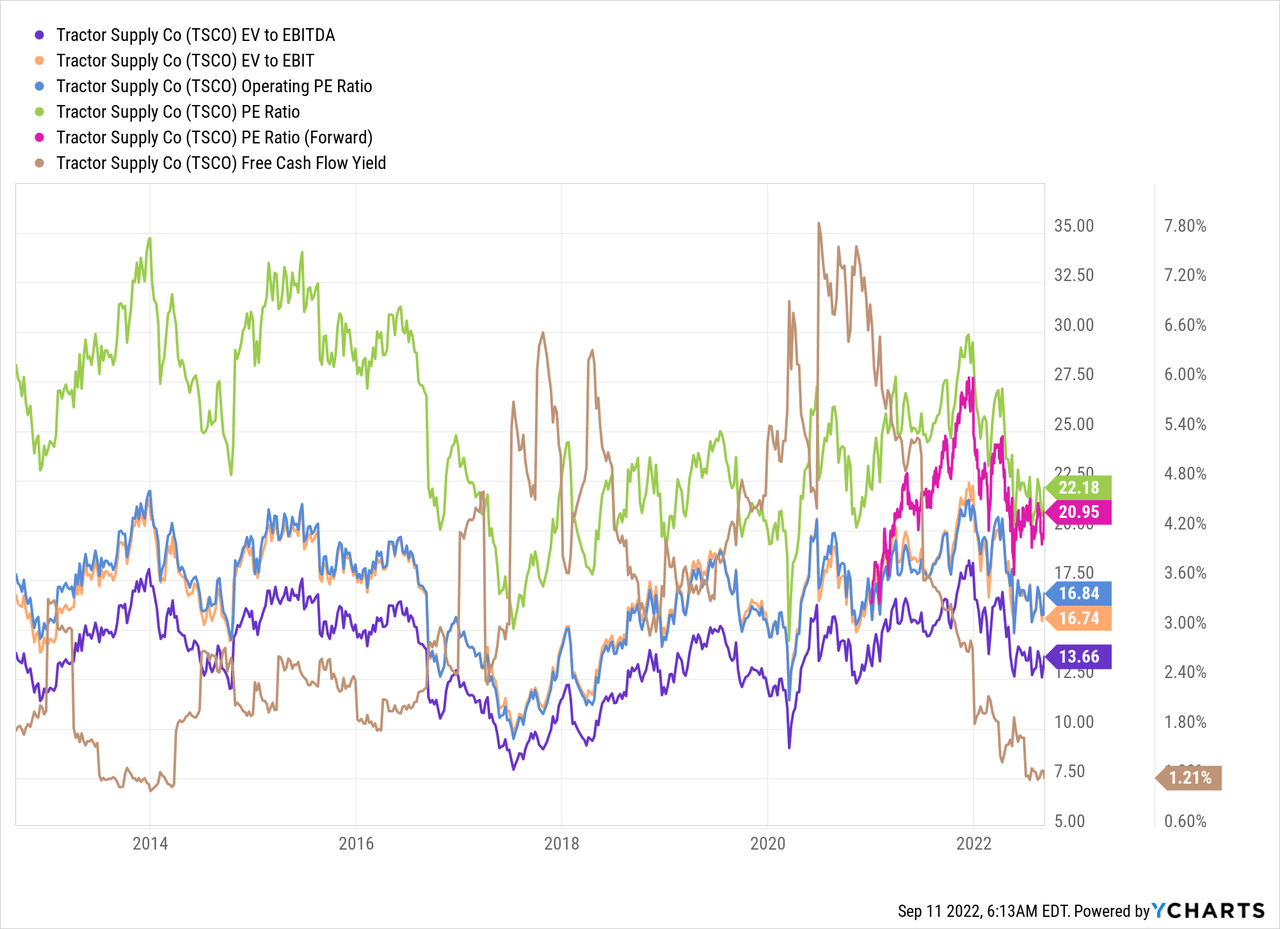
For the potential multiple that Tractor Supply might trade at, I like to see how investors have typically valued the business. Over the last decade, Tractor Supply has usually been valued between approximately 15x and 30x, with a longer timeframe being between approximately 20x and 25x.
[object HTMLElement]
The following table shows the potential internal rates of return that an investment in Tractor Supply might provide should the assumptions from above play out. Returns assume that dividends are paid and increased on the timeline that Tractor Supply has typically followed and that dividends are taken in cash. Returns also assume that shares are purchased at $200.92, Friday’s closing price.
| IRR | ||
| P/E Level | 5 Year | 10 Year |
| 30 | 20.8% | 13.0% |
| 25 | 16.0% | 10.9% |
| 22.5 | 13.3% | 9.7% |
| 20 | 10.3% | 8.5% |
| 17.5 | 7.1% | 7.1% |
| 15 | 3.5% | 5.5% |
Source: Author
Alternatively, I use the MARR setup to work backward and determine the maximum that I could purchase shares for based on the estimated growth from above in order to generate the returns that I desire from my investments. My base hurdle rate is a 10% IRR, and I’ll also examine 12% and 8% return thresholds.
| Purchase Price Targets | ||||||
| 10% Return Target | 12% Return Target | 8% Return Target | ||||
| P/E Level | 5 Year | 10 Year | 5 Year | 10 Year | 5 Year | 10 Year |
| 30 | $303 | $258 | $282 | $221 | $326 | $302 |
| 25 | $255 | $220 | $237 | $189 | $274 | $257 |
| 22.5 | $231 | $201 | $215 | $173 | $249 | $234 |
| 20 | $207 | $182 | $193 | $157 | $223 | $212 |
| 17.5 | $183 | $163 | $171 | $140 | $197 | $189 |
| 15 | $159 | $144 | $148 | $124 | $171 | $167 |
Source: Author
How Did We Get Here?
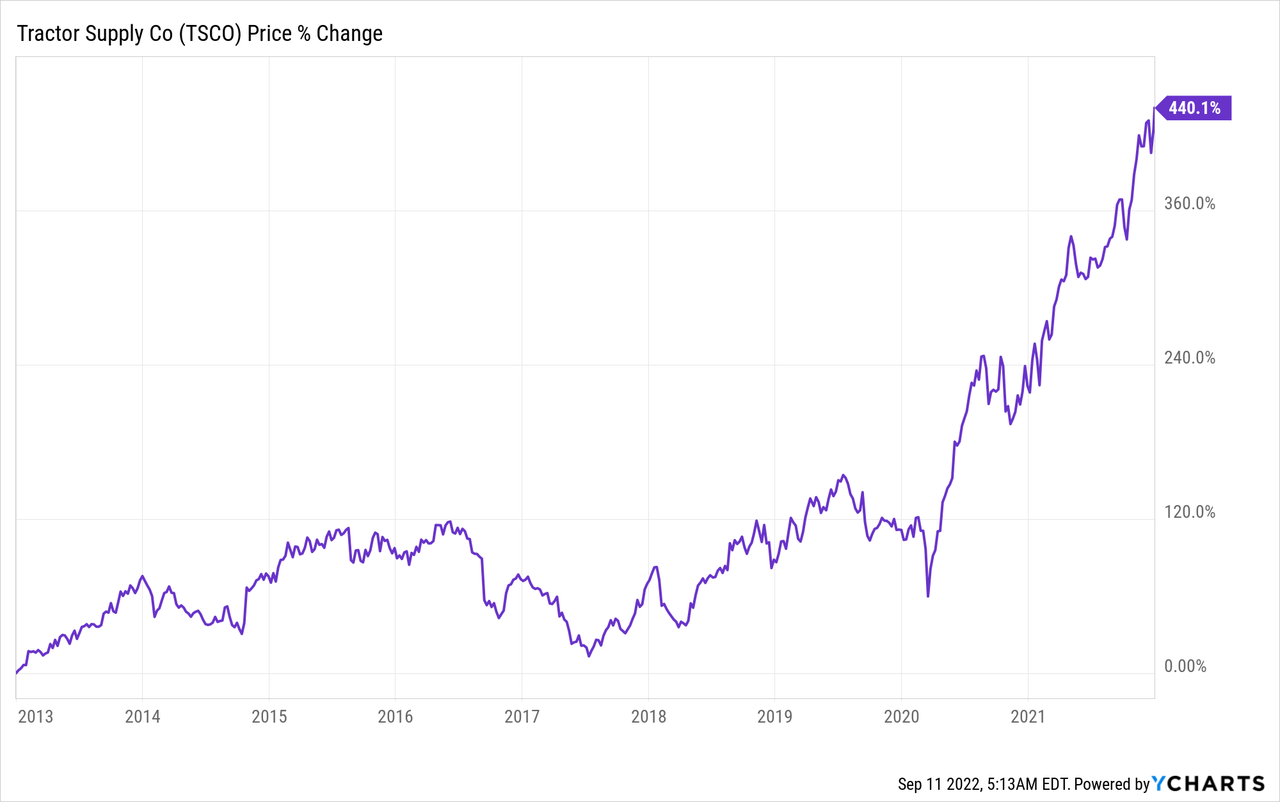
Tractor Supply has offered very impressive returns with a total increase of 440.1% between December 31, 2012 and December 31, 2021. That works out to an 18.4% CAGR for capital gains and adding in the 0.8% initial dividend yield gives a total CAGR in the area of 19.2%
[object HTMLElement]
One thing that I’ve started doing is to see what the source of investment returns for a stock have been. I do this by attempting to breakdown the returns into three components:
- Business Returns: As measured by sales growth and net profit margin
- Capital Allocation Returns: As measured by dividend yield and share repurchases
- Sentiment Returns: As measured by change in beginning and ending multiple
Tractor Supply’s revenue growth accounted for an 11.3% annual return attribution over the period mentioned. Additionally, the net profit margin rose from 5.9% to 7.8% which works out to a 3.0% attribution. In total, the business returns justified a 14.3% annualized return. So far so good.
The dividend yield offered a 0.8% annualized return. As we saw earlier, share repurchases accounted for a 2.4% annualized return which brings the total annual capital allocation returns to 3.2%.
At the beginning of the period, Tractor Supply traded at a 23.2x P/E, and by the end, the multiple had increased to 27.7x. That’s a 19.2% total change or roughly a 1.7% annualized return contribution for sentiment change.
| Annualized Returns | % of Returns | |
| Business Returns | 14.3% | 75% |
| Capital Allocation Returns | 3.2% | 16% |
| Sentiment Change | 1.7% | 9% |
| Total Annualized Returns | 19.1% |
Source: Author
Of course, when we invest in a business, you earn your returns based on future results of the business. My expectation would be for business returns to come in closer to 8% over the ensuing decade. The dividend yield is currently 1.8%. Based on the 3-year and the TTM period average FCFaD in conjunction with the current market cap of $22.2 B, Tractor Supply could repurchase roughly 1.8% of outstanding shares.
That gives a combined business and capital allocation return in the area of 10-12% before accounting for sentiment changes.
At the current price of $200.92, Tractor Supply is trading at a 22.3x TTM P/E, a 21.0x P/E compared to FY 2022 consensus estimates, and 19.2x FY 2023 consensus estimates. At the current multiple, I wouldn’t count on sentiment change providing much, if any, boost to returns. Although if the Tractor Supply can achieve 10-12% returns from the business and capital allocation, you’d still likely see solid returns.
TSCO How Did We Get Here (TSCO SEC filings, SA analysts estimates)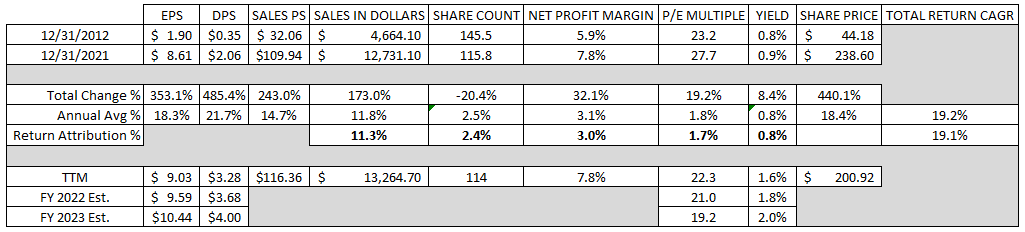
Conclusion
Over the last decade, Tractor Supply has been a fantastic investment providing over 19% annualized total returns. Growth for the business has come from higher same-store sales, expansion of the store count, as well as the acquisition of the Petsense brand stores.
As a retailer, Tractor Supply’s margins are fairly tight since they primarily compete on price. Net profit margins are routinely in the 6-7% area with free cash flow margins around 4-6%. However, thanks to high asset and inventory turnover, their FCF ROIC is much more impressive with a 21% average over the last 10 years and a 25.0% average for the last 5 years.
Dividend yield theory implies a fair value range between $250 and $307 for Tractor Supply. Compared to the current price of around $200, shares appear significantly undervalued.
The reverse DCF suggests that 10% returns will likely be hard to achieve as it requires aggressive revenue growth and margin assumptions in order to support the current market valuation. Although 8% returns do appear more obtainable with 7.1% required annual sales growth.
One thing to note is that the reverse DCF does not account for share repurchases which I fully expect to continue going forward and my assumption is that we’ll see a 1-3% annual reduction which reduces the required revenue growth accordingly.
The MARR analysis gives a fair value range between $183 and $231 when looking at 10% returns 5-year out with an exit multiple between 17.5x and 22.5x. Based on the same metrics but with a 12% return target, the fair value falls to between $171 and $215.
Looking out to 10 years, the 10% return threshold fair value range drops to between $163 and $201, with the 12% return target range falling to $140 to $173. The ranges drop due to the lower annual earnings growth rate over the back half of the period in conjunction with the longer period of discounting earnings.
I would expect growth to slow over the coming decade. Tractor Supply went from 1,176 stores in 2012, generating ~$4.0 M in sales per store to 2,181 stores, Tractor Supply and Petsense, that generated ~$5.8 M per store in annual revenue. That kind of store count growth did wonders for the underlying economics as well as share price appreciation.
For rapid growth to continue for Tractor Supply, the question really boils down to how many more stores they can open up. I wouldn’t expect to see store count growth increase by roughly 1k over the ensuing decade; although it’s certainly possible as they are in the process of acquiring 167 stores via Orscheln Farm & Home, which increases their exposure to the Midwest.
While a lower entry price is always preferred, it’s my opinion that Tractor Supply appears to offer favorable return prospects at the current share price around $200 per share. At this level, I believe investors are likely to be able to capture most of the future growth that Tractor Supply can obtain over time which is a strong position to be in. While Tractor Supply is not cheap, it does appear reasonably valued, especially for a business with a dominant position in its operational areas.
If shares continue to trade around this level once cash is available in my brokerage account, I would have no qualms with initiating a position, with the intention being to add more on any future weakness.
Be the first to comment