

lightkey/iStock Unreleased via Getty Images
One of the first major announcements made by Howard Schultz on his return to the helm of Starbucks Corp. (NASDAQ:SBUX) was a halt to stock buybacks. Remembering how McDonald’s Corp. (NYSE:MCD) used buybacks to deliver >200% returns over a decade of declining sales, this seemed to be like a bet by SBUX management that SBUX revenues can more than double again over the next decade compared to the past decade. In this article, I compare and contrast how significant buybacks were to SBUX and MCD shareholder returns from 2012-2022, and project these numbers to estimate future expected returns for SBUX vs MCD from 2022 to 2032.
Revenues and Returns
Even 10 years ago, I would have probably said that SBUX and MCD were both brands that had already saturated global markets, and thus both would find it challenging to double their revenues again. It had already seemed by 2012 that I could “throw a stone” in many cities and hit either a Starbucks or McDonald’s store, and the main growth opportunities I saw were in the Chinese cities I was increasingly exploring via China’s rapidly expanding high speed rail network.
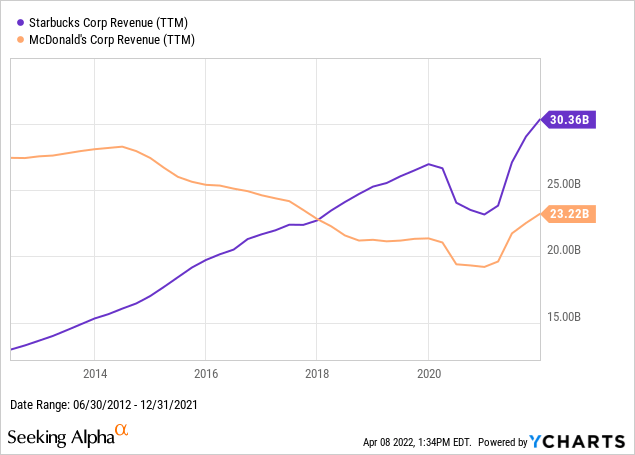
That said, 10 years later, we look at the numbers and see that SBUX has managed to more than double top-line revenues over the past decade, while MCD’s 2021 revenues are still lower than what they were in 2012.
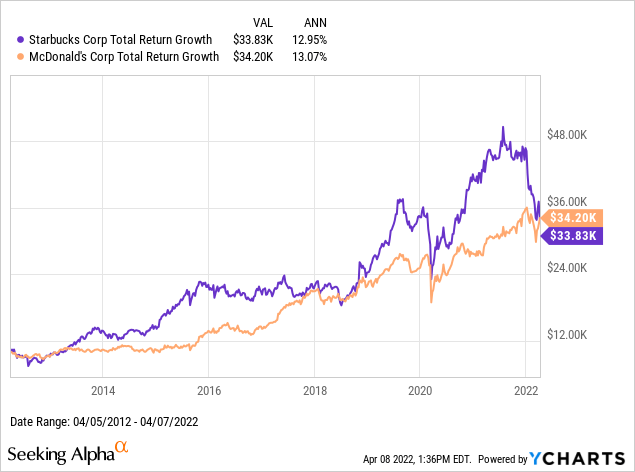
Despite these nearly opposite trajectories in sales growth numbers, SBUX and MCD would have delivered nearly identical total return numbers over the 10-year period I happened to look at, though SBUX did so with significantly more volatility. If your timing was good enough to take profits on your SBUX shares in late 2015, 2019, or 2021, you might have outperformed MCD, while if you bought into SBUX at those times, you would have underperformed.
Because both SBUX and MCD are “dividend achievers” (companies with at least 10 consecutive years of dividend growth), the most straightforward way to break down how these different growth rates translate into similar rates of return is with the simple “dividend growth return model,” which I run after the chart. The main trigger for me turning this article from one focused on SBUX alone to one explaining why I would prefer to buy more SBUX stock than MCD is seeing how I can now buy faster-growing SBUX at a higher yield than MCD.
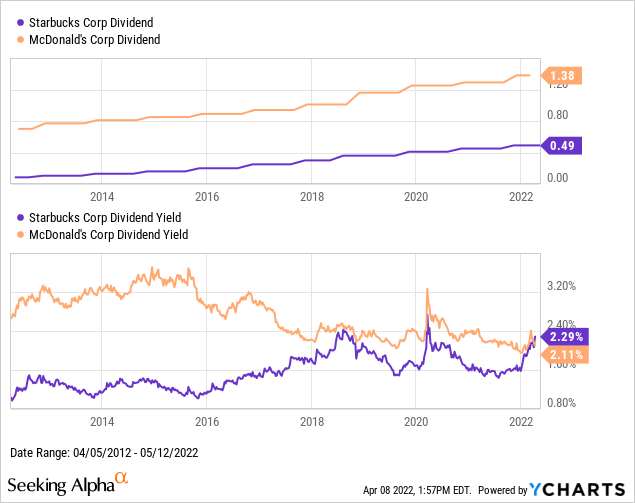
From 2012 to 2022, SBUX increased its dividend nearly 6-fold, from a split-adjusted 8.5 to 49 cents per share per quarter. Over the same time period, MCD’s dividend didn’t quite double, rising only from 70 to 138 cents per share per quarter. SBUX’s higher growth rate was offset by the “multiple contraction” of its dividend yield rising from below 1% to over 2%, while MCD’s yield dell from nearly 3% to just over 2%, on top of the differences in their respective initial yields. As a formula, this “dividend growth return model” is:
Rate of return ~ Initial Dividend Yield + ( (Final DPS / Final Yield) / (Initial DPS / Initial Yield) )^(1/Number of Years) – 1
Applied to these two names:
SBUX ~ 1.1%+ ((49/0.023)/(0.085/0.011))^(1/10) – 1 = 12.7%
MCD ~ 2.8% + ((138/0.021)/(70/0.028))^(1/10) – 1 = 12.9%
We will apply these formulas again later to estimate our expected rates of return for these two stocks over the next 10 years. But first, I want to look at the impact of buybacks.
SBUX vs. MCD on Buybacks
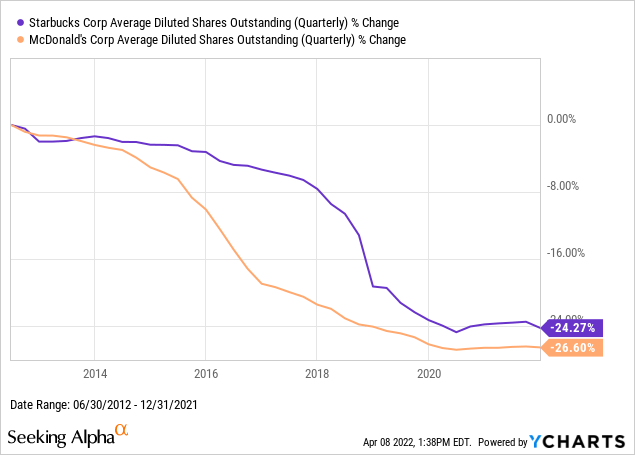
When I first saw that SBUX and MCD had delivered similar total returns over a decade with opposite growth trajectories, I expected that was due to MCD simply being more aggressive and successful with its stock buybacks over the past decade. The following three charts showed me that this was not the case. Rather, SBUX’s and MCD’s use and impact of buybacks over the past decade were in fact surprisingly similar.
First of all, we see that the net result of SBUX’s and MCD’s buyback programs was a roughly 25% decline in their respective number of shares outstanding. This means the impact of buybacks on either company can be described with the same simplifying example: four equal partners start each owning 1/4 of the company, then three of the partners buy out the fourth, and so those three remaining partners now each own 1/3 of the company. In exchange for those three partners using their earnings to buy out the fourth, they now own a larger share of the company’s future earnings and dividends.
This is why I have long understood buybacks as a necessary way to keep up returns on a business whose revenues are declining, as it reduces the denominator those revenues need to be divided by.
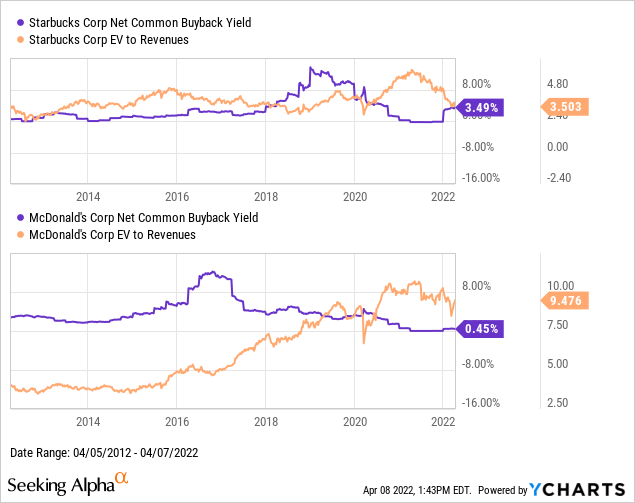
A second question I had was whether MCD might have been more effective in its buyback program, and perhaps did a better job than SBUX at buying back shares when valuations were cheap and less when shares were expensive. According to this next chart, this does not seem to have been the case. The peaks in both SBUX’s and MCD’s buyback yields both seem to have coincided with relatively cheap valuations of the stock (at least as measured by EV/Revenues), with buybacks dropping to zero as the stock got expensive again. The most significant difference between SBUX and MCD highlighted in the below charts is that MCD’s EV/Revenue multiple nearly tripled while SBUX’s remained roughly the same over the 10-year period.
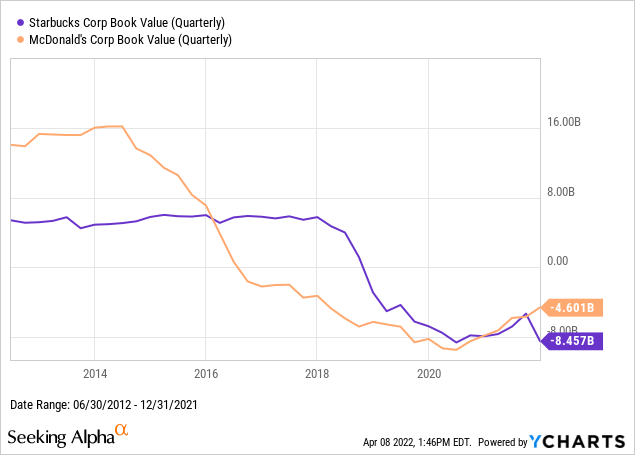
Another way of measuring the impact of buybacks on these two companies is by looking at how these buybacks drove the equity book value of both companies to nine-figure negative numbers. I see book value as a still-relevant and increasingly under-appreciated financial metric, and understand negative book value as a company effectively borrowing against its future earnings to make current buyback or dividend payments.
That said, we will see in the next section why bond yields over the past decade might have made this borrowing look attractive for shareholders.
Returns on Capital vs Cost of Capital
Looking at the two businesses side by side, SBUX has consistently been a significantly more profitable business than MCD, as measured by their rates of return on invested capital. However, both are consistently profitable enough to make attractive investments at the right valuations.
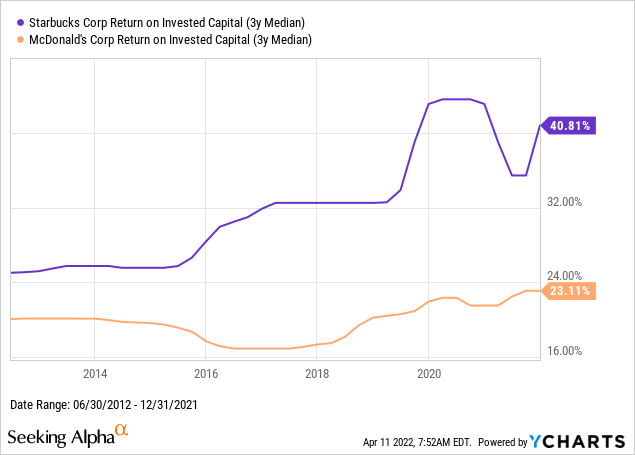
With a business that consistently earns double digit rates of return on capital, it makes sense to borrow as much as possible at low single digit fixed rates for 20-30 year time horizons. This levers up these returns for equity holders.
This next chart shows the market yield for Starbucks’s 4.30% 2045 bonds, and McDonalds’s 4.60% May 2045 bonds have a very similar chart. SBUX and MCD also both happen to be rated Baa1/BBB+, so arguably have some room to lever up a little more before they risk falling into a high yield / junk rating.
FINRA TRACE / Morningstar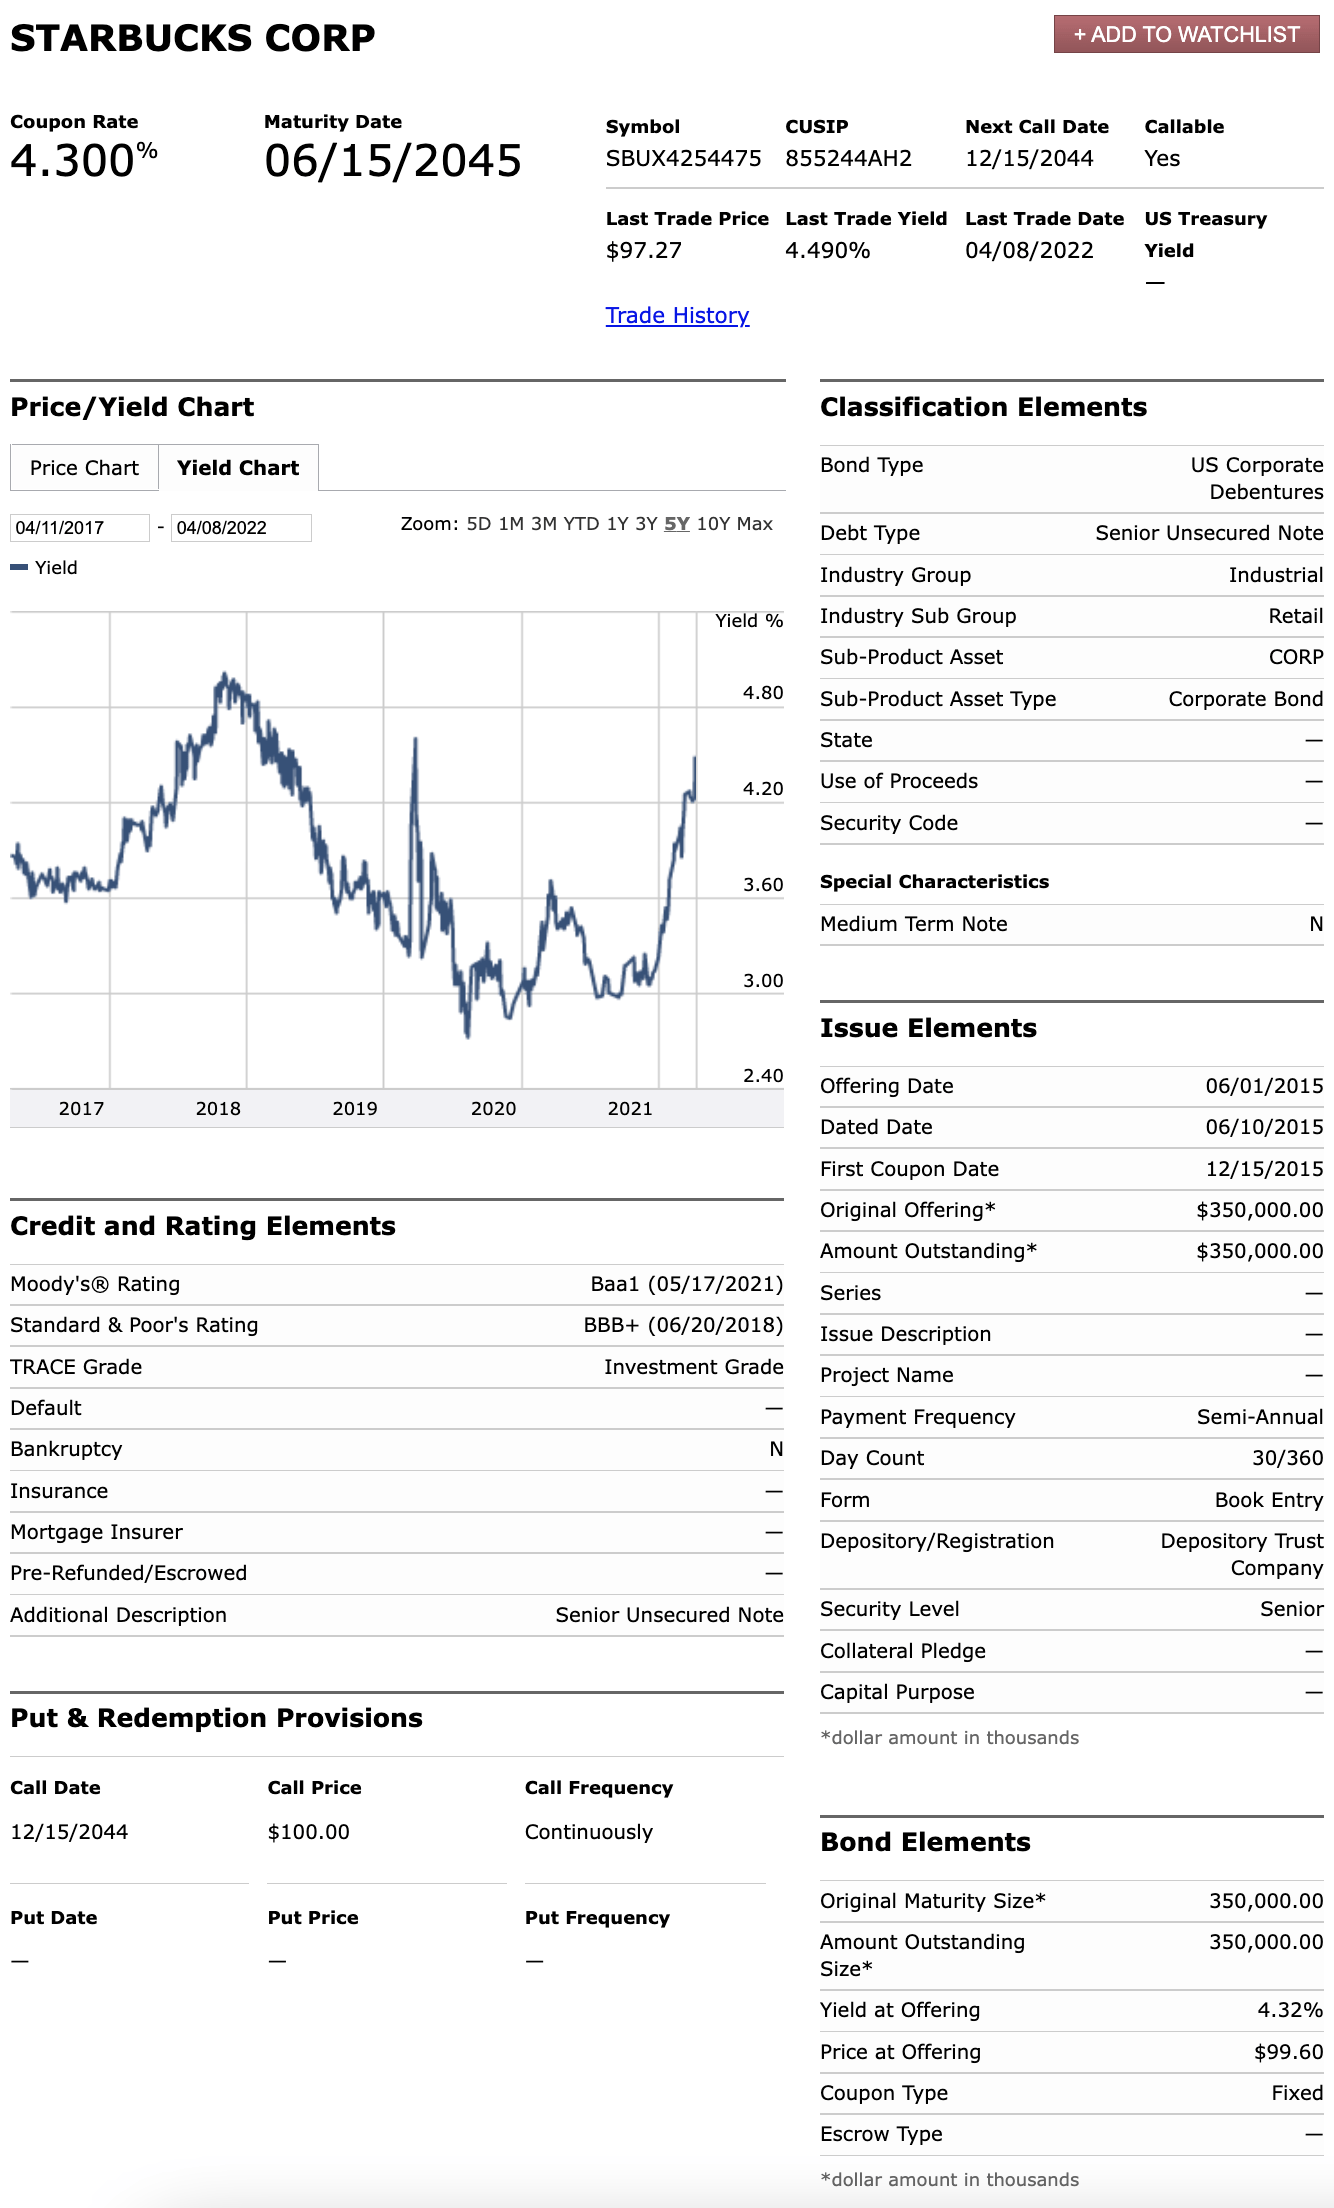
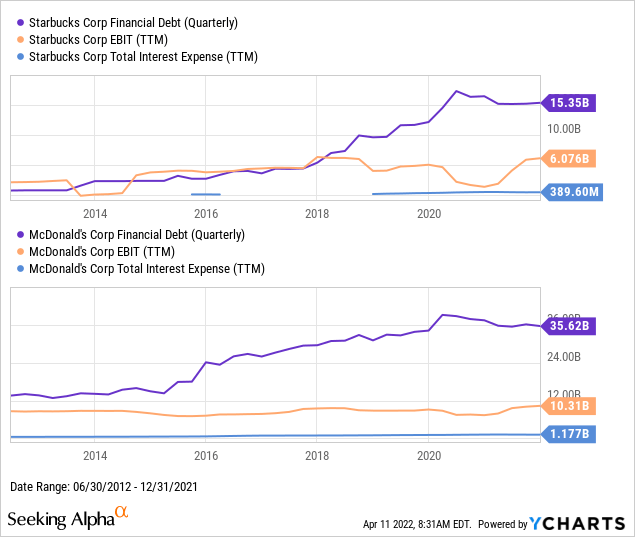
Looking at debt metrics of these two companies over the past decade, we see a significant rise in the debt levels of both companies from around 2015 until the start of the COVID pandemic in early 2020, while the pre-interest earnings of these companies remained relatively flat over those 5 years. That said, these pre-interest earnings still cover those interest costs by such a significant multiple that the leverage seems to still be clearly benefiting the equity holders of both companies for the foreseeable future.
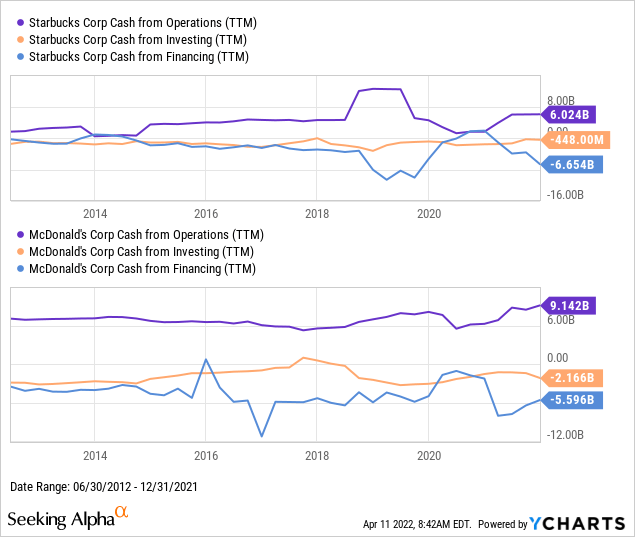
Another way of looking at SBUX’s higher rates of return on capital is by looking at the significantly lower share of SBUX’s cash flows allocated to reinvestment rather than to shareholders. Below is the 10-year cash flow chart of the two companies. The main other observation here is when SBUX’s cash flow from financing became significantly and consistently more negative than its cash flow from investing, which I view as a sign of SBUX’s shift from a “growth” company to an “income” company. MCD, by the same metric, was already solidly an “income” company.
SBUX vs MCD: Expected Returns & Conclusion
The main conclusion I can draw from the above charts about why SBUX’s total return only matched that of MCD’s, despite 2012 forecasts likely being right about the former outgrowing the latter, is that SBUX was priced too optimistically and MCD too pessimistically, and the two reverted to the mean. Now that both around trading at around the same dividend yield, the decision of which one is the better buy really should come down to which one we expect to deliver the higher rate of future dividend growth.
If we take Seeking Alpha’s dividend estimates at face value, we see the forecast of SBUX’s dividend growing from $1.84/share/year in 2021 to $2.34 in 2024 (CAGR ~ 9%/year) is about 3%/year higher than MCD’s growing from $5.25 in 2021 to $6.20 in 2024 (CAGR ~6%/year). Seeing that SBUX has continued to deliver higher rates of return on capital as it has grown, and that returning CEO Schultz plans to divert what might have gone into buybacks into reinvestments earning that high rate of return on capital, I think it is fair to expect that SBUX’s dividend growth rate will be higher for at least the next few years.
If we project those yields and growth rates on to a simpler version of the dividend growth expected return model, where we assume away changes in market yield, we get:
SBUX Expected Return = 2.3% yield + 9% dividend growth = 11.3%, vs
MCD Expected Return = 2.1% yield + 6% dividend growth = 8.1%
Beyond 2024, I think SBUX will continue to see more room for growth, both in terms of the greater number of revenue channels it can expand on (branded products sold in stores, financial services on its gift cards and mobile apps, etc.), and in unsaturated foreign markets. According to MCD’s 2020 annual report, page 50, over 60% of MCD’s revenues, and over 50% of operating profits, from 2018-2020 already came from outside the US. By contrast, if we look at SBUX’s 2021 annual report, page 79, we see that less than 33% of SBUX’s revenues so far come from outside the United States, and almost 90% of that 33% comes from just four countries: China, Japan, Canada, and the UK.
Although there is of course risk to that future growth, I see SBUX as the more profitable company with more growth ahead of it. It is a clearly better buy than MCD if I can buy them both at the same yield.
Be the first to comment