

Dmytro Aksonov/E+ via Getty Images
Both T. Rowe Price (NASDAQ:TROW) and Franklin Resources (NYSE:BEN) are well-known active investment management firms with approximately $1.6 trillion in assets under management each. I published a general overview about Franklin Resources in January and T. Rowe Price in early March. In this follow-up article, I will discuss long-term growth and profitability, including consideration of stock-based compensation, historical net cash flows from clients, and probably most importantly, how both companies performed during the dot-com crash and the Great Recession. I consider this particularly revealing because both companies pay very generous dividends and their earnings – and consequently the safety of the dividends – are closely tied to the performance of securities markets. On the SEC’s EDGAR website, BEN’s annual reports are available from fiscal 1994 until fiscal 2021. For comparability, however, I have only included data from fiscal year 1999 onward in my analysis, since TROW’s annual reports for earlier years are not available.
Earnings Growth and Profitability
Assets under management (AUM), along with operating profitability, provide the most insight when analyzing asset managers, as they are the basis for the firms’ fee-based revenues. BEN reported $218 billion in AUM at the end of fiscal 1999, whereas TROW reported $180 billion. At the end of fiscal 2021, TROW and BEN reported AUM of $1.7 trillion and $1.5 trillion, respectively. Most of the growth is attributed to the strong performance of securities markets. TROW generally grows organically, but the recent acquisition of Oak Hill Advisors (OHA), which raised AUM by $56 billion, is an exception to this rule. In contrast, BEN acquires other companies from time to time, and its 2020 acquisition of Legg Mason (LM) for $4.7 billion in cash plus $2 billion in debt roughly doubled AUM to $1.5 trillion. Over the last 23 years, TROW grew its AUM at a compound annual growth rate (CAGR) of 10.7%, whereas BEN’s assets grew at a CAGR of 9.3%. Excluding recent acquisitions, TROW’s compound annual AUM growth rate would still be well above 10%, while BEN would have grown at a much slower CAGR of 6.0%. Figure 1 illustrates the historical operating revenues of the two companies and clearly shows that TROW was able to grow its revenues much more consistently, while BEN experienced particularly strong growth until the Great Recession. Also, TROW’s operating margin has been very stable over the past two decades, at 42% on average (4% standard deviation), whereas BEN’s historical operating margin has been comparatively weaker at 30% and also more volatile with a standard deviation of 6%.
Figure 1: Historical operating revenues of TROW and BEN (own work, based on the 10-Ks of each company from 1999 to 2021)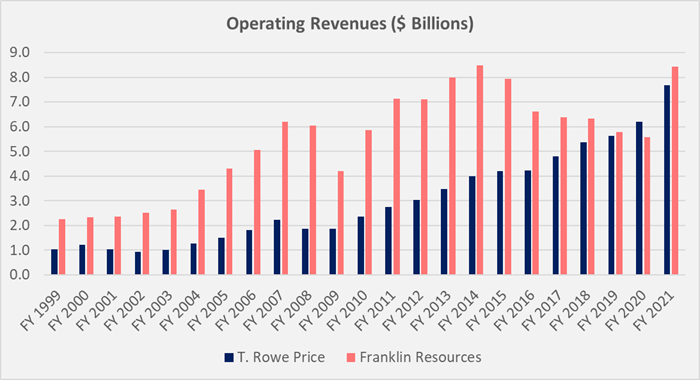
TROW’s much more consistent performance is also evident when comparing the companies’ operating earnings. BEN grew its earnings in a rather volatile manner at a CAGR of 5.8% and the acquisition of LM contributed significantly to the company’s earnings growth. By contrast, TROW’s operating profits grew at a compound average rate of 10.5%, almost in line with revenues. Largely due to the increasing popularity of low-cost exchange-traded funds, the fee rates of both companies have declined over the past two decades, but that of TROW has declined comparatively less (Figure 2). Interestingly, BEN’s weighted average management fee rate of typically 90 to 100 basis points (bps) was much higher than TROW’s fee rate of about 50 bps. However, in part due to the acquisition of LM and the intensely competitive nature of the asset management business, BEN’s fee rate is now nearly the same as TROW’s.
Figure 2: Historical weighted-average management fee rates for TROW and BEN, calculated by dividing annual operating income by average AUM (own work, based on the 10-Ks of each company from 1999 to 2021)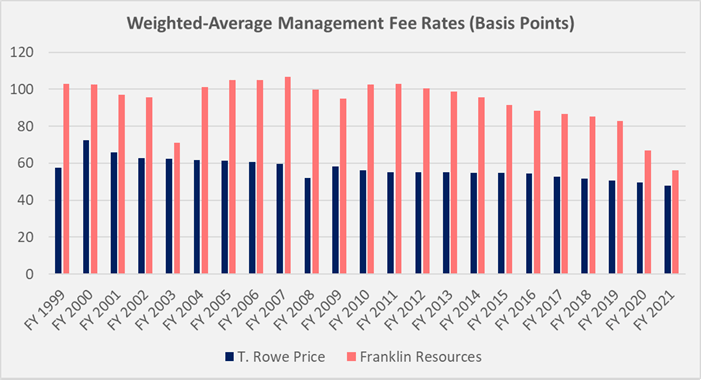
While the trend towards low-cost, passively managed investment vehicles is evident from the historical net inflows of both companies in Figure 3, TROW still managed to retain its clients’ funds and even record occasional inflows of new capital. In contrast, BEN continues to experience significant net outflows, due in part to its less competitive fee rate (see above), but also to the company’s equity offerings in the U.S., which struggle to consistently outperform benchmarks.
Figure 3: Historical net client cashflows for TROW and BEN; note that client cashflows could not be reconstructed for TROW in the years 1999 to 2001 (own work, based on the 10-Ks of each company from 2002 to 2021)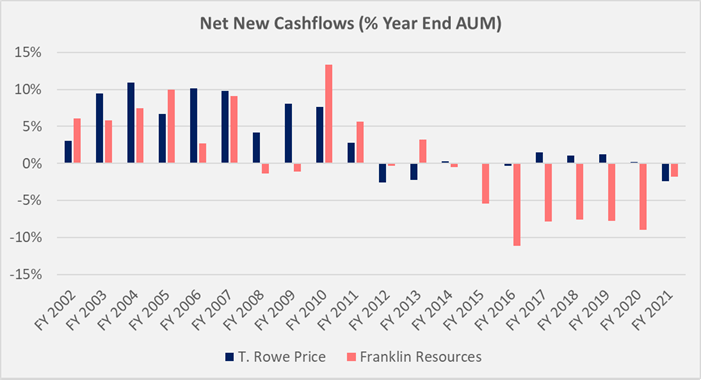
Stock-based compensation expenses in relation to operating income were significantly higher at TROW in the past (Figure 4). The better-incentivized asset managers are likely the reason for the above-average performance of many of TROW’s mutual funds and the firm’s ability to retain clients’ money and even attract new funds. BEN’s future appears somewhat murky, and I noted in my previous article that the company appears to have a problem with rising expenses that are not translating into net inflows from clients. Note, however, that the apparent increases in compensation in fiscal 2009 and fiscal 2020 are mainly attributable to the decline in operating earnings in these years.
Figure 4: Historical relative stock-based compensation expenses for TROW and BEN; note that such compensations were either not granted or not reported before 2006 (own work, based on the 10-Ks of each company from 2006 to 2021)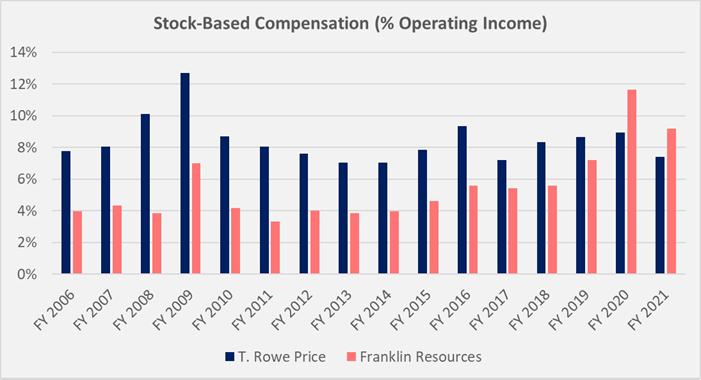
Long-Term Shareholder Returns
Both companies pay a steadily growing dividend and return excess cash to shareholders through occasional special dividends. TROW has been growing its dividend for 36 consecutive years while BEN’s growth streak of 41 years is even more impressive. Dividend CAGRs are pretty similar at 14.6% and 13.2% for TROW and BEN, respectively. Note that these calculations do not take into account the occasionally paid special dividends. Over the past 23 years, TROW and BEN have distributed $9.7 billion and $9.8 billion, respectively, to shareholders, including special dividends.
Investment management firms operate very profitably due to the low capital expenditures and asset requirements. As a result, dividends appear very secure, as evidenced by payout ratios relative to operating income of 27% for TROW and 29% for BEN.
At a current share price of $26.26, BEN’s dividend yield of 4.4% is significantly higher compared to TROW’s 3.4% at a share price of $146. Income-oriented investors should consider the following example, which also illustrates the impact of BEN’s relative underperformance in terms of capital appreciation. Assume that at today’s stock prices, $10,000 is invested in shares of each company. The dividends are expected to grow at a CAGR of 6% going forward and dividends are reinvested under the assumption of a share price appreciation of 6% per annum for TROW and 4% for BEN. Assuming the investments are held in a tax deferred account, the yield on cost after twenty years is 20% for TROW and an even more astounding 41% for BEN.
Both companies also regularly buy back their own shares, partly to offset dilution from stock-based payments, but also to boost earnings per share. Since 1999, TROW reduced the number of shares outstanding by 11%, while BEN reduced the number by 35%. This is in part attributable to the weaker share price performance of BEN and the associated more cost-efficient buybacks. TROW’s share price appreciated at a CAGR of 10.2% since 1999, whereas BEN’s weaker operating performance is clearly reflected in the significantly lower CAGR of the share price of 5.2%.
Could TROW And BEN Cut Their Dividends During A Recession?
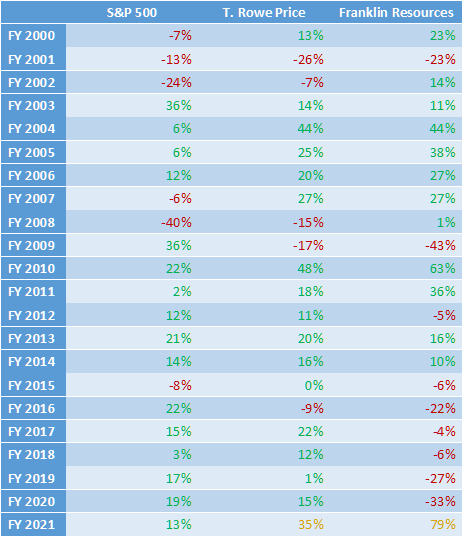
Even though the current yields for both companies are enticing on a risk-adjusted basis, it is important to consider whether the dividends are reasonably safe during a major recession. To this end, I have compared the operating results of each company with the annual performance of the S&P 500 index, both graphically (Figure 5) and in tabular form for ease of readability (Table 1). Note that I calculated the S&P 500 index’ average price for each year, as I believe this is the most accurate comparison to the companies’ earnings.
During the dot-com crash, both companies’ operating earnings declined by more than 20% but recovered very quickly in 2002, although the S&P 500 index performed poorly again this year. During the Great Recession, TROW’s operating profits fell 30% in two years, while BEN saw an even steeper decline of over 40% in a single year. Nevertheless, and given the scale of this stock market crash, this clearly shows that both companies’ dividends are very safe even under such adverse market conditions. TROW’s dividend payout ratio in 2009 was 37%, while BEN’s was even lower at only 16% (up 7% from 2008). In fiscal 2010, BEN even paid a special dividend of $1 per share, resulting in a still very comfortable payout ratio of 45%. Similarly, TROW paid a $1 per share special dividend in 2012. The fact that both companies increased their dividends even during the Great Recession is also a strong indicator of the dividends’ safety going forward. Between 2007 and 2009, TROW and BEN increased their dividends at a CAGR of 15% and 18%, respectively.
In this context, it is also interesting to note that outflows of client funds during the Great Recession were not material for BEN, while TROW actually recorded significant inflows.
Figure 5: YoY change in TROW’s and BEN’s operating earnings, compared to the performance of the S&P 500 index (own work, based on the 10-Ks of each company from 1999 to 2021 and the S&P 500’s weekly closing price) Table 1: YoY performance of the S&P 500 index, compared to TROW’s and BEN’s YoY change in operating earnings; note that the 2021 values are colored yellow to highlight that they may not be comparable due to the acquisitions of OHA (TROW) and LM (BEN); (own work, based on the 10-Ks of each company from 1999 to 2021 and the S&P 500 index’ weekly closing price)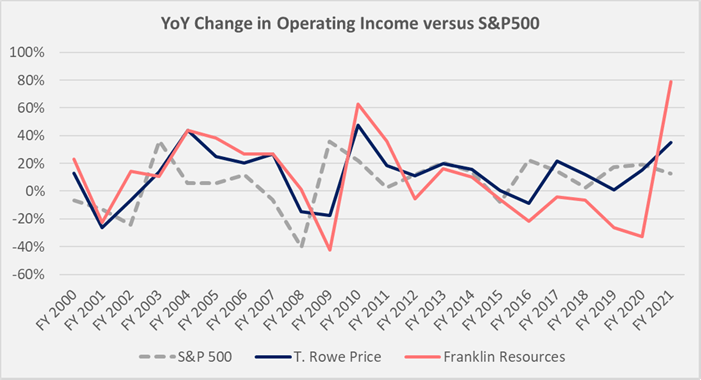
Conclusion
Both T. Rowe Price and Franklin Resources are solid investment managers, as evidenced by their long-term performance during what is probably the strongest bull market in modern history, as well as during the Great Recession and the dot-com crash. Their asset-light business model enables the companies to generate ample amounts of free cashflow, that is generously returned to shareholders via dividends and buybacks. Both companies have grown their dividends over several decades and are expected to continue to do so for the foreseeable future, as payout ratios remain very conservative and would probably not reach critical levels even in the event of a pronounced stock market crash.
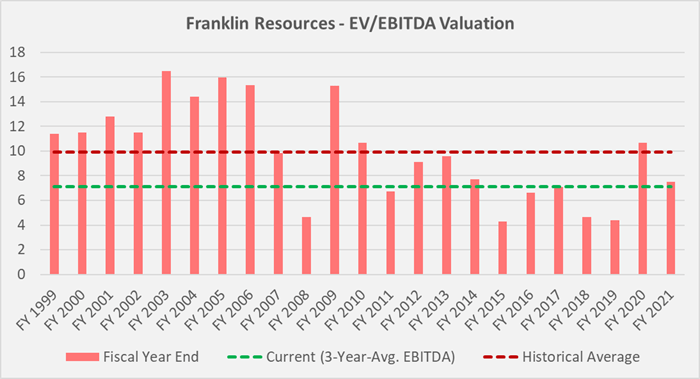
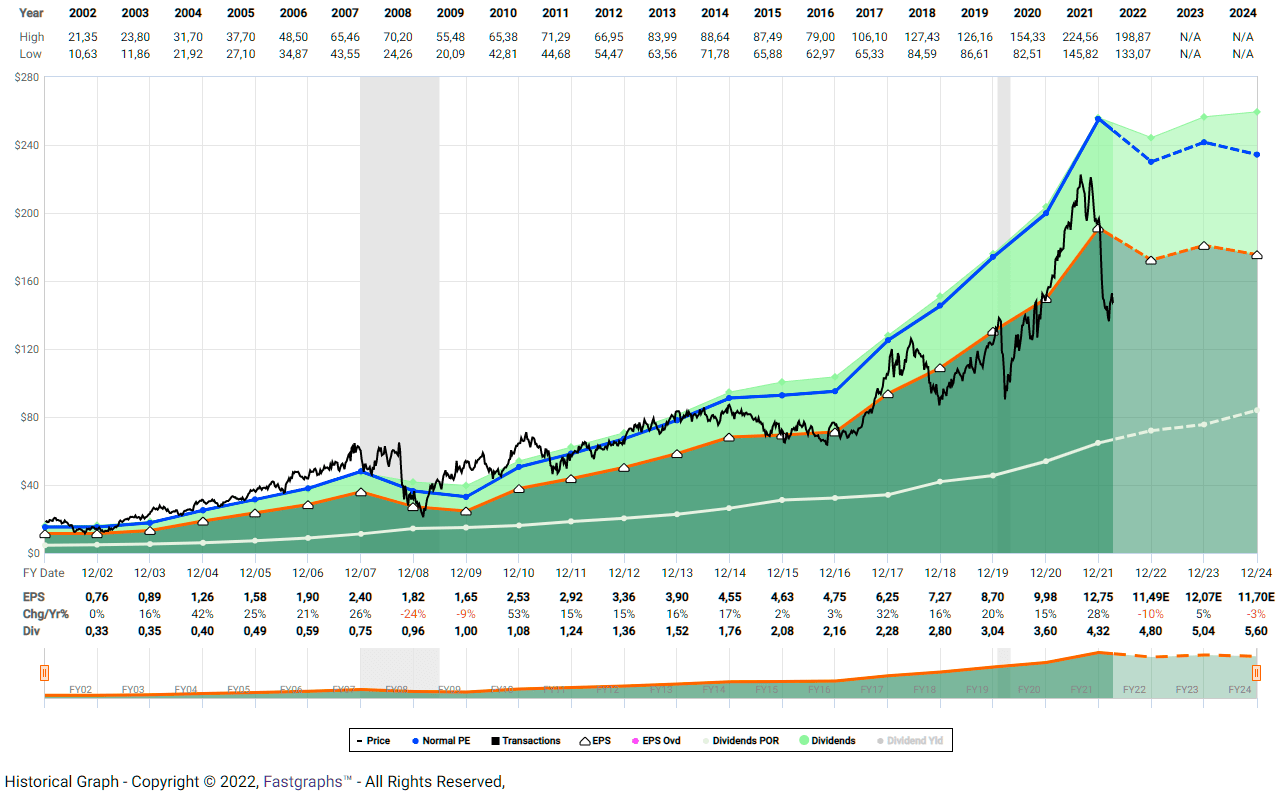
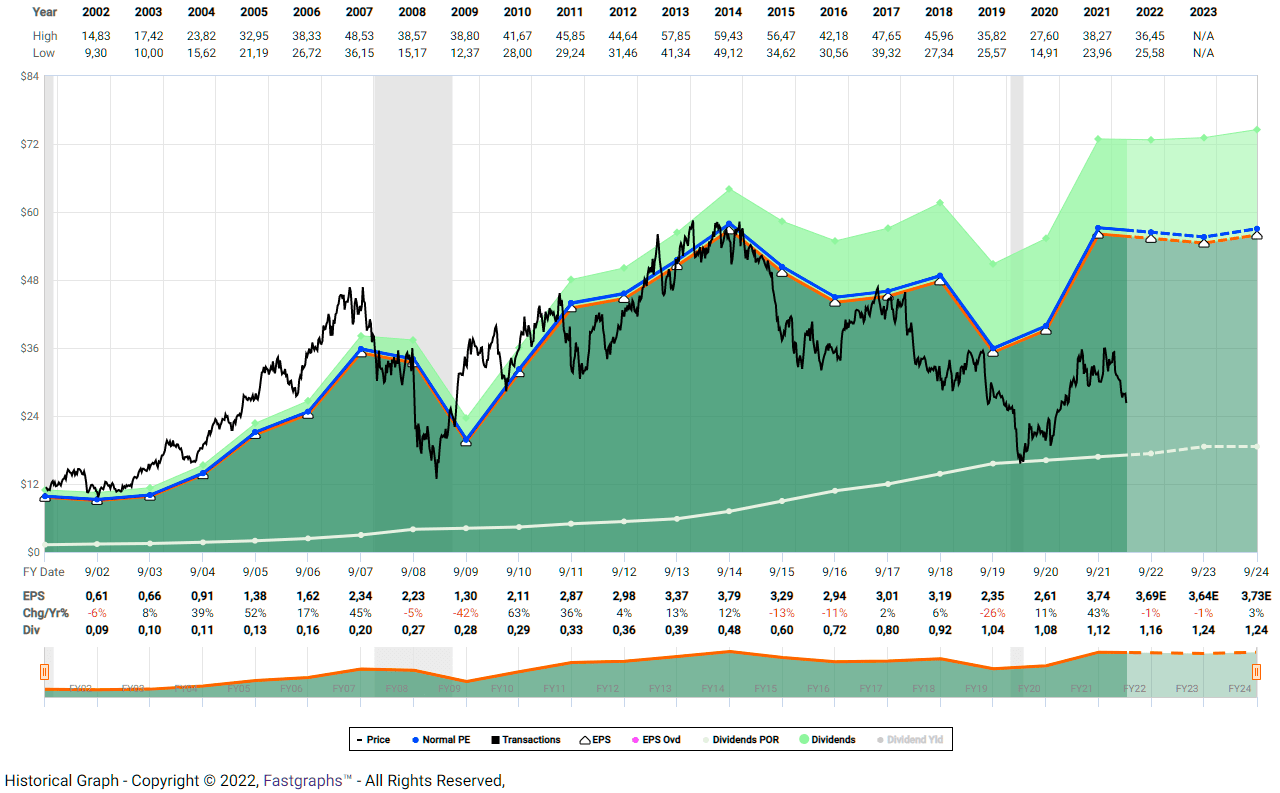
While the dividends of TROW and BEN appear equally secure, the former company shines with much more consistent earnings growth and operating profitability. TROW’s higher quality comes at a price: the company currently trades at an enterprise value (EV) to EBITDA multiple of 10.3 when looking at the three-year average EBITDA, as the staggering 2021 results likely marked an outliner. Compared with the 23-year average valuation multiple of 11.5, the shares are trading at a discount of around 10% (Figure 6). BEN is significantly cheaper with a current EV/EBITDA multiple of 7, and the stock trades at a discount of almost 30% to its historical average multiple of 10.0 (Figure 7). The discount to fair value is also nicely illustrated in the FAST Graphs charts for TROW and BEN in Figures 8 and 9.
Although I believe an investment in BEN is riskier given the company’s difficulty in retaining client funds, not to mention its current inability to attract new funds, I believe it could offer a potentially higher total return if the Legg Mason acquisition bears fruit. TROW is clearly the more conservative investment, and I am personally long the stock. At the current valuation, I am comfortable adding to my still modest position. Even though both companies are expected to further increase their dividends in an upcoming recession, or at least maintain their current payouts, it should be kept in mind that the shares will likely lose significant value in such a scenario due to the strong correlation of earnings with the performance of securities markets.
Figure 6: TROW’s historical valuation in terms of EV/EBITDA; note that each year’s valuation is based on the share price observed during the month the company reported full-year earnings (own work, based on the 10-Ks of each company from 1999 to 2021) Figure 7: BEN’s historical valuation in terms of EV/EBITDA; note that each year’s valuation is based on the share price observed during the month the company reported full-year earnings (own work, based on the 10-Ks of each company from 1999 to 2021) Figure 8: FAST Graphs chart for TROW, based on adjusted operating earnings (obtained with permission from FAST Graphs) Figure 9: FAST Graphs chart for BEN, based on adjusted operating earnings (obtained with permission from FAST Graphs)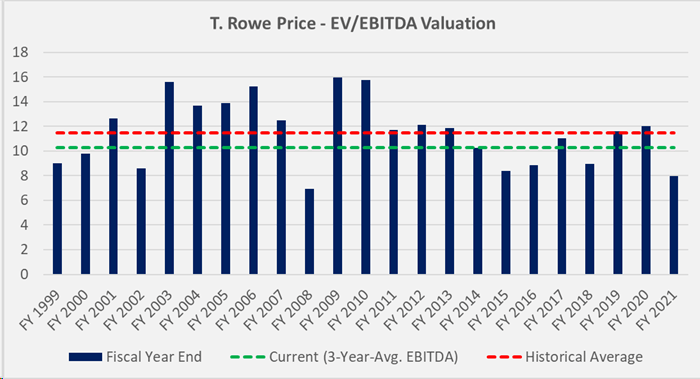
Be the first to comment