

-ilkeryuksel-/E+ via Getty Images
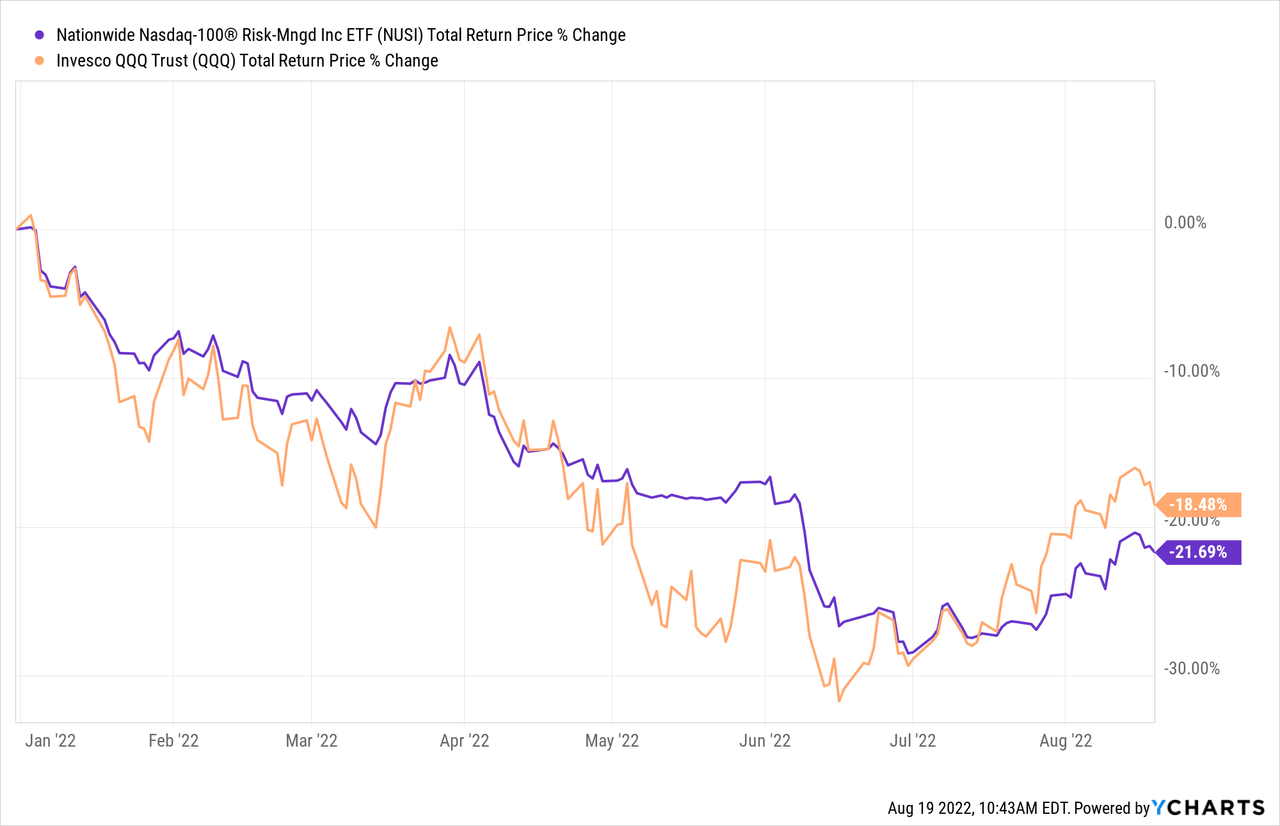
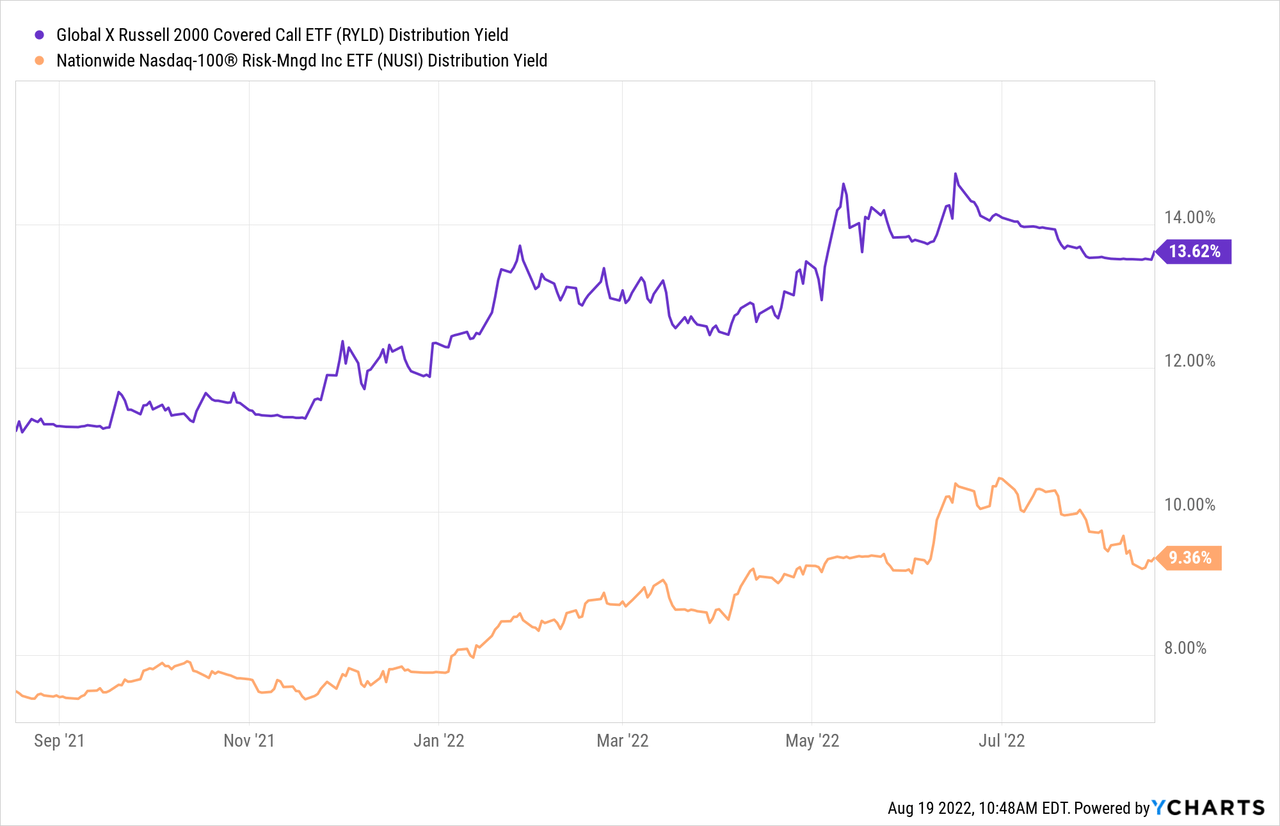
The total return concept is something one would think would be at the core of every investing strategy. After all, you only can make money on your capital, why would you want it to go lower? There are exceptions to that thinking. We are sympathetic to ignoring changes in perceived value of your investment when multiples compress. So if a company does well and its earnings go up, while the market smashes its multiple, we think that is a good case to ignore the total return for a while. On the other hand, we have struggled to grasp how people ignore NAV changes on mortgage REITs like Annaly Capital Management (NLY) or AGNC Investment Corp. (AGNC) while getting excited about a reducing income stream. The same concept applies on funds, where NAV is something that has to be watched, before you look at the distributions. We have spoken about Global X Russell 2000 Covered Call ETF (NYSEARCA:RYLD) and Nationwide NASDAQ 100 Risk-Managed Income ETF (NYSEARCA:NUSI) before and those are the two we are referring to in terms of NAV changes.
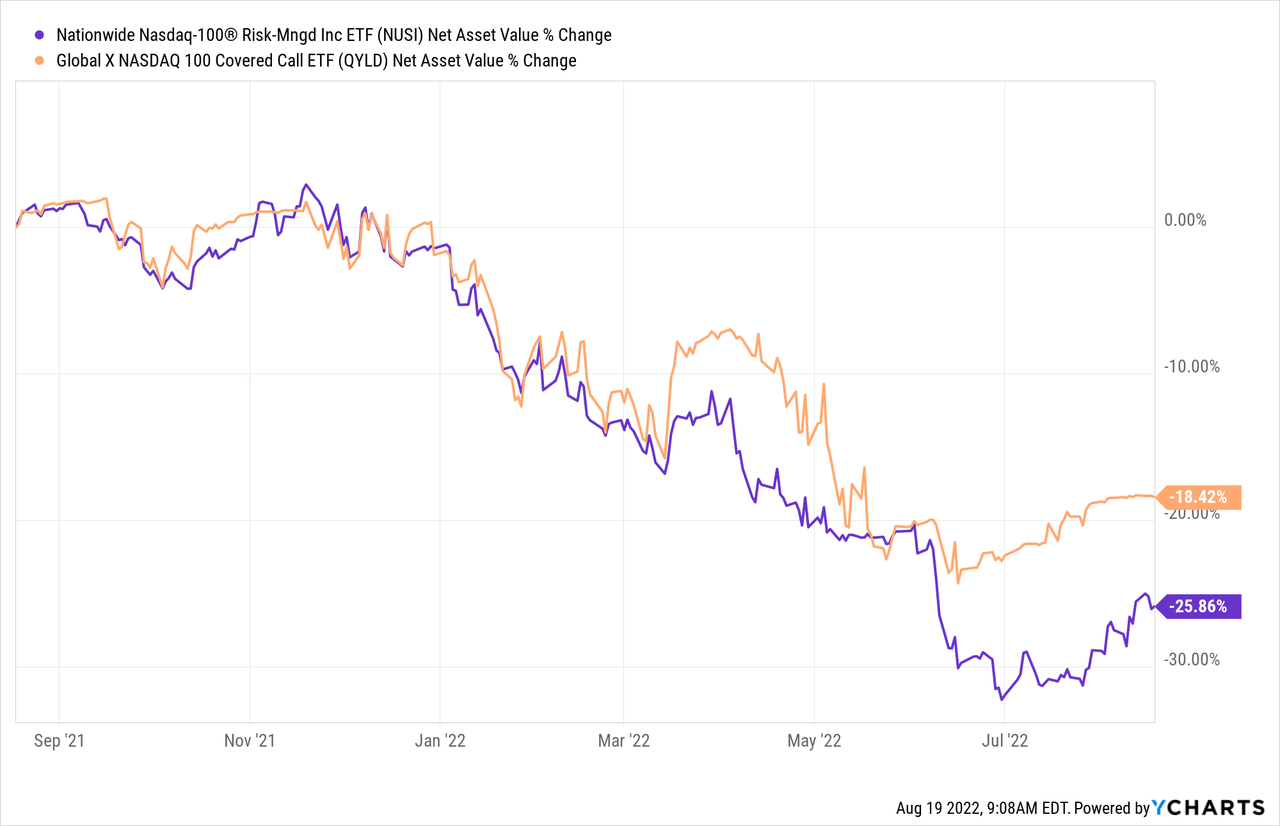
Those lines tell you a story and that story is that you did not make money in any real sense, despite what the distributions told you.
A Head To Head On Strategies
While the funds appear similar superficially and designed to “milk” income from the market, they are quite different. In the same vein, while we rated both as “hold” the last time around, we do think the two funds offer very different risk-reward ratios over the longer run. So let’s talk about that for those who are interested in deploying capital here. There are four differences we want to explore today.
Large Cap Vs Small Cap
NUSI is based on the NASDAQ 100 index and is made up of giants like Apple Inc. (AAPL), Microsoft Corp (MSFT) and Amazon.com Inc. (AMZN).
NUSI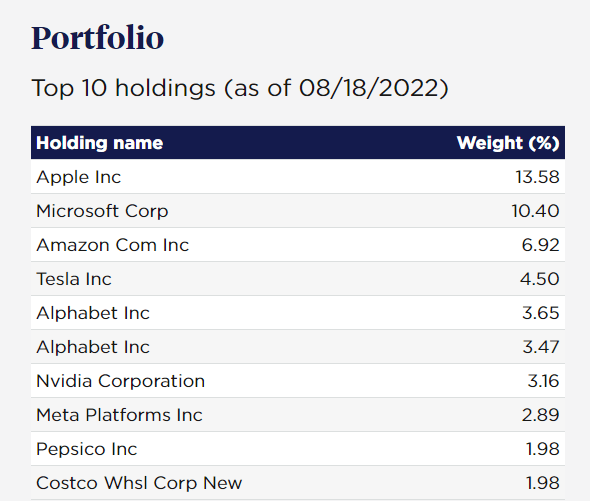
The median market capitalization in this fund is around $50 billion. These are large companies.
RYLD is based on the smaller cap index of Russell 2000 and the largest company is under $10 billion in market capitalization. The median market capitalization is around $1.0 billion.
FTSE Russell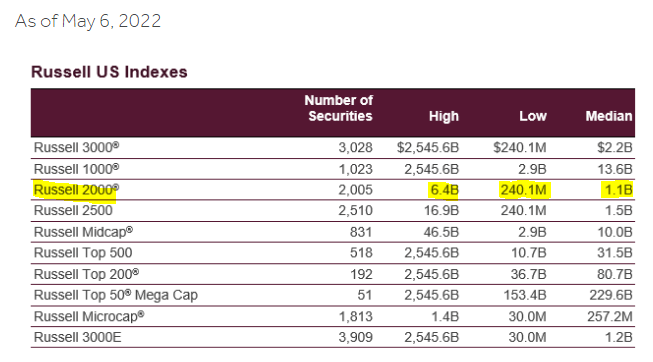
At current valuations, the advantage clearly lies with the small cap Universe. Currently, the small cap Universe is close to as cheap as it gets versus large caps.
NDR Research on Twitter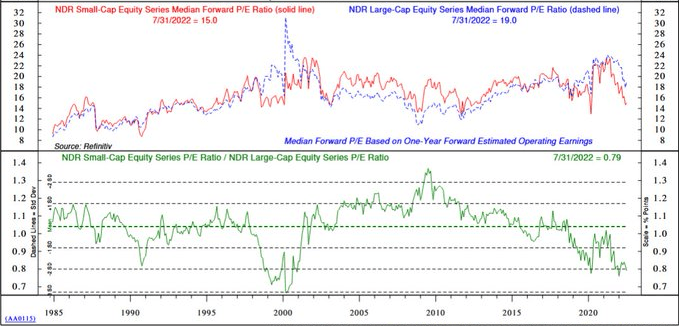
So we would give RYLD an edge based on this. One word of caution here is that P/E ratios are calculated on profitable companies and the loss makers are excluded. Currently the small cap Universe has a lot of these.
Sector Allocations
With NUSI you are looking at about as close to an all-in bet on three sectors. Information technology makes up half of the holdings and two others push the total holdings over 80%.
NUSI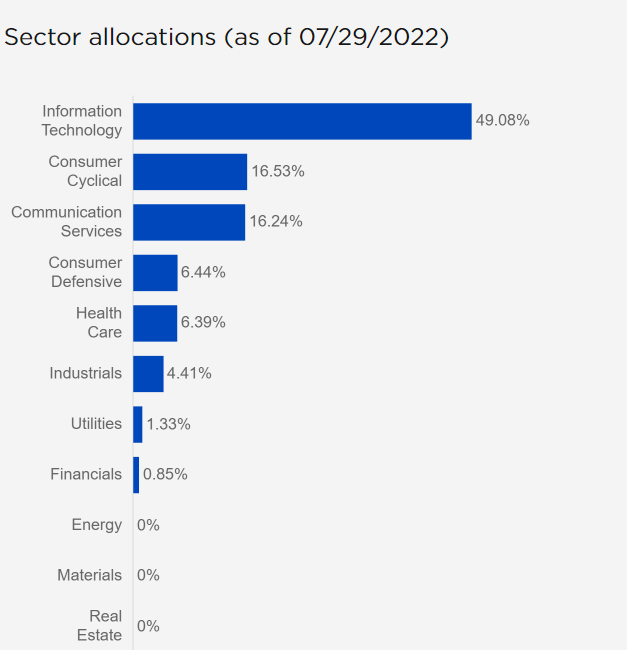
Remarkably, Energy, Materials and Real Estate are at a literal 0% allocation.
RYLD is heavily into financials and the three inflation hedging sectors shown above make up about 18% of the total.
Morningstar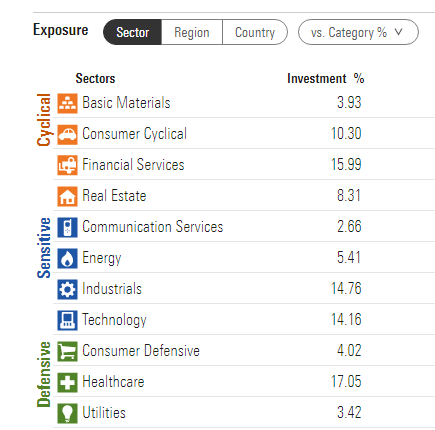
We again see this allocation as favorable for RYLD vs NUSI based on our macro-outlook.
Strategy
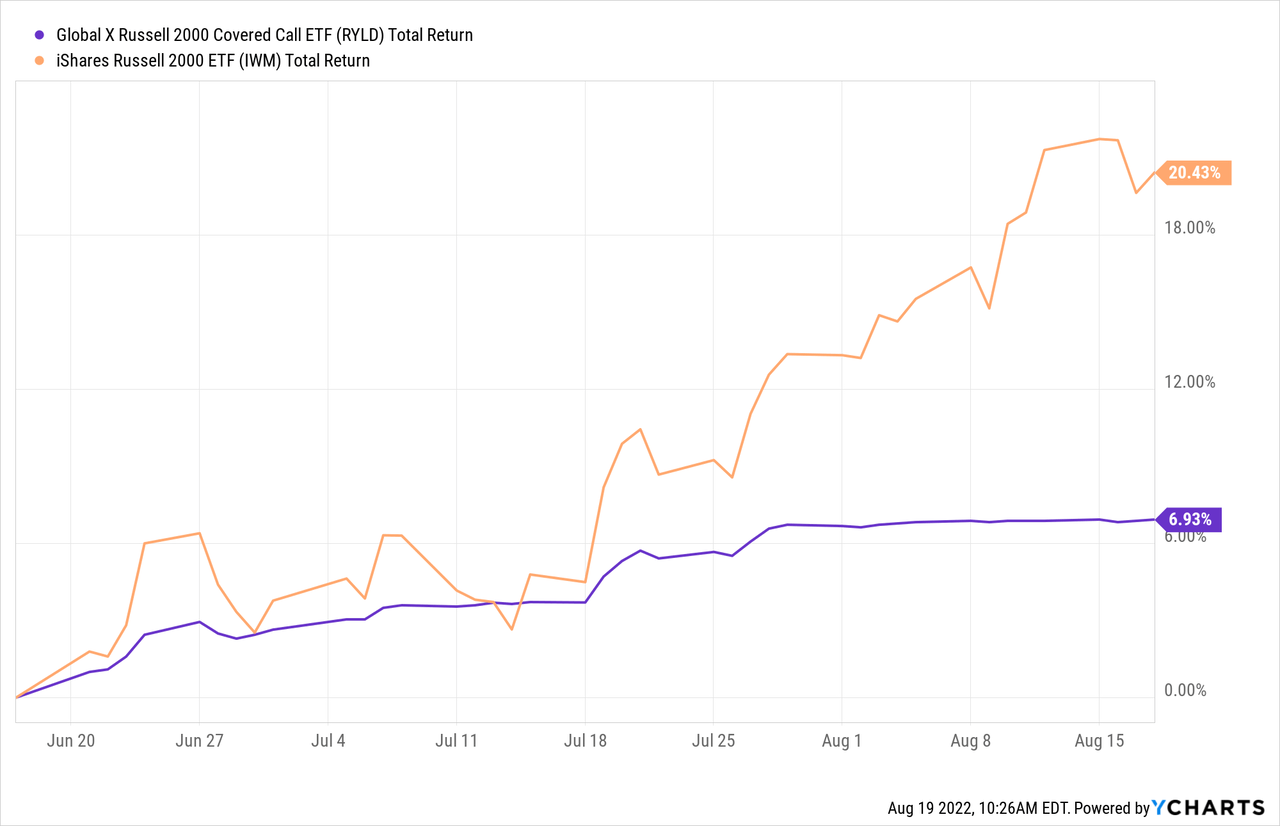
Covered Calls are a simple strategy that most option newbies can also grasp. RYLD employs that. What we don’t like about the strategy as employed by RYLD is that it uses shorter term options that provide limited buffering and also tends to lose upside in rallies with little compensation. You can see that when you compare performance off the bottom.
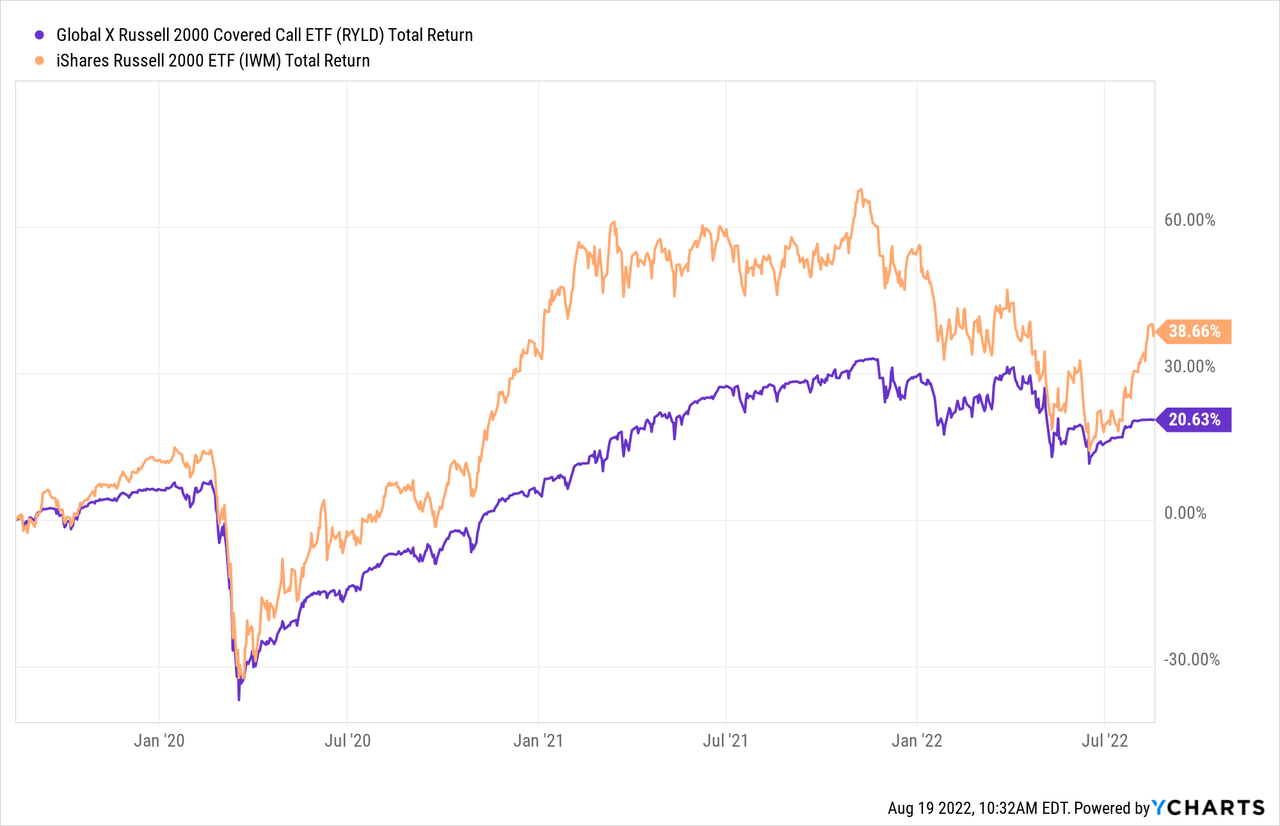
“Yeah, but I lost less when things went south”, you might argue. That is true over some time frames. But with a blind option selling strategy it is a roll of the dice. Those large premiums you get are not free and you can lose out. Here is total return including distributions over the last three years vs IWM.
So while we like Covered Calls, we are not remotely enthralled by the manner in which it is done here.
NUSI employs a collar, which uses a sold call and a cheaper bought put. NUSI just got new options and you can see that sold call shows a negative 1.97% vs the bought put at a positive 1.04%.
NUSI
The difference is the income generated. This squanders potential upside till September 22 option expiration above 13,675 on the NASDAQ 100 index and protects below 12,850. Based on yesterday’s closings, you can see that only way to generate this income is to sell the call very close to the current price. This strategy is similar to covered call in producing whipsaws but it protects against huge, sudden drawdowns. We will note here that the drawdown has to be sudden, like COVID-19, otherwise generally collars protect poorly against slow steady declines. Year to date, NUSI’s total return has actually been worse than QQQ, underscoring this issue.
Overall, we still think RYLD’s strategy comes out ahead, mainly because it is not spending money on buying puts.
Verdict
On all four criteria, RYLD wins in our opinion over NUSI. Of course, for investors focused on just income, RYLD wins as well.
So while we rate both as neutral and would not invest in either at this point, if we really were forced to choose, we would buy RYLD.
Please note that this is not financial advice. It may seem like it, sound like it, but surprisingly, it is not. Investors are expected to do their own due diligence and consult with a professional who knows their objectives and constraints.
Be the first to comment