

rticknor
Introduction
Denver-based Royal Gold Inc. (NASDAQ:RGLD) is one of the solid streamers I have regularly covered on Seeking Alpha since September 2018.
This article covers the recent earnings 2Q22 released on August 4, 2022, and all new information. My preceding article on RGLD was published on August 26, 2022.
1 – 3Q22 Results Snapshot and recent activity
Royal Gold posted a net income of $45.79 million, or $0.70 per diluted share, compared to $70.18 million, or $1.07 per basic and diluted share, for the September 30 quarter of 2022. The adjusted earnings per share were $0.71 in the third quarter of 2022.
RGLD 3Q22 overview (RGLD Presentation)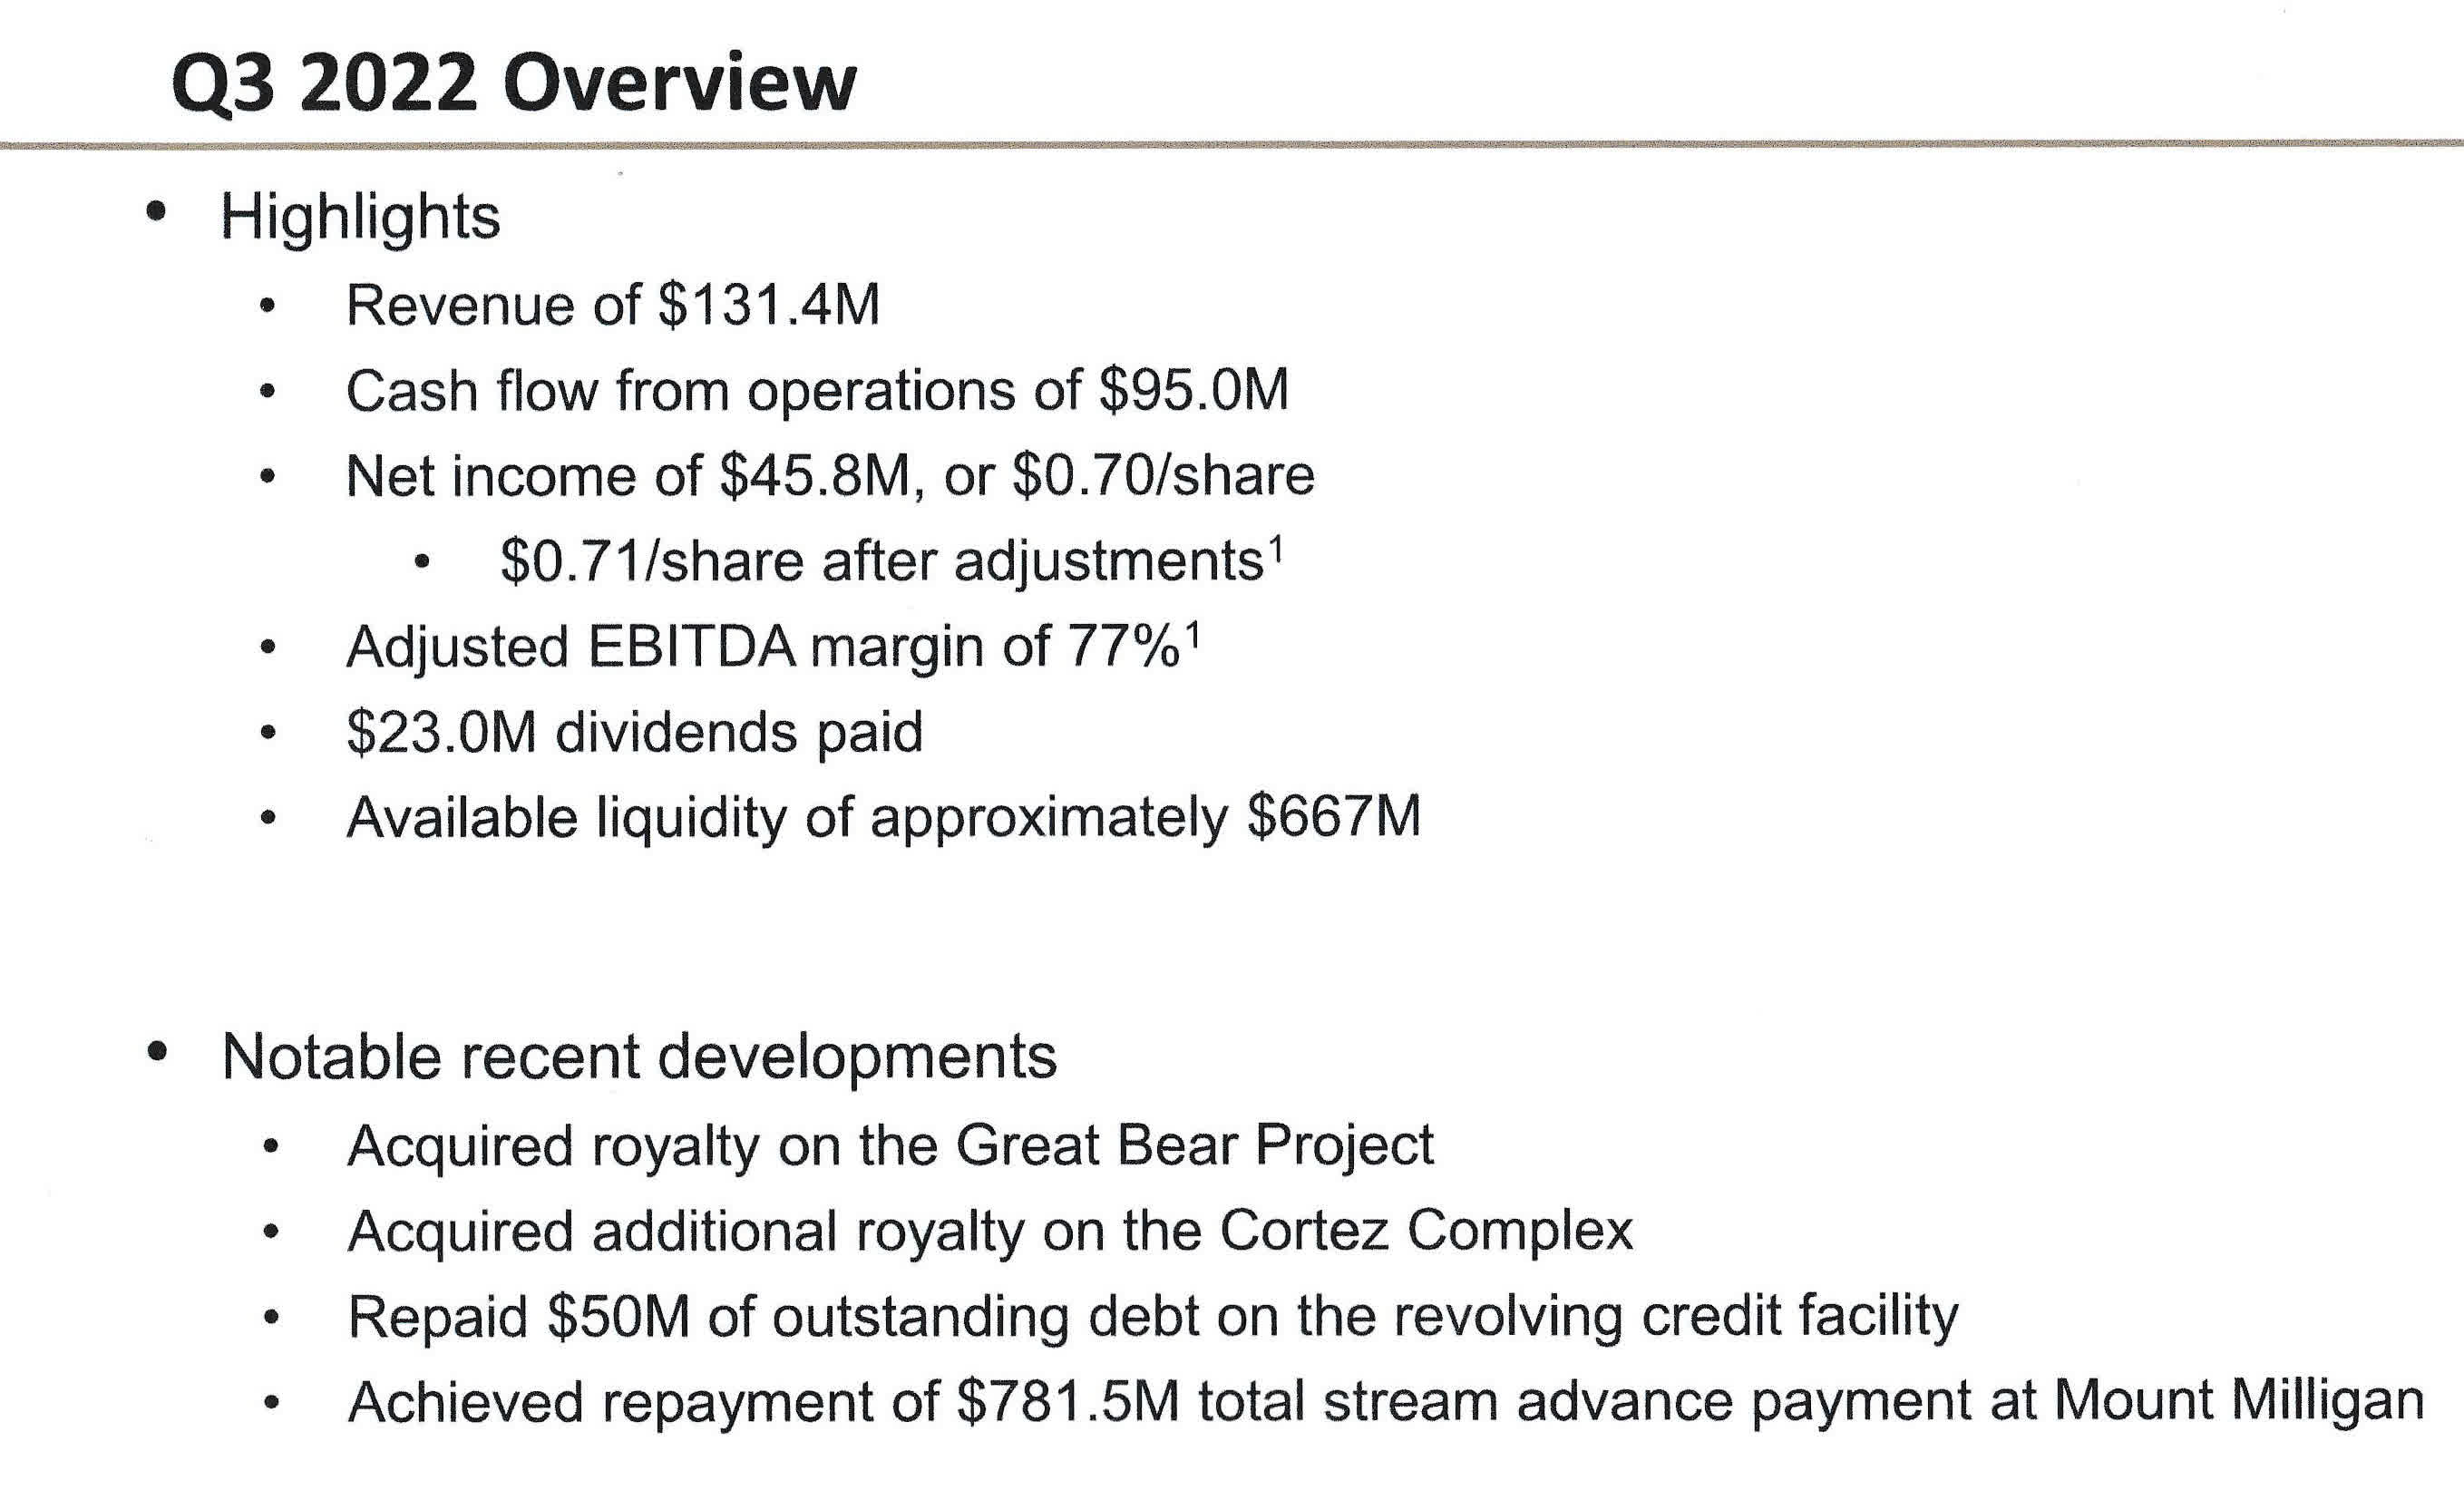
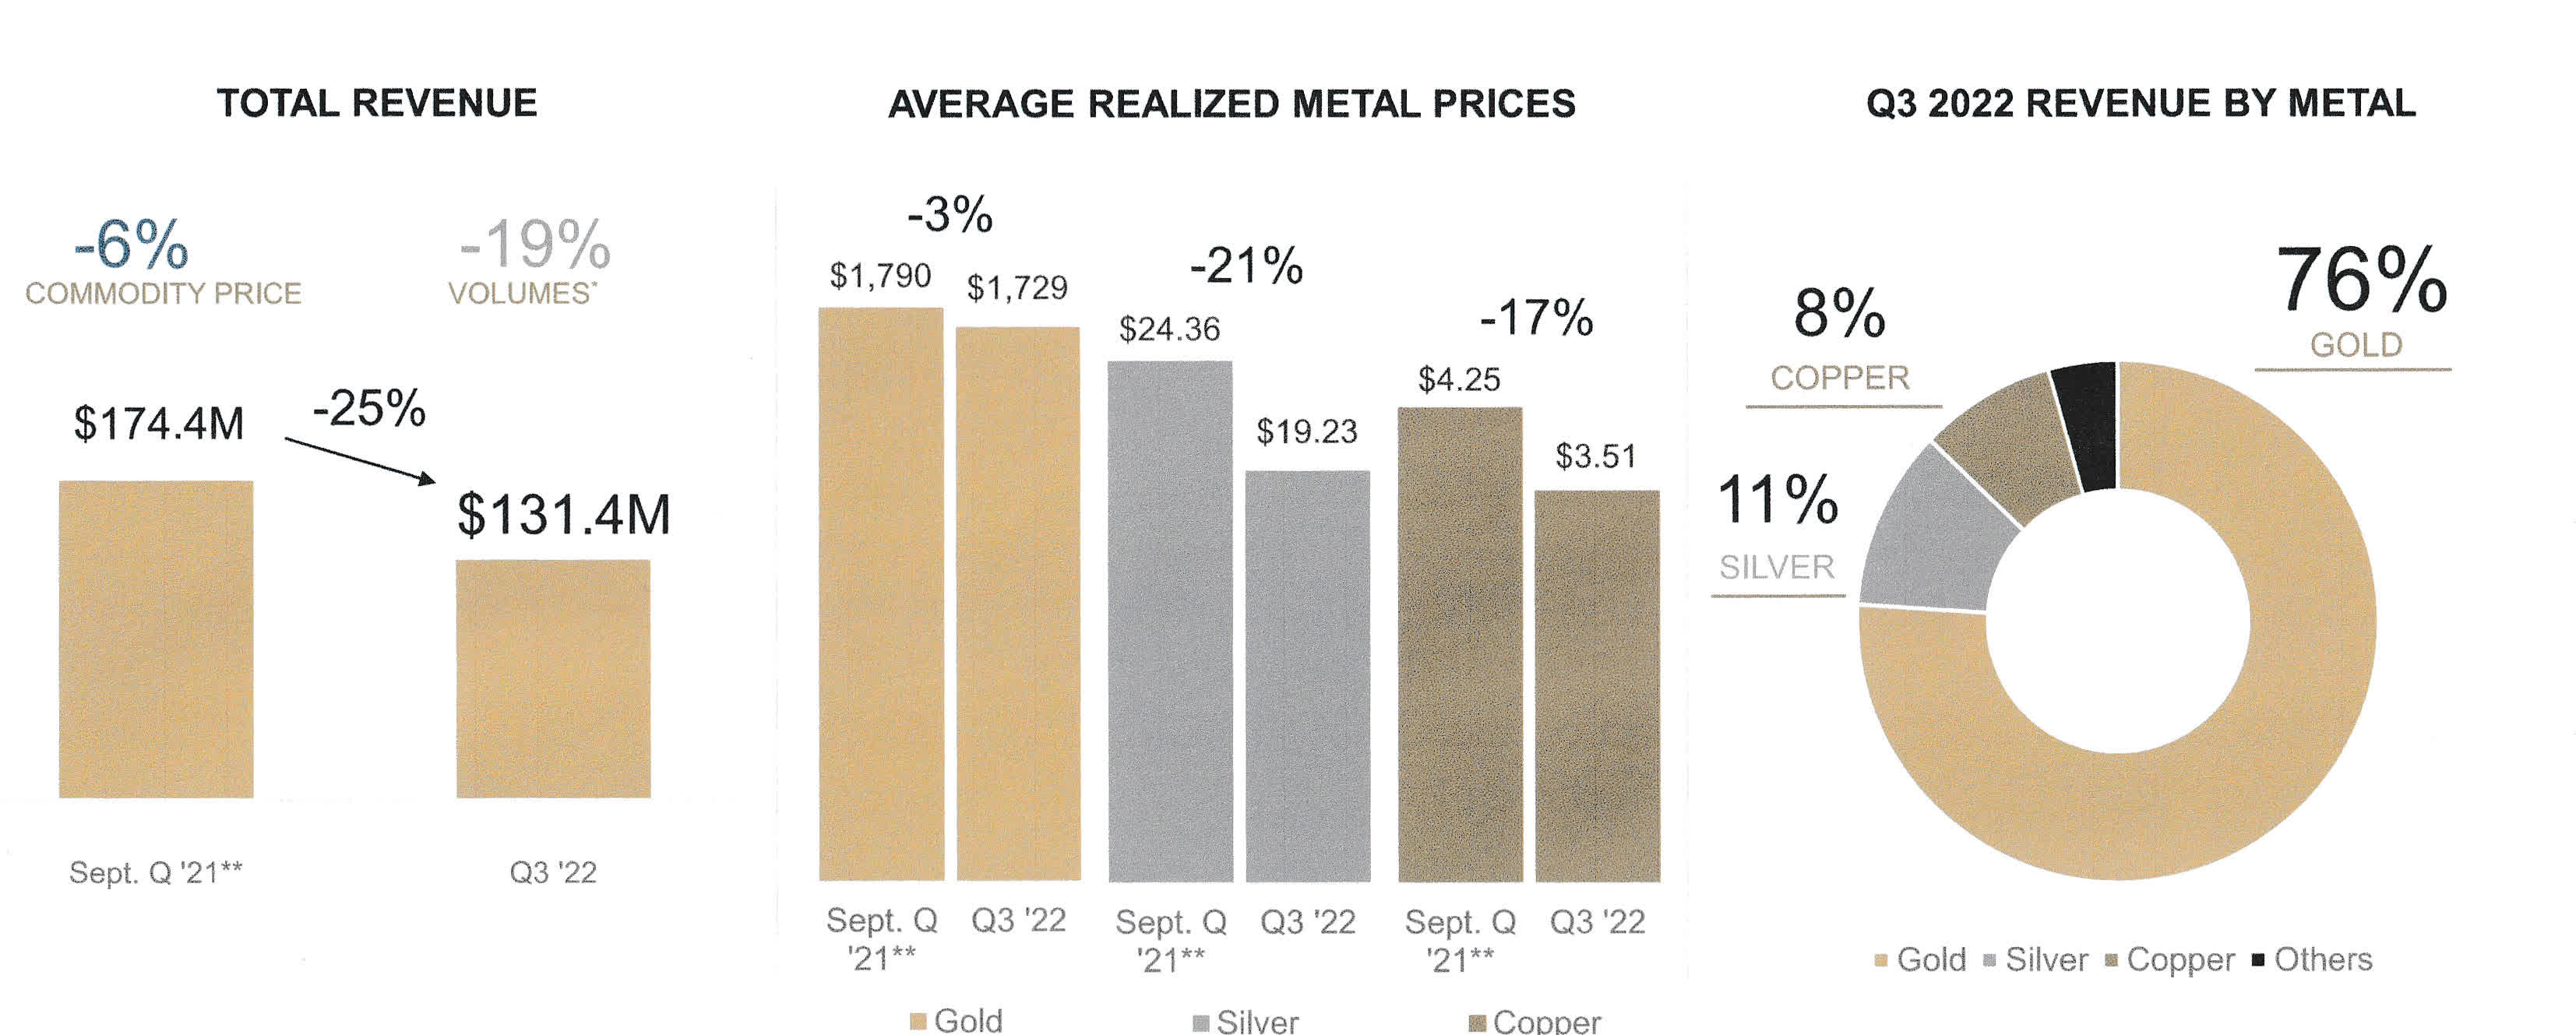
During the third quarter, Royal Gold posted total revenue of $131.4 million, comprised of stream revenue of $98.7 million and royalty revenue of $32.7 million at an average gold price of $1,729 per ounce, an average silver price of $19.23 per ounce and an average copper price of $3.51 per pound.
Gold equivalent production was weak for 3Q22 at 76,0K GEOs.
Royal Gold still has an excellent debt profile with net cash of $122.24 million and $667 million in liquidity.
2 – Investment Thesis
Royal Gold is an excellent long-term investment with significant liquidity at about $667 million after funding two large projects, Cortez’s complex royalty acquisition and long-term growth with the large Bear Lake project.
CEO Bill Heissenbuttel said in the conference call:
While we are not immune from inflationary pressures, our low and stable costs provide protection against margin compression. We were very active on the business development front during the quarter, and we completed two transactions, both of which were previously announced. The first was the acquisition of a royalty on Kinross’s Great Bear project in Ontario. The second was the acquisition of an additional royalty on the Cortez Complex in Nevada.
I do not own RGLD long-term because I already own FNV, WPM, and SAND, but it is one of the strongest with Franco Nevada and Wheaton Precious Metals. Unfortunately, the stock pays a small quarterly dividend of $0.35 per share with a yield of 1.46%, which is about the average in this industry.
Thus, I recommend short-term trading LIFO, 30% of your long-term position, due to the volatility attached to this streams & royalties segment. This dual strategy has been promoted in my marketplace, “The Gold and Oil Corner,” and, I believe, it is the best way to maximize your gain over a long period while reducing the risk of a sudden downturn.
3 – Stock Performance
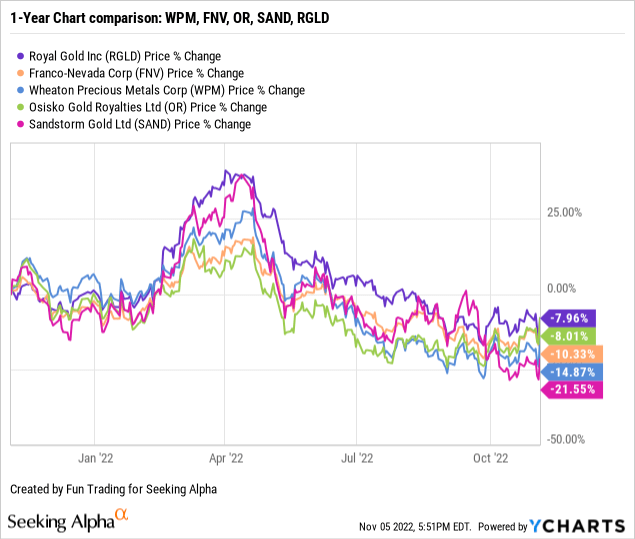
Royal Gold has dropped significantly since April after the FED decided to hike interest by 75 basis points and signaled more increases. In November, the FED hiked interest by an additional 75-point and suggested another 75-point in December. Royal Gold is down 8% on a one-year basis and outperformed its peers.
CEO Bill Heissenbuttel said in the conference call:
We delivered solid operating and financial results in the third quarter, despite pressure from lower metal prices. Revenue for the quarter was $131 million, operating cash flow was $95 million, and earnings were $46 million, or $0.70 per share.
Royal Gold Inc: Balance Sheet And Production In 3Q22 – The Raw Numbers
| Royal Gold | 3Q21 | 4Q21 | 1Q22 | 2Q22 | 3Q22 |
| Total Revenues in $ Million | 174.43 | 168.52 | 162.36 | 146.44 | 131.43 |
| Net Income in $ Million | 70.18 | 68.16 | 65.68 | 71.14 | 45.79 |
| EBITDA $ Million | 139.01 | 132.30 | 130.15 | 110.82 | 103.46 |
| EPS diluted in $/share |
1.07 |
1.04 |
1.00 |
1.08 |
0.70 |
| Operating cash flow in $ Million | 129.89 | 118.90 | 101.13 | 120.20 | 94.99 |
| Capital Expenditure in $ Million | 265.00 | 16.07 | 37.80 | 0.04 | 677.99 |
| Free Cash Flow in $ Million | -135.12 | 102.83 | 63.33 | 120.16 | -583.00 |
| Total cash in $ Million |
160.21 |
143.55 |
183.71 |
280.62 |
122.24 |
| Long-term debt in $ Million | 95.40 | 0 | 0 | 0 | 446.33 |
| Dividend per share in $ | 0.35 | 0.35 | 0.35 | 0.35 | 0.35 |
| Shares outstanding (diluted) in Million | 65.63 | 65.62 | 65.65 | 65.68 | 65.66 |
| Gold Production | 3Q21 | 4Q21 | 1Q22 | 2Q22 | 3Q22 |
| Gold Equivalent ounce Production K Geo | 97.4 | 93.9 | 86.5 | 78.3 | 76.0 |
| Gold price realized $/ Oz | 1,790 | 1,794 | 1,877 | 1,871 | 1,729 |
Data Source: Company release and Fun Trading
Analysis: Revenues, Earnings Details, Free Cash Flow, Debt, And Production Details
1 – Revenues Were $131.43 Million in 3Q22
RGLD Quarterly Revenues history (Fun Trading)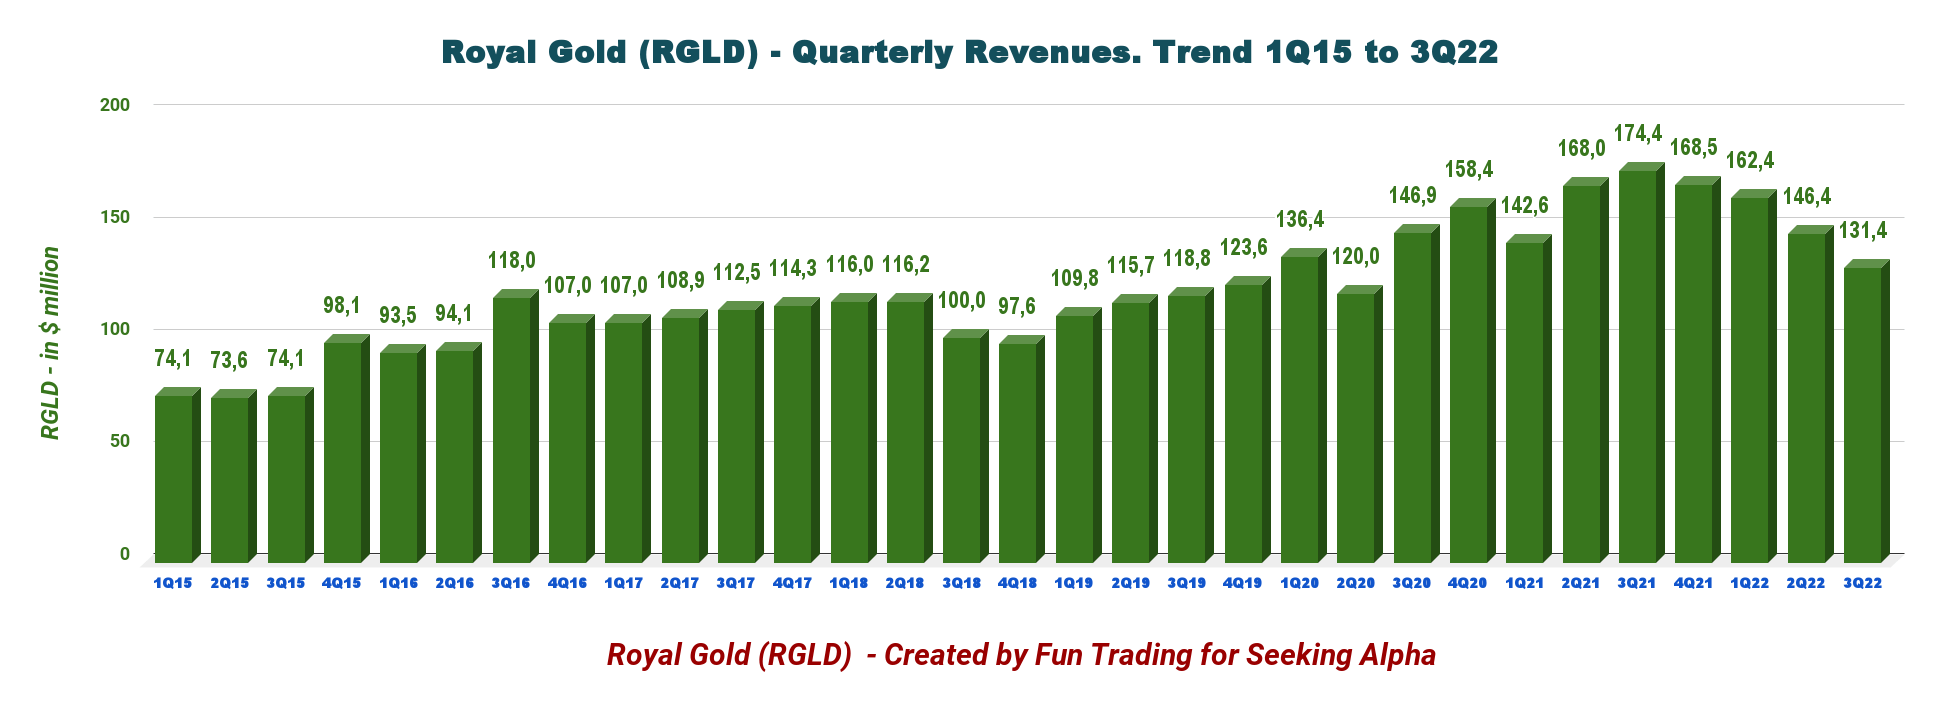
As of September 30, 2022, Royal Gold reported total revenues of $131.429 million, comprised of stream revenue of $98.7 million and royalty revenue of $32.7 million at an average gold price of $1,729 per ounce, an average silver price of $19.23 per ounce and an average copper price of $3.51 per pound.
The cost of sales, which excludes DD&A, decreased to $23.2 million for the third quarter from $27.2 million for the three months that ended September 30, 2021.
The decrease in total revenue resulted primarily from lower gold sales at Mount Milligan and Pueblo Viejo and lower gold production at Cortez and Peñasquito, and lower average gold, silver and copper prices. The decrease was partially offset by higher silver sales at Khoemacau, which shipped its first concentrate during the prior year quarter. (press release)
Net income for the quarter was $45.792 million or $0.70 per diluted share, from $70.18 million or $1.07 per diluted share last year.
2 – Free Cash Flow was a loss of $583.00 Million in 3Q22
RGLD Quarterly Free cash flow history (Fun Trading)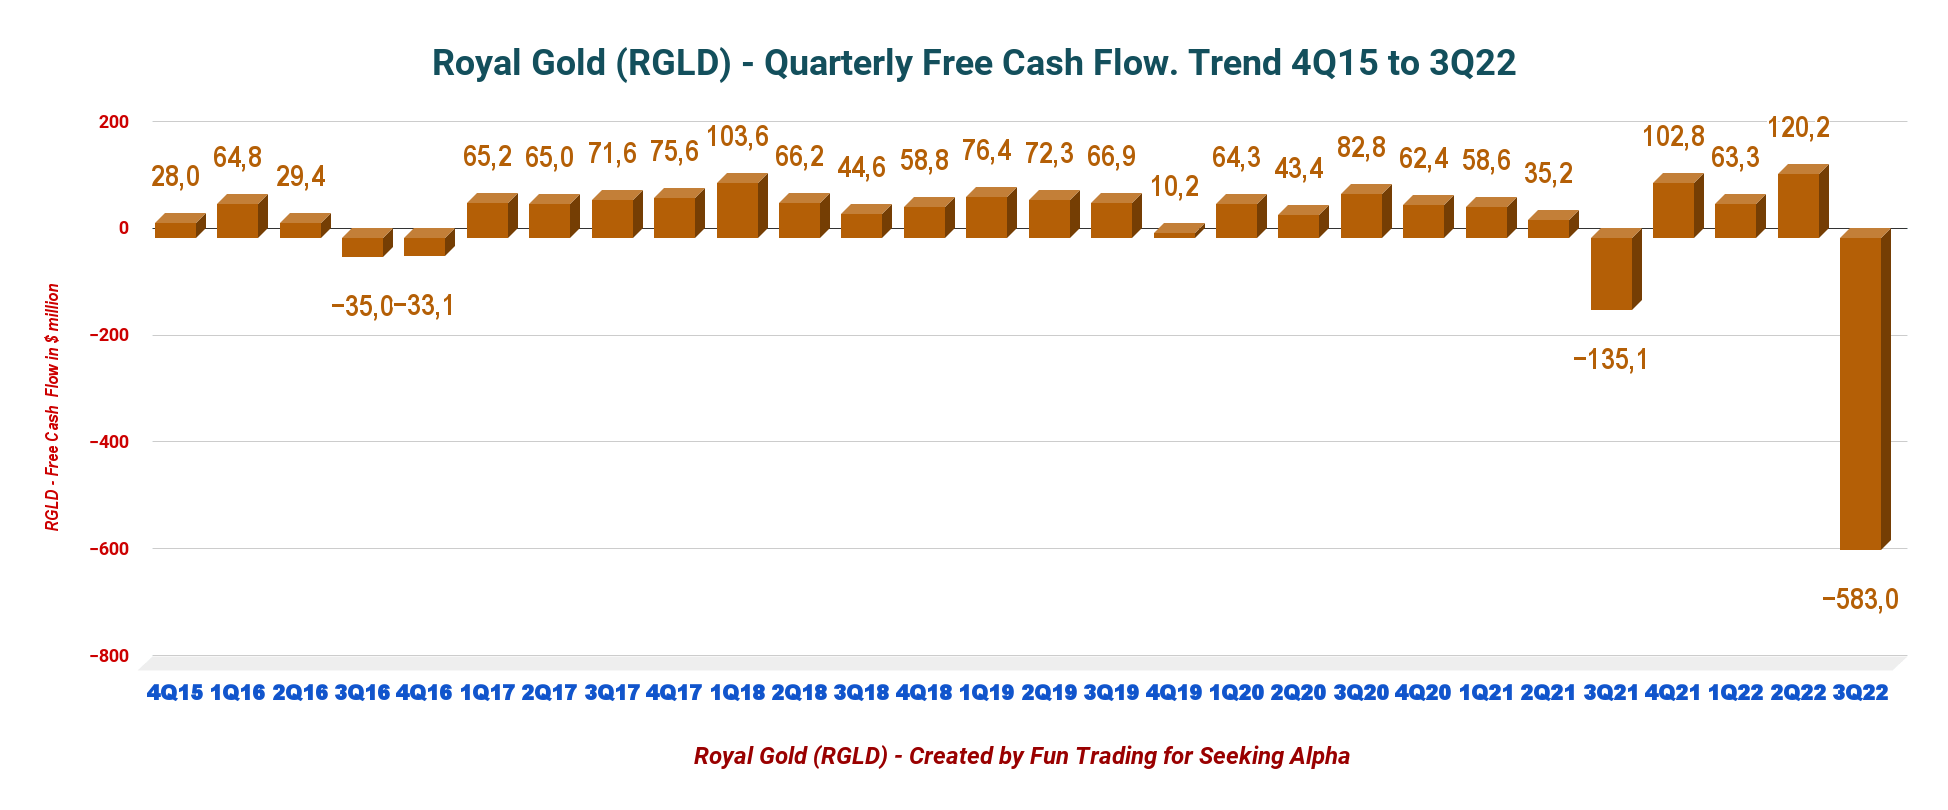
Note: The free cash flow is the cash from operating activities minus CapEx.
The quarterly free cash flow was a loss of $583.00 million in 3Q22, and the trailing 12-month free cash flow was a loss of $296.68 million.
The quarterly dividend has been set to $0.35 per share for 3Q22.
The free cash flow has dropped significantly after Royal Gold acquired a sliding-scale gross royalty (the “Cortez Complex Royalty”) on an area including the Cortez mine operational area and the Fourmile development project in Nevada (the “Cortez Complex”) for $525 million in cash consideration from a wholly owned subsidiary of Rio Tinto European Holdings Limited.
RGLD Acquisition of Sliding-scale gross royalty on Cortez mine Nevada (RGLD Presentation)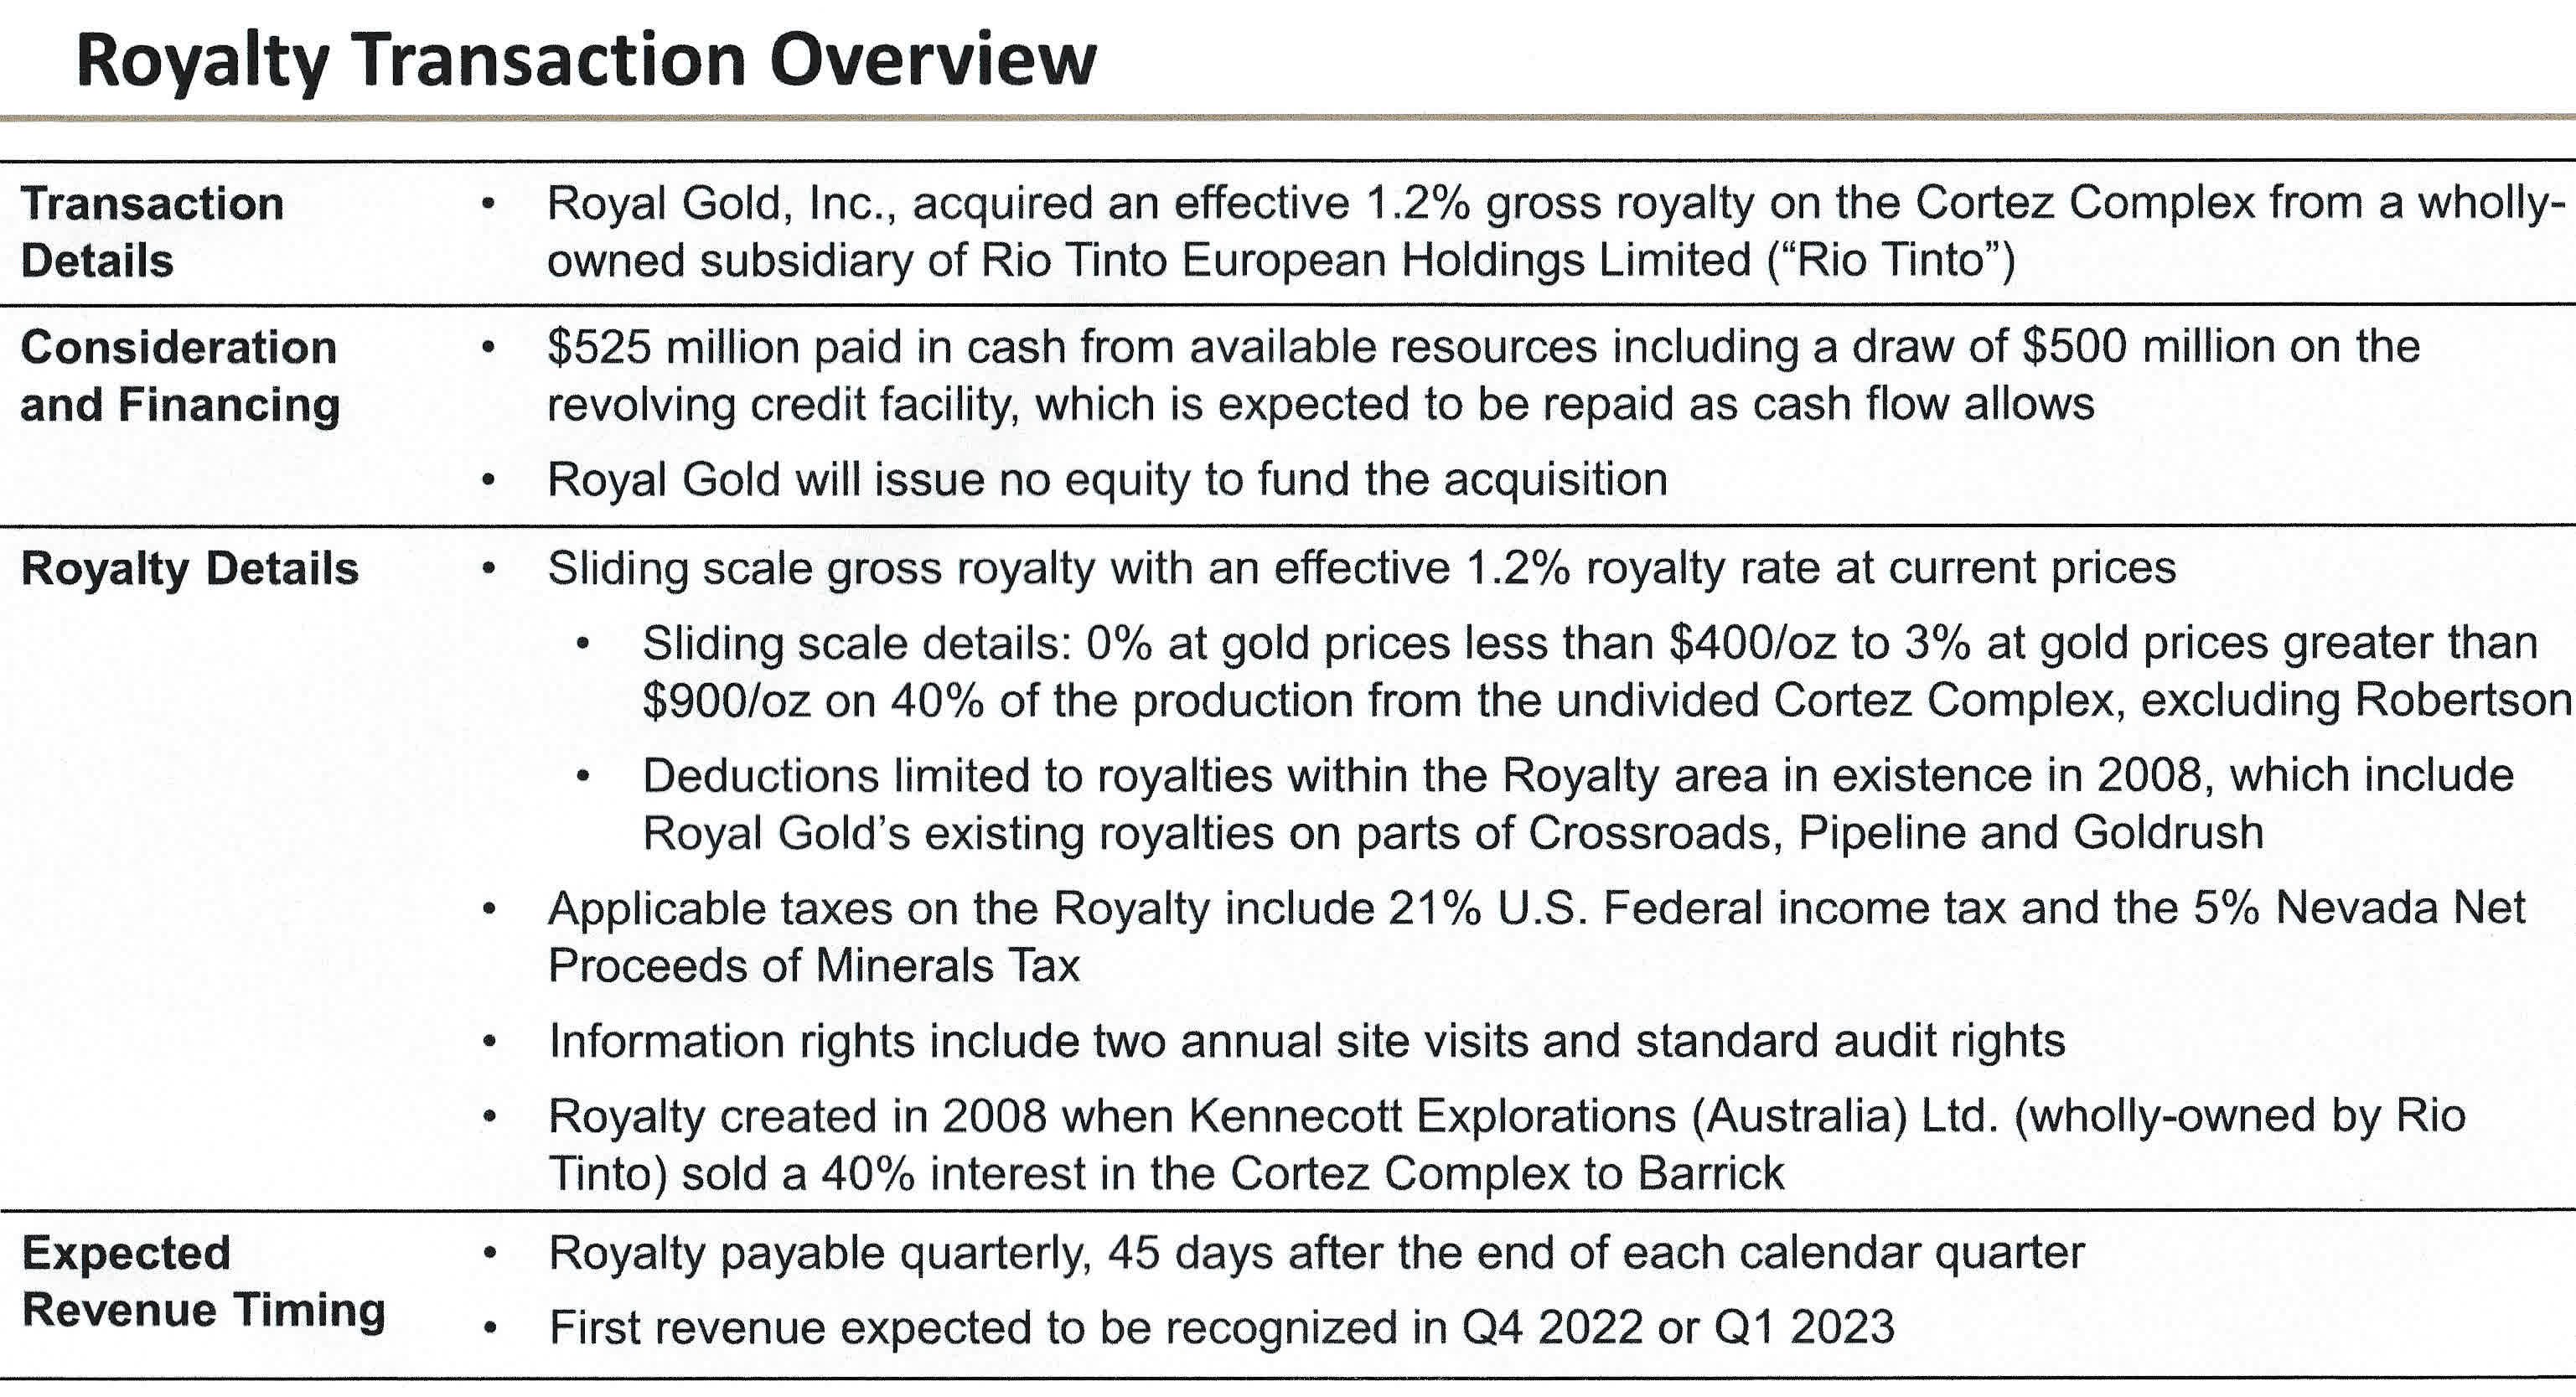
The company is involved with three major projects.
The Khoemacau mine production is expected in 4Q22-1Q23. At Mount Milligan, the LOM has been extended to 2033, and at Pueblo Viejo, plant expansion will be commissioned in 1Q23.
RGLD Update on major projects (RGLD Presentation)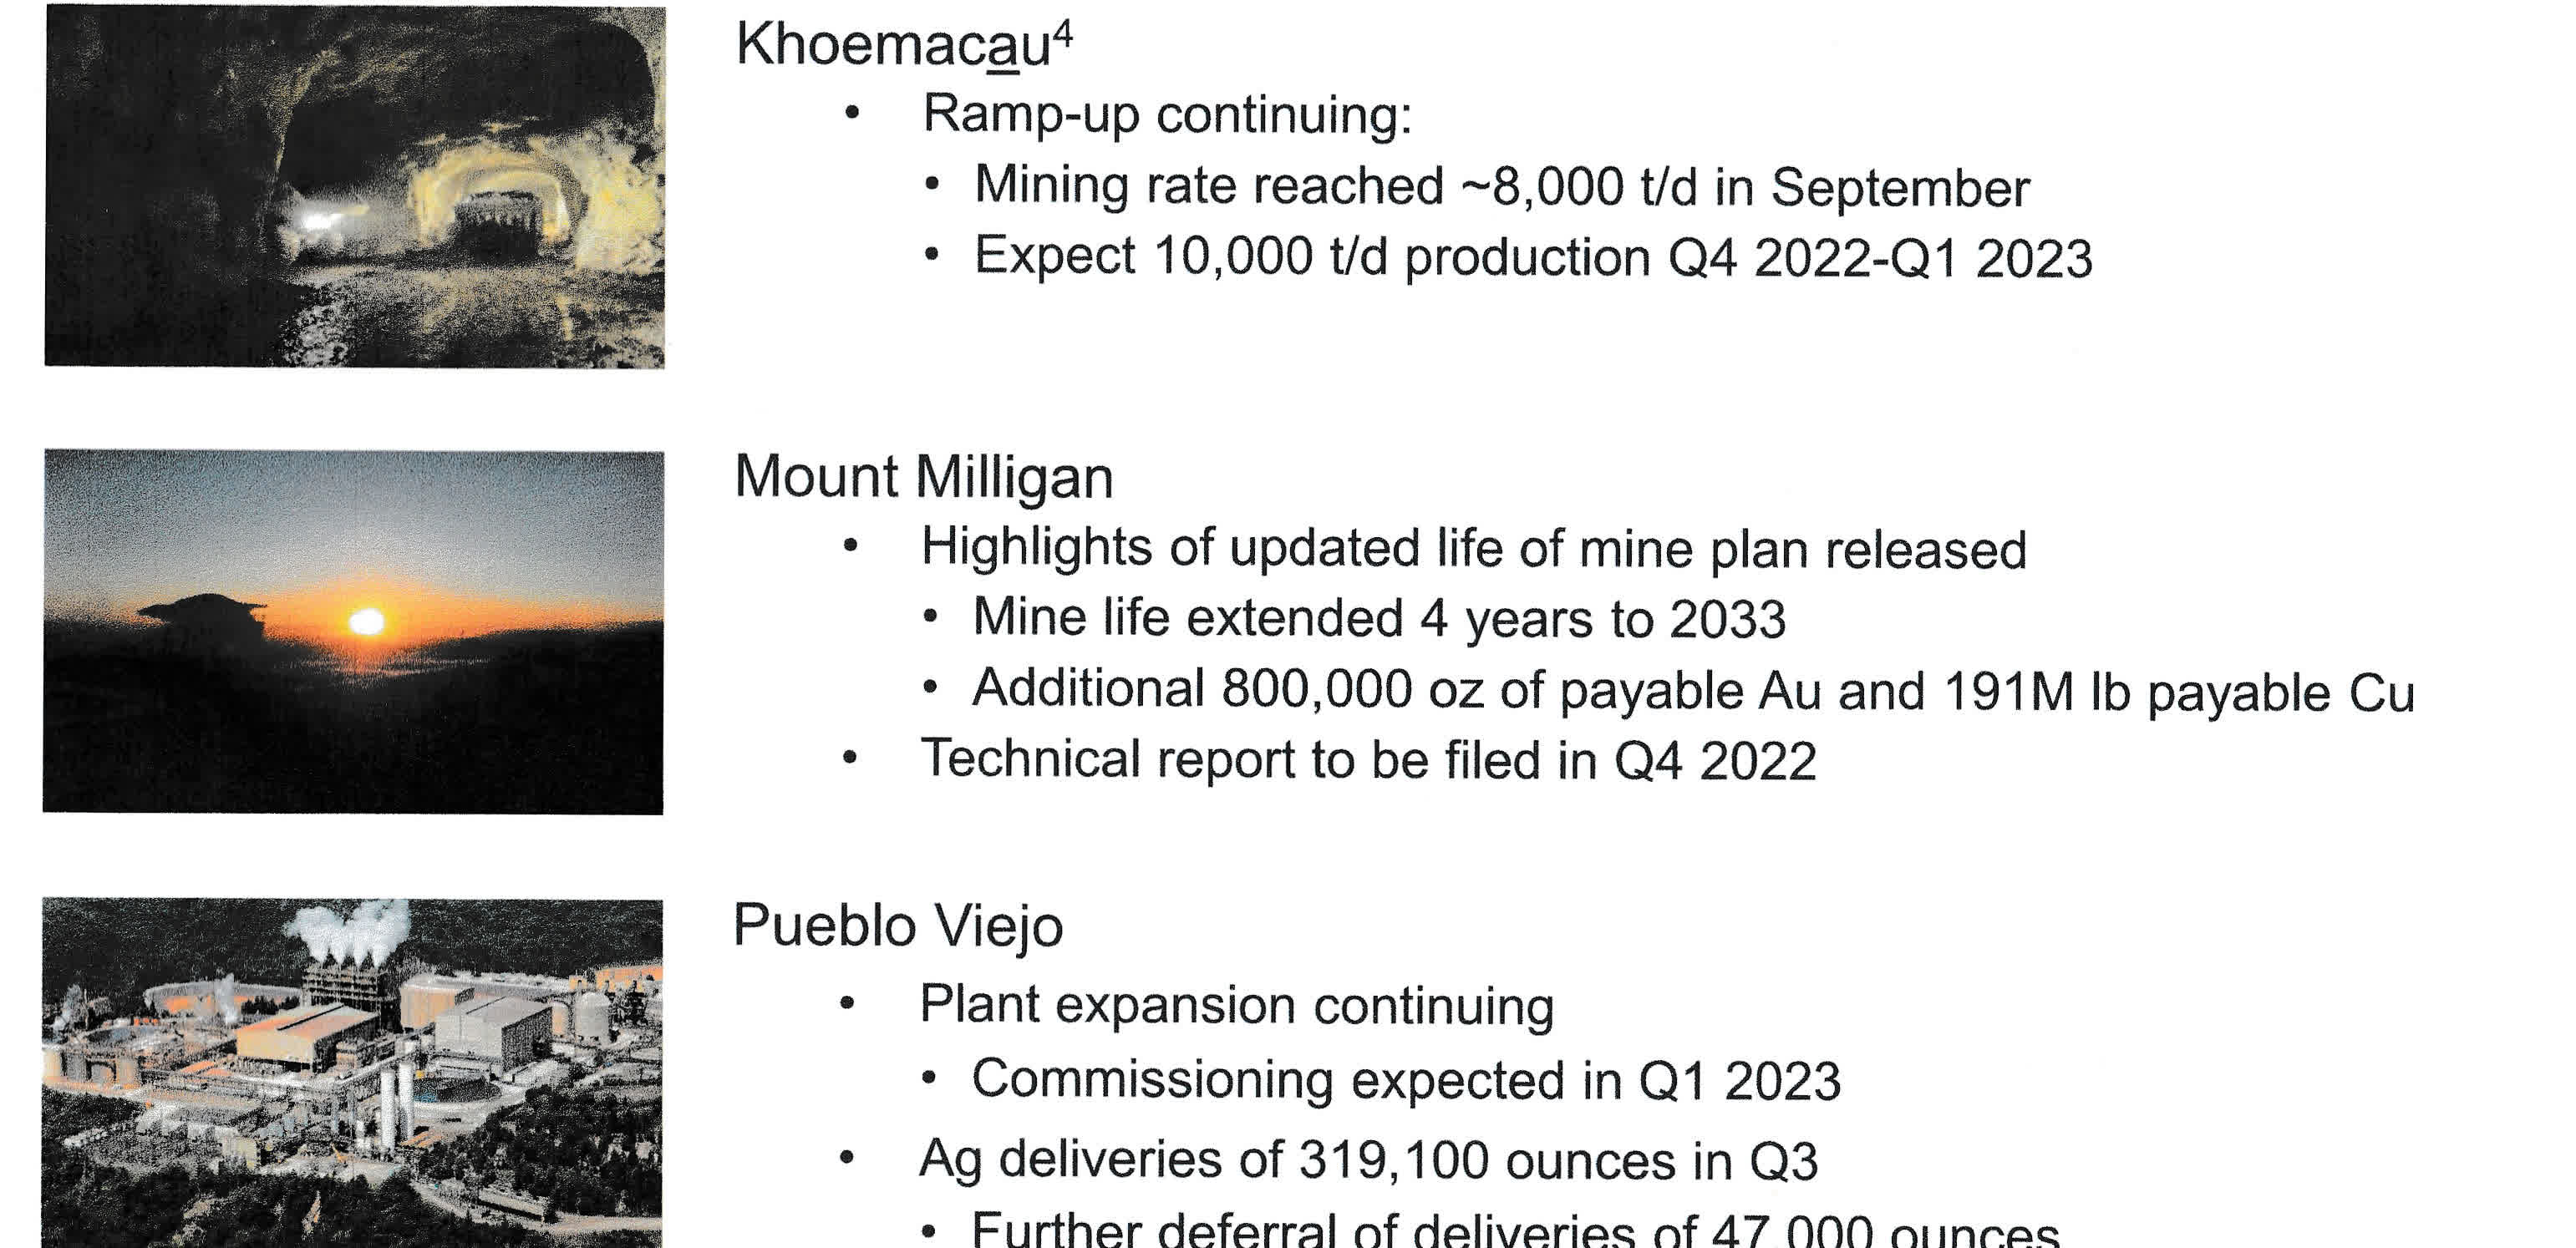
Also, On September 9, 2022, Royal Gold announced that it had completed the previously announced acquisition of all of the issued and outstanding shares of Great Bear Royalties Corporation for approximately $151.7 million in cash consideration.
3 – $667 million available in Liquidity at the end of September 2022.
RGLD Quarterly Cash versus Debt history (Fun Trading) RGLD has a debt of $583 million in 3Q22. Liquidity was $667 million, with total cash of $122.24 million at the end of September. The company said in the press release: In keeping with Royal Gold’s capital allocation strategy to repay outstanding debt as cash flow allows, the Company repaid $50 million of the credit facility balance on September 6, 2022, leaving an outstanding balance of $450 million and $550 million available under the credit facility at quarter end.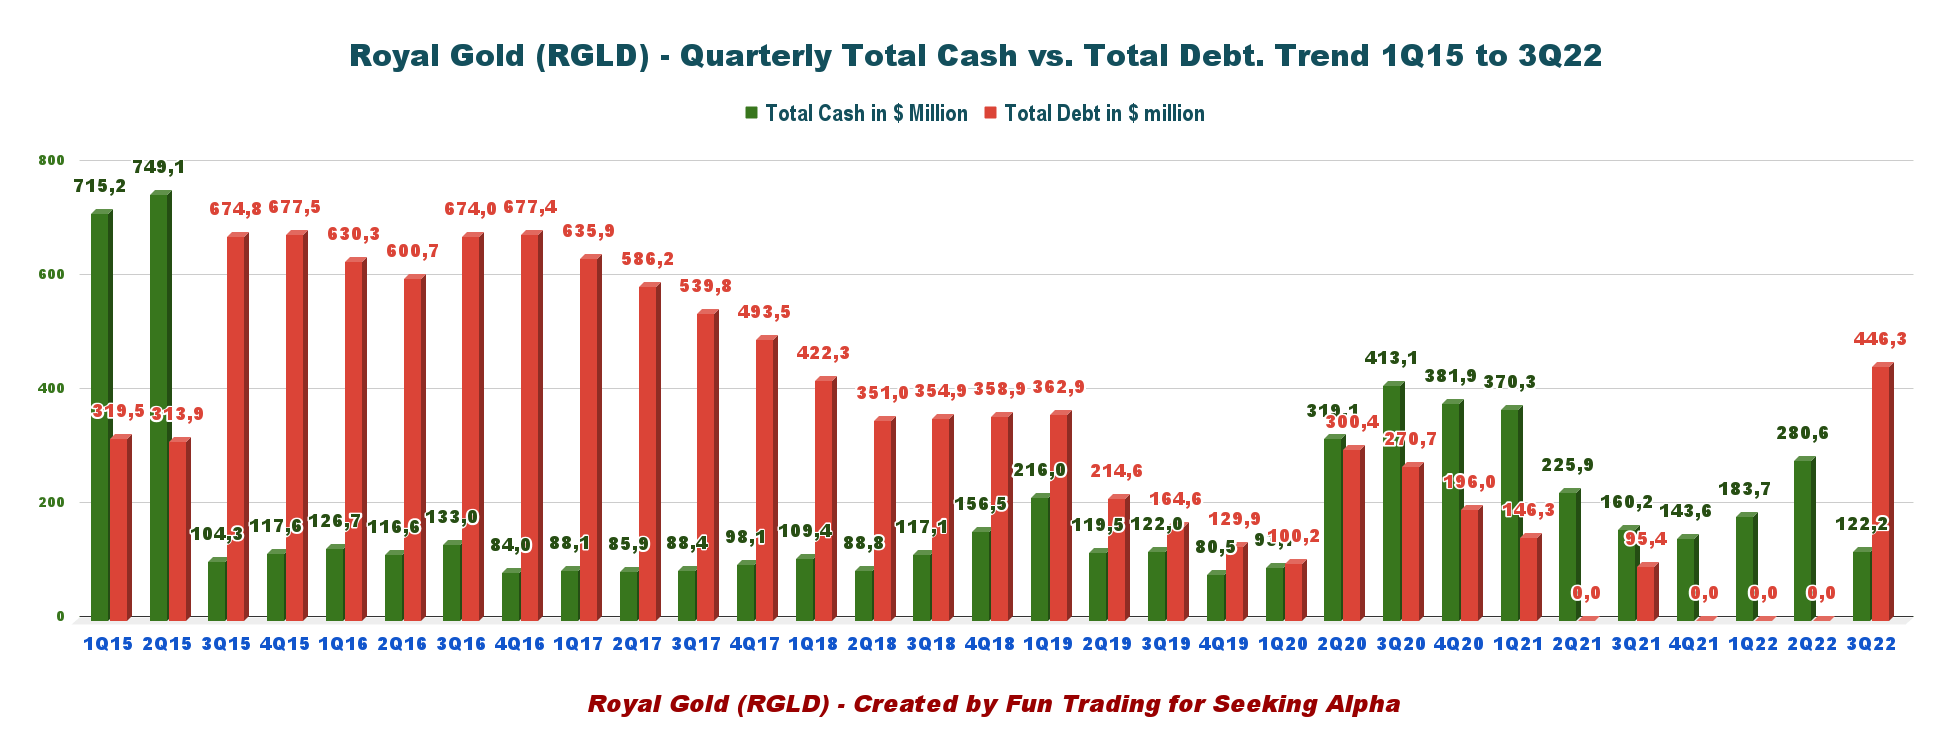
4 – Production In Gold Equivalent Ounce And Details

RGLD Quarterly Gold equivalent Production (Fun Trading)
Royal Gold reported a quarterly production volume of 76.0K GEOs (Gold Equivalent Troy Ounces) compared to 97.4K GEOs in the same quarter last year. The production was weak this quarter.
COO Mark Isto said in the conference call:
This volume was in line with our expectations. And while there was a decrease year-on-year, keep in mind that the GEO volume in 2021 September quarter was a record for the Company, and our 2022 guidance reflected our expectation of reduced production from certain mines.
RGLD Financial results 3Q22 (RGLD Presentation)
The decrease in total production resulted primarily from lower gold sales at Andacollo and Pueblo Viejo and lower gold production at Cortez and Peñasquito despite new revenue from the NX Gold and Khoemacau streams, which did not provide stream deliveries to Royal Gold during the prior year’s quarter.
Gold, silver, and copper commodity prices dropped significantly in the third quarter.
This quarter’s average prices:
- $1,729 per ounce for Gold
- $19.23 per ounce for Silver
- $3.51 per pound for Copper
RGLD Quarterly Gold price history (Fun Trading)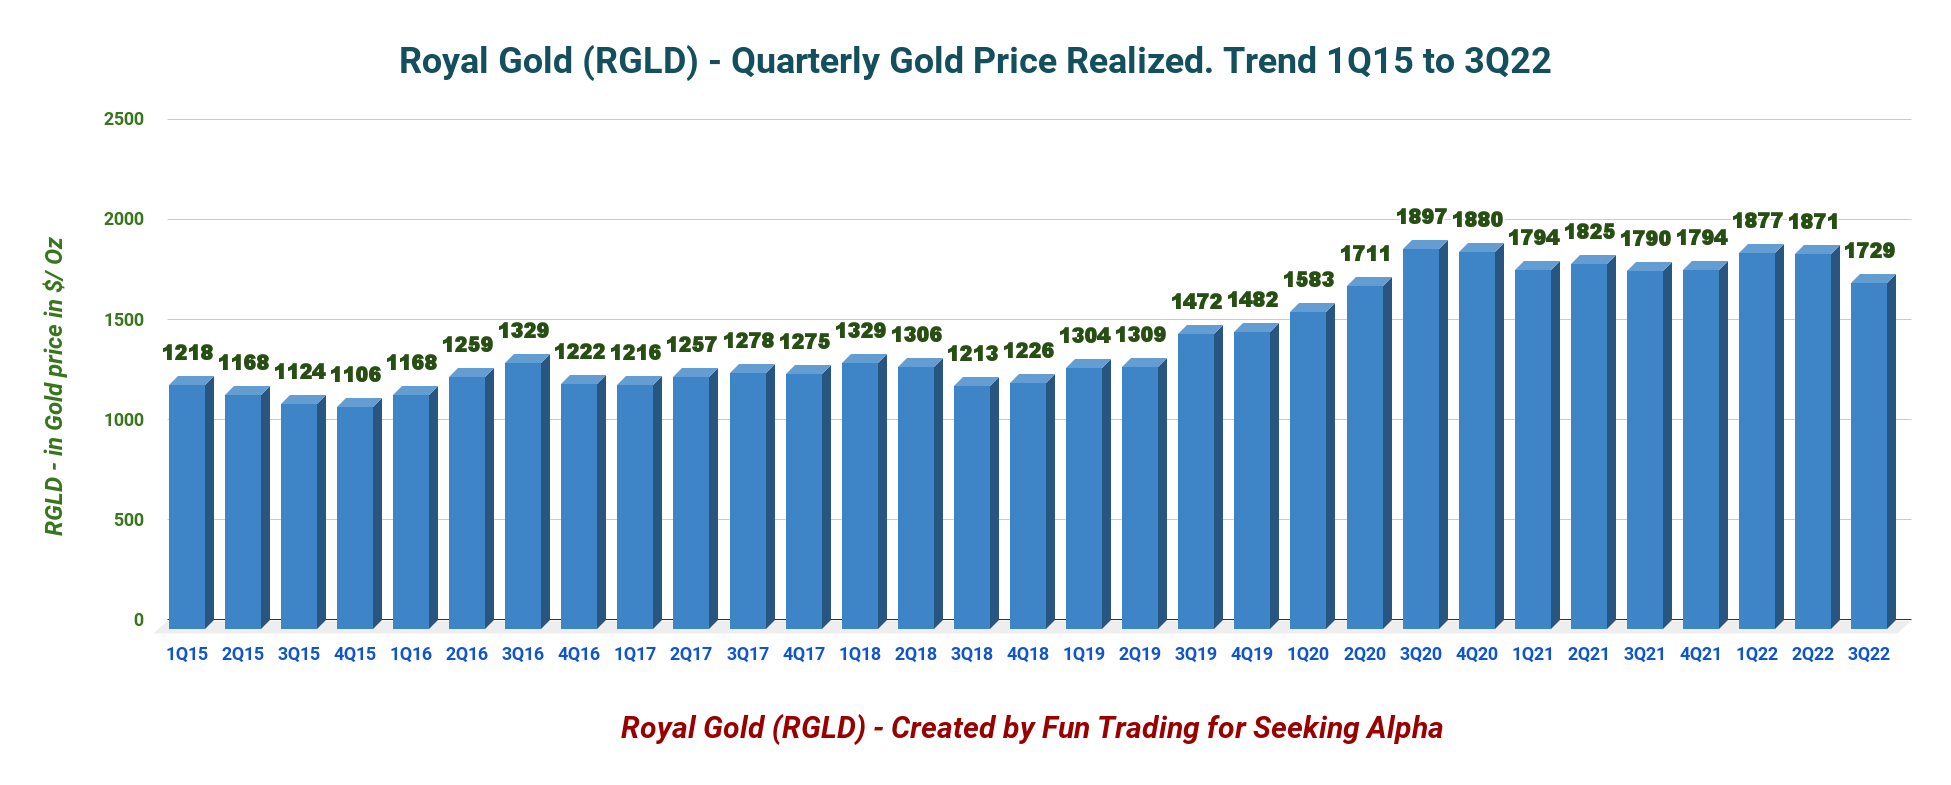
5 – 2022 Outlook
RGLD 2022 Guidance (RGLD Presentation)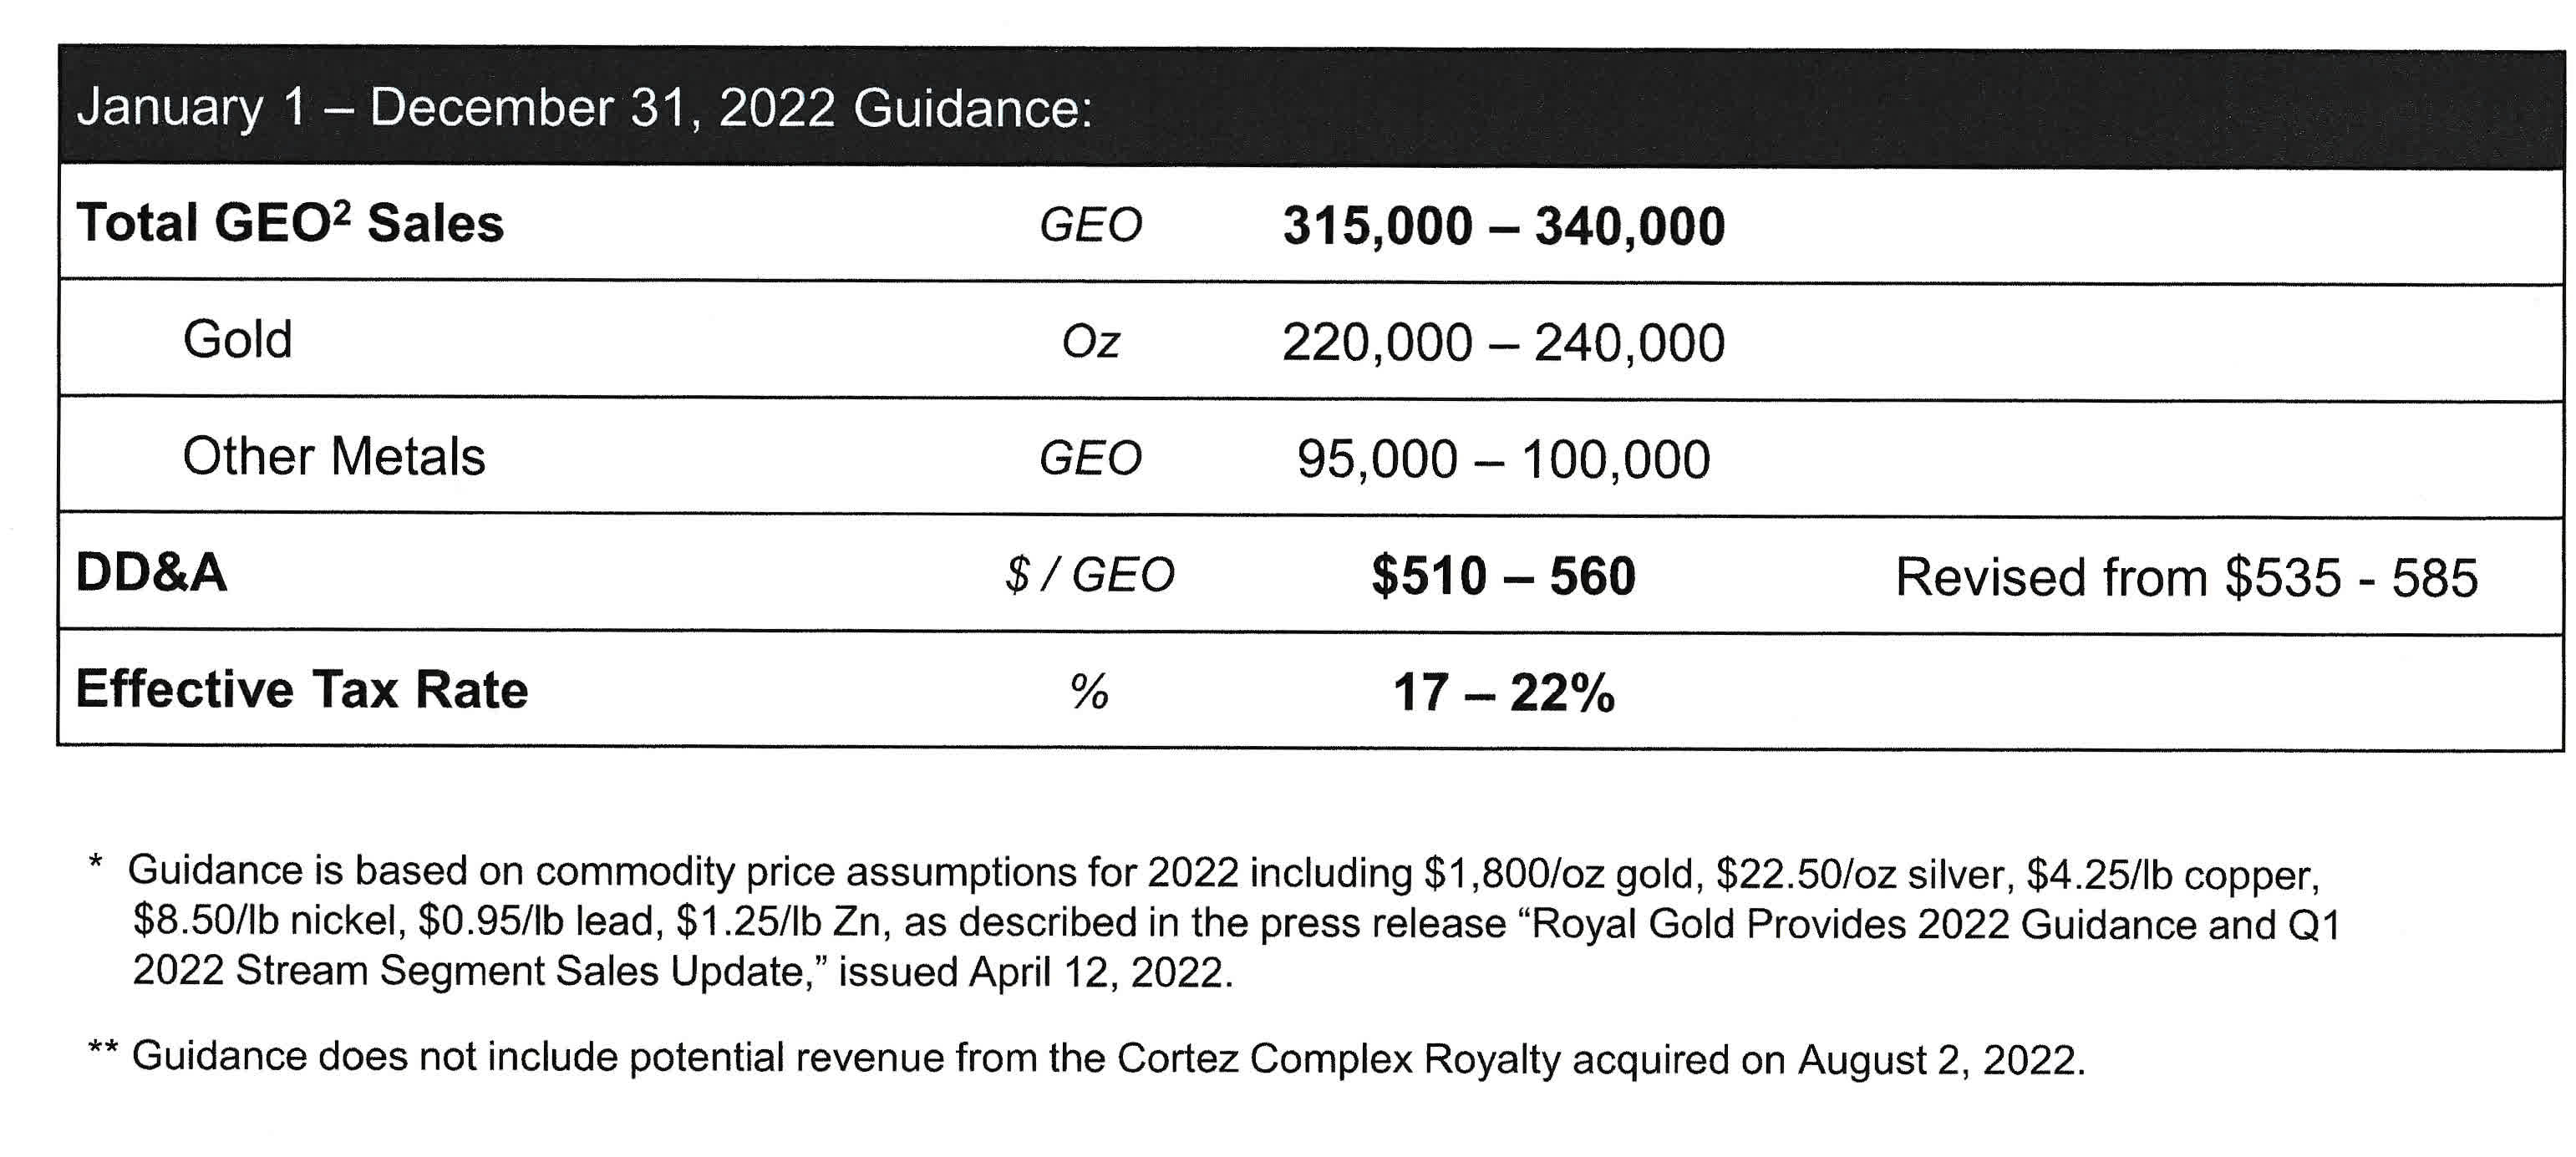
2022 Outlook is 327.5K GEOs (mid-point), suggesting a 4Q22 production of over 85K GEOs for the 4Q22.
Technical Analysis (Short Term) And Commentary
RGLD TA Chart short-term (Fun Trading StockCharts)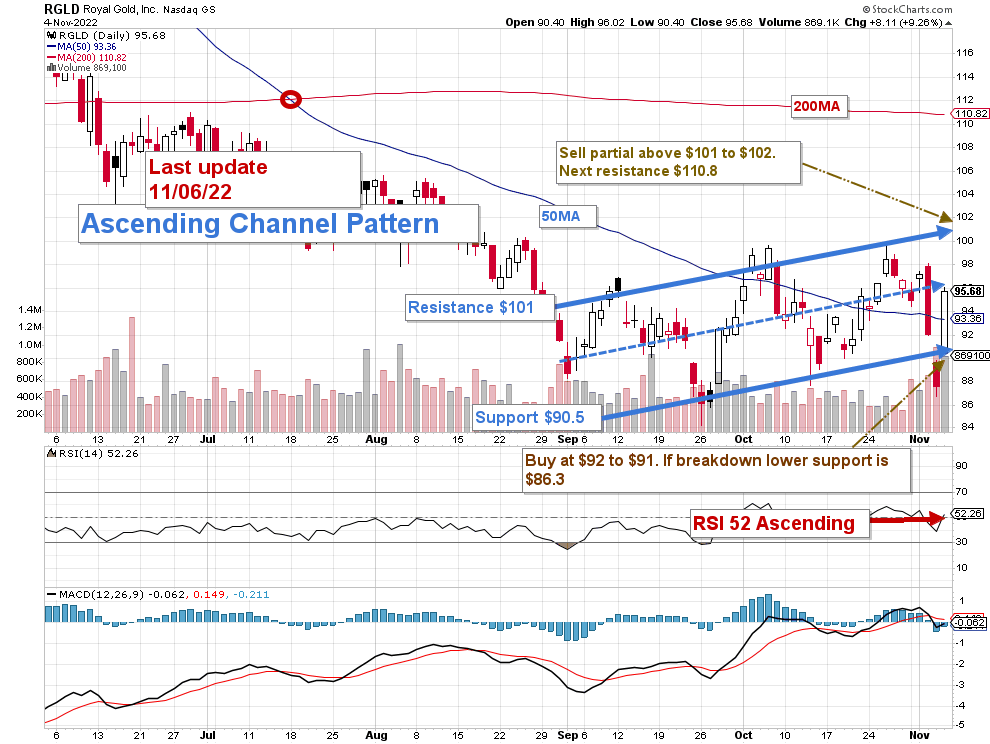
Note: The chart is adjusted for the dividend.
RGLD forms an ascending channel pattern with resistance at $101 and support at $90.5. Ascending channel patterns are short-term bullish, but these patterns often form within longer-term downtrends as continuation patterns.
The short-term trading strategy remains the same as in my preceding article. I suggest trading LIFO for about 30% of your position. I recommend selling between $101 and $102 with potential higher resistance at $110.8 and waiting for a retracement to buy back RGLD between $92 and $90 with possible lower support at $86.3.
Trading LIFO enables you to sell your most recent purchases, assuming a profit (of course) while keeping your long-term position underwater until the stock has appreciated enough to consider selling your core position.
Trading LIFO is about taking small profits using the chart pattern and Fundamentals by repeating the process often.
Watch gold like a hawk.
Note: The LIFO method is prohibited under International Financial Reporting Standards (IFRS), though it is permitted in the United States to generally accepted accounting principles (GAAP). Therefore, only US traders can apply this method. Those who cannot trade LIFO can set up two accounts for the same stock, one for the long term and one for short-term trading.
Warning: The TA chart must be updated frequently to be relevant. It is what I am doing in my stock tracker. The chart above has a possible validity of about a week. Remember, the TA chart is a tool only to help you adopt the right strategy. It is not a way to foresee the future. No one and nothing can.
Author’s note: If you find value in this article and would like to encourage such continued efforts, please click the “Like” button below as a vote of support. Thanks.
Be the first to comment