

piranka/E+ via Getty Images
Investment Thesis
The Royal Caribbean Cruises (NYSE:RCL) has obviously recovered very well from its recent July bottom by 67.19%, further carried by the Bank of Canada’s recent pivot of a 50 basis points hike. Therefore, it is not surprising to see the S&P 500 Index also recording an extremely optimistic 7.8% recovery over the past two weeks, lifting all boats up at the same time. However, we are more realistic here, since the Feds are unlike to reverse its previous hawkish stance so soon. The labor market in September remains too robust, with 90.2% of analysts projecting a 75 basis points hike during the Fed’s November meeting.
The critical question would be whether the Feds are likely to raise their terminal rates to 5.5% against the previous projection of 4.6% and bring on another 75 basis point hike in December. For now, things are no longer looking rosy, as the Feds may aggressively hike interest rates through 2023, throwing the pivot rumors out of the window. Thereby, highlighting RCL’s precarious position due to its lack of profitability and massive debts.
RCL May Sink During The Worst Of Recession
S&P Capital IQ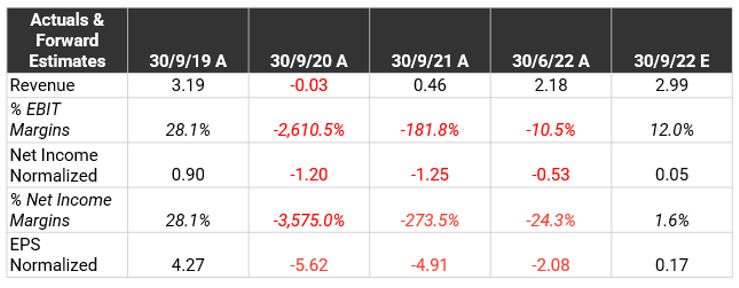
For the upcoming FQ3’22 earnings call, RCL is expected to report a notable jump in revenues by 37.15% QoQ to $2.99B, nearing its pre-pandemic levels of $3.19B. Nonetheless, with the impact of rising inflationary costs, the company continues to suffer from compressed margins. Analysts are projecting gross margins of 36.92% for the next quarter, notably inferior compared to FQ3’19 levels of 49.6%, though massively improved from FQ2’22’s 24.1%. Therefore, further delaying its return to previous profitability, with minimal net incomes of $0.05B, net income margins of 1.6%, and EPS of $0.17 in FQ3’22.
S&P Capital IQ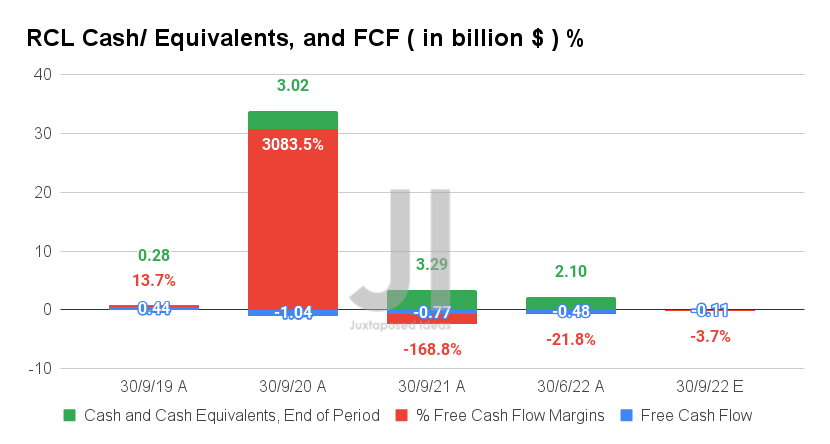
As a result, we do not expect to see RCL report positive Free Cash Flow (FCF) generation in FQ3’22, given its aggressive capital expenditure of $3.26B over the last twelve months (LTM), similar to pre-pandemic levels. Though the 76.21% sequential increase is attributed to its ramp-up in fleets post-reopening cadence, this has directly impacted its ability to deleverage. RCL continues to report elevated long-term debts/ financial obligations of $22.79B in FQ2’22, indicating another 13.55% increase YoY. Otherwise, an eye-watering 255.49% growth compared to FQ2’19 levels of $8.92B.
RCL Long-Term Debt Maturity
S&P Capital IQ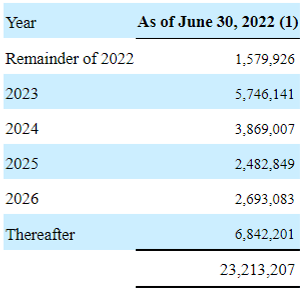
With interest expenses of $1.29B over the LTM and the massive debt maturity of $5.74B by 2023, things look bleak ahead. RCL’s minimal cash and equivalents of $2.1B on the balance sheet from the last quarter are not promising either, since the worst of the recession has yet to hit. Once the difficult winter hits and consumer discretionary spending dips, the company is likely to further rely on debts to tide through the next two quarters. Thereby, further straining its already sad balance sheet.
S&P Capital IQ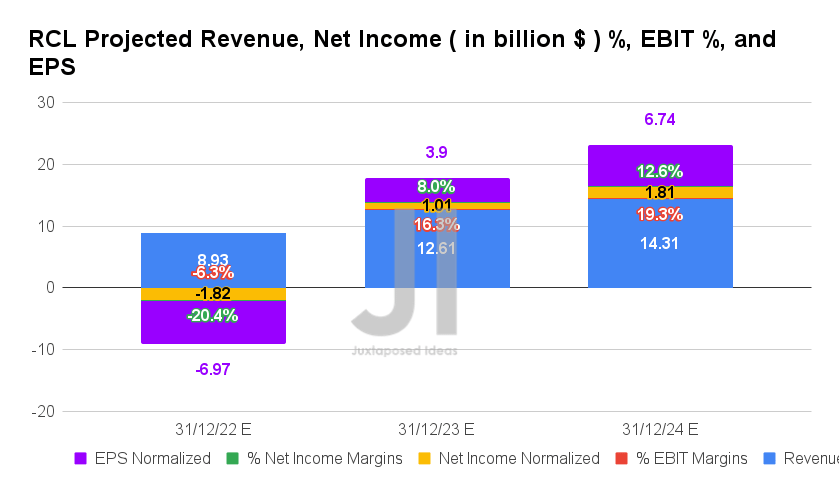
On one hand, it seems that Mr. Market is quietly optimistic that RCL will continue to chart impressive top-line growth ahead at a normalized CAGR of 5.5% between FY2019 and FY2024. However, we are not sure how that will help its stock performance, since profitability remains an issue moving forward. By FY2024, RCL is still expected to report impacted net incomes of $1.81B and net income margins of 12.6%, compared to FY2019 levels of $2B and 18.3%, respectively. Its EPS of $6.74 then also indicates a massive underperformance against FY2019 levels of $9.54.
S&P Capital IQ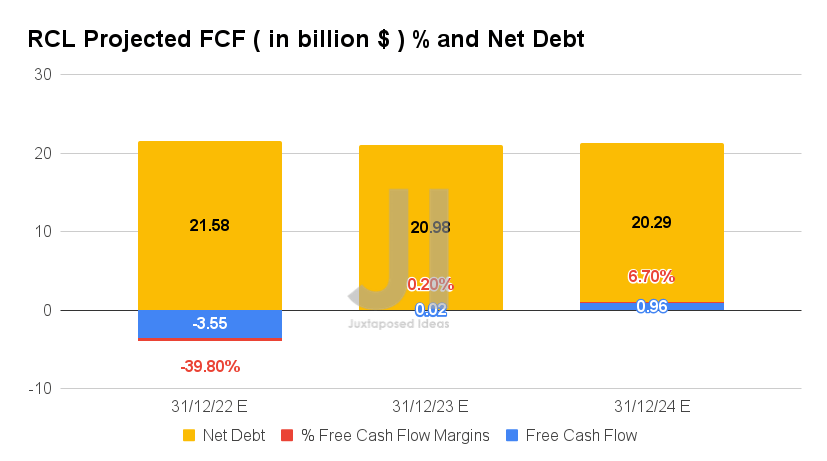
On the other hand, we may see RCL report an improved FCF generation of $0.96B by FY2024, representing an excellent improvement against FY2019 levels of $0.69B. It is no wonder that analysts expect some improvements in its net debt situation then, from $21.58B in FY2022 to $20.29B by FY2024. However, we must also highlight that these numbers are still hyperinflated compared to FY2019 levels of $10.79. Thereby, explaining the stock’s underperformance thus far at 2014 levels.
In the meantime, we encourage you to read our previous article on RCL, which would help you better understand its position and market opportunities.
- Royal Caribbean: The Ship Is Still Sinking
So, Is RCL Stock A Buy, Sell, or Hold?
RCL 5Y EV/Revenue and P/E Valuations
S&P Capital IQ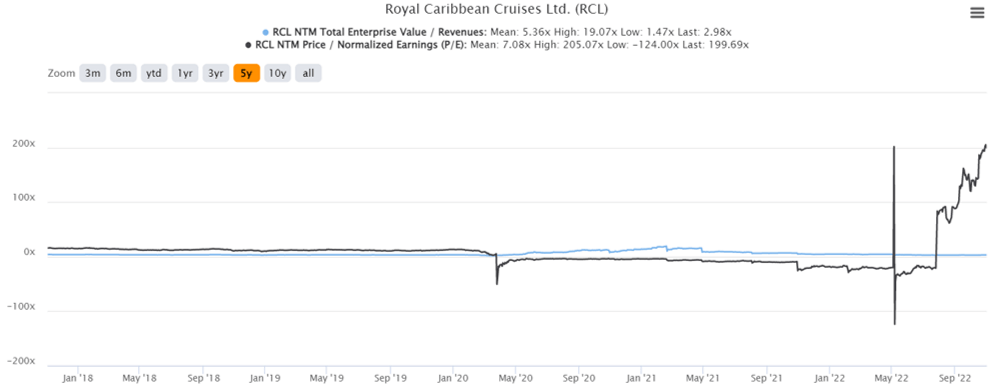
RCL is currently trading at an EV/NTM Revenue of 2.98x and NTM P/E of 199.69x, lower than its 5Y EV/Revenue mean of 5.36x though hyperinflated from its 5Y P/E mean of 7.08x. The stock is also trading at $51.98, down -47.10% from its 52 weeks high of $98.27, though at a premium of 67.19% from its 52 weeks low of $31.09. Nonetheless, consensus estimates remain bullish about RCL’s prospects, given their price target of $66.75 and a 28.41% upside from current prices.
It is apparent that the RCL stock is trading with much optimism and little fundamental support, given its minimal profitability and continuous cash burn. Smaller cruise operators have already hung up their white flags and sought bankruptcy. The US travel industry is also seeing a -3.9% sequential fall in demand by September, with Airbnb (ABNB) guiding slower bookings ahead in its recent FQ3’22 earnings call. We are in for some volatility over the next week as well, as Mr. Market gauges the Fed’s stance through 2023 and the October CPI report is released. Therefore, we continue to rate RCL stock as a Hold for now, due to the massive short-term uncertainty.
Be the first to comment