

cacaroot
Key Insights
- A synchronized global economic downturn is underway. The global economy has been hit by several headwinds, almost all of them leading back to higher inflation. Europe is likely already in recession, the U.S. will enter recession in Q2 2023, while China struggles to make recovery headway.
- Global inflation will only decline at a painfully slow pace. Global inflation has peaked, but price pressures are proving very broad-based and sticky, particularly in the United States. Deliberate central bank action to create labor market slack and weaken demand is needed to lower inflation.
- Global central bank tightening has further to go. Federal Reserve (Fed) policy rates are set to hit 4.75-5% in 2023 and stay at that level for most of the year. Other central banks are also tightening but the Fed is relatively more hawkish, putting upward pressure on the U.S. dollar.
- Equity markets have further to slide. Markets have faced up to the reality of central bank tightening, but now need to adjust to a slowing earnings profile. Investors should focus on segments of the market which benefit from low growth and the strong U.S. dollar.
- Fixed-income investors should seek safety and high quality. Rising recession risk will put downward pressure on U.S. Treasury yields and spur further spread widening, thereby taking the shine off short-duration, low-quality assets.
- Challenged equity and fixed-income markets create a positive backdrop for real assets. The diversification benefits of real assets in this macro environment are particularly valuable, as are their fundamental strengths and defensive characteristics.
Investment Themes
Higher for longer
Developed market central banks are paying the price for their late response to the inflation problem. Having permitted price pressures to intensify and permeate through the global economy, central banks’ credibility is being tested. They must engineer an economic slowdown in order to contain the inflation problem. Policy rates will go higher and must stay high if inflation is to sustainably return to target. This will be the first economic downturn in many decades where central banks continue tightening into a recession. The implication of higher rates for longer, the opposite environment to the one that had benefitted risk assets over the past decade, will tighten financial conditions and continue to be a large overhang for risk assets.
Market turmoil: Time to play defense
As central banks come to combat with stubborn inflation, sharp increases in policy rates and the strengthening U.S. dollar will likely lead to moments of market turmoil and financial stress. Indeed, previous rapid tightening in U.S. monetary conditions contributed to the 1980s U.S. savings and loan crisis, the 1995 peso crisis, the 1997-98 Asian financial crisis and the 2013-15 emerging market (EM) credit crunch. As was the case before all those episodes, identifying which will be the next big crisis is near impossible. As such, it will be crucial for investors to reduce exposure to vulnerable segments of the market. Investors should focus on high-quality assets, seeking out areas that can still deliver stable earnings even as growth weakens and monetary conditions become tighter – all while maintaining ample liquidity.
Investing: Get Real
Traditional equity and fixed-income classes will be challenged in this low-growth, high inflationary environment. By contrast, real assets are typically less sensitive to inflation. They offer predictable cash flows and therefore can thrive in this investment landscape, providing important diversification benefits and inflation mitigation. Investors may be concerned that, like so many post-Global Financial Crisis (GFC) and post-COVID winners, real asset gains are starting to run dry. Yet, structural shortages should ultimately support commodity returns, while infrastructure provides opportunities to access attractive long-term investment themes such as decarbonization which will likely outlast Fed tightening and recession concerns.
Consider the potential risks
Liquidity crisis: As central bank rates rise and the U.S. dollar continues to strengthen, liquidity shortages may abound. A market dysfunction, if large enough, could drastically change the outlook with central banks needing to decide how much liquidity pain they are willing to tolerate in their bid to fight inflation. Financial stability or low inflation – one goal would have to be abandoned.
Stubborn inflation requiring 5%-plus policy rates: If higher wage growth becomes entrenched, the Fed may need to extend their hiking cycle and raise rates even beyond the 5% we anticipate. This attempt to deliberately shock the economy into an extended recession would raise unemployment several percentage points, risking a sustained and structural hit to the labor market, not to mention a very prolonged and difficult period of low market returns and high volatility.
A synchronized global economic downturn
The global economy has been buffeted by a multitude of headwinds and is now in a synchronized downturn. While this is a considerably less urgent state of distress than during the 2020 COVID outbreak, the post-pandemic inflationary world has brought significant challenges.
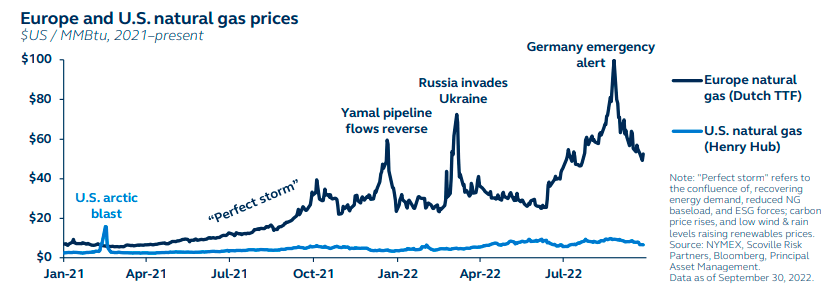
The U.S. economy is decelerating under tighter financial conditions as the Federal Reserve raises policy rates aggressively to contain inflation – but it is not yet in recession. By contrast, the euro area economy is likely already contracting as soaring natural gas prices create the most severe economic conditions in several decades. Since early 2021, European natural gas prices have risen almost 760%. By contrast, they have risen “just” 240% in the U.S.
China, typically the largest contributor to global growth, continues to struggle against COVID lockdowns and real estate sector weakness. Emerging market economies are being confronted by multi-decade highs in the U.S. dollar.
A global recession may be skirted, but not without a few key economic regions falling victim to the severe headwinds confronting the global economy.
Global growth is struggling under the pressure of tighter financial conditions and elevated energy costs, and no economic region is immune to these challenges.
Global Manufacturing PMIs Europe And US Natural Gas Prices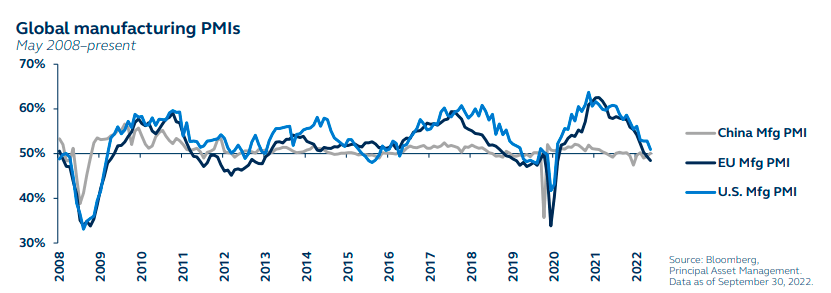
“High inflation is sneaky hard to beat”
Inflation continues to be at the heart of almost all headwinds confronting the global economy. In Europe, the threat of further energy price rises implies that the inflation peak may still be several months away. Emerging market price pressures have eased, but U.S. dollar strength renders their inflation challenges particularly difficult to conquer.
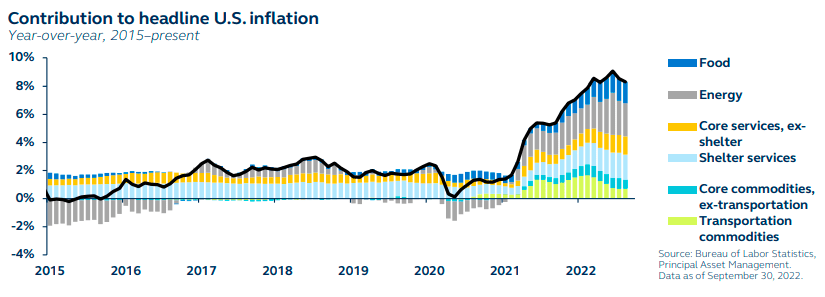
U.S. inflation has peaked but continues to sit near multi-decade highs, with price pressures proving to be very broad-based and, in many segments, extremely persistent. In particular, shelter will be an ongoing headache for the Fed for several more months. Worth a third of the headline CPI index and about 40% of core CPI, shelter is a sticky and lagging component.
While supply bottlenecks and higher energy prices initially drove the surge in inflation, those pressures have now shifted to the demand and services side of the economy. This needs deliberate attention from the Fed if inflation is to move back toward more reasonable levels and avoid high wage expectations becoming embedded.
With other economies sharing a similar inflation picture, further global monetary tightening is highly likely.
Global inflation has likely peaked, but price pressures have broadened into stickier segments of the economy and will only fade with determined central bank action.
Principal Asset Allocation GDP-Weighted Inflation Contribution To Headline US Inflation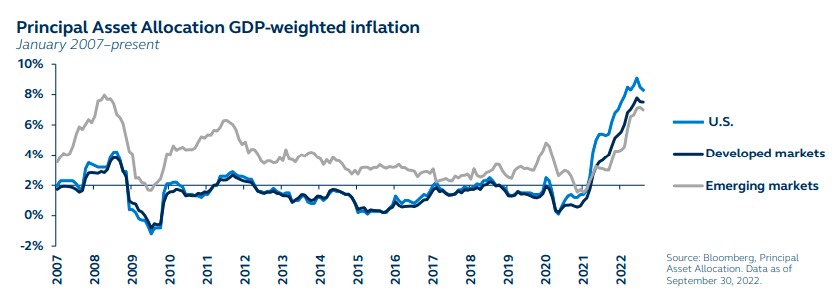
U.S. labor market’s strength will be its downfall
Alongside strong inflation numbers, U.S. economic data has proven to be fairly resilient. Nowhere is this more evident than in the labor market. While there has been some cooling, monthly jobs growth continues to sit at levels historically consistent with extremely strong economic growth and falling unemployment.
Employers report considerable difficulty in filling available positions. Job openings have only fallen modestly, and quit rates – a measure of employee confidence – remains very elevated. Unfortunately, this strength is also synonymous with wage pressures. The employment cost index – the Fed’s preferred measures of wages – is at a series high.
In order to force a meaningful loosening in labor market conditions, the Fed will need to engineer a slowdown, delivering further sizeable rate hikes. Doing so will result in a decline in job vacancies and a cooling in wage pressures.
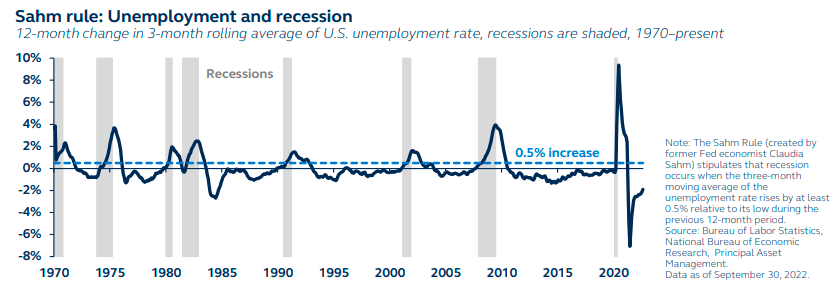
The reality, however, is that a substantial decline in job vacancies has never occurred without a sharp increase in unemployment. And in U.S. economic history, every time there has been a 0.5% increase in the unemployment rate in a 12-month period, it has been accompanied by recession.
The U.S. labor market remains very strong, but this is adding to wage pressures. The Fed needs to engineer an economic slowdown to loosen conditions and relieve pressures.
Labor Shortages And Wage Costs Sahm Rule: Unemployment And Recession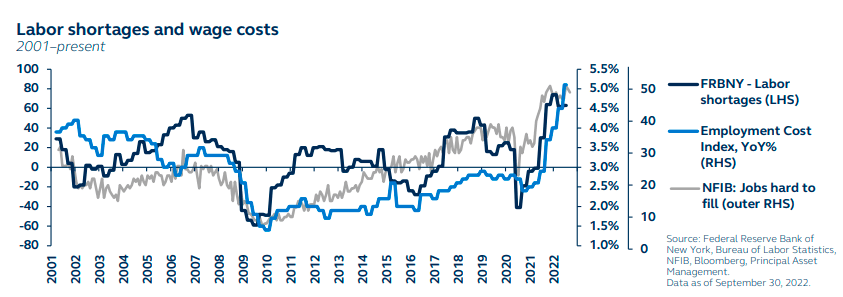
Policy rates: Higher for longer
The Fed’s current tightening cycle is the most aggressive since the early 1980s, and with rate increases yielding few results thus far, investors need to brace for additional intensified hiking. Market pricing for Fed policy has soared, expecting rates to peak at 4.5% – almost 120 basis points (bps) higher than what they were anticipating at the end of July. Our own forecasts are more hawkish still, with rates peaking at 4.75% in Q1 2023.
The Fed has acknowledged – and accepted – that further hikes will bring economic pain. As such, it will not pivot in response to rising recession risk, and policy rates are unlikely to be cut until end-2023 at the earliest.
This is also one of the most aggressive global tightening episodes in history, with 85% of global central banks in tightening mode. Many developed market central banks have resorted to 75bps hikes despite oncoming slowdowns – a testament to the enormity of their inflation challenges.
By contrast, the Bank of Japan continues to keep policy rates on hold, while the People’s Bank of China is stepping up its policy stimulus actions. However, U.S. dollar strength is making it increasingly difficult for these central banks to continue defending their more dovish policies.
The Fed tightening cycle is the most aggressive since the early 1980s. Policy rates are set to approach 4.75% next year and are unlikely to be cut until end-2023 at the earliest.
Implied Fed Funds Target Rate And Market Expectations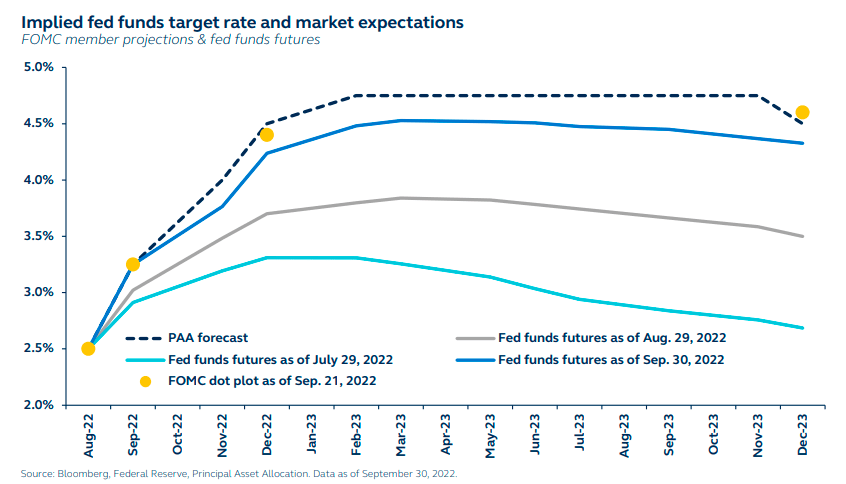
U.S. dollar: My currency, your problem
The uber-hawkish Fed is supercharging the U.S. dollar, pushing it to a 20-year high. This is transmitting significant negative pressures to the rest of the world, and prompting global central action which is designed to resist currency depreciation and imported inflation – in turn increasing the risk of overtightening on a global scale.
For central banks such as the Bank of Japan and People’s Bank of China, dollar strength is potentially compromising their intentions to keep monetary policy loose. For EM central banks with high dollar-denominated debt, the greenback rally presents a difficult challenge, while for commodity importers, dollar strength translates into even higher prices. For the UK, bad domestic policy is colliding with the strong dollar to create an environment which will severely test the British economy.
The dollar’s valuation now looks stretched – but the drivers of its strength are not yet exhausted. Once U.S. growth eventually rolls over and Fed policy rates finally peak, the U.S. dollar will likely weaken, alleviating pressures on global currencies. Yet, this process may take several more months, severely straining the global economy.
The U.S. dollar’s strength is beginning to cause real stress across the global economy, but U.S. dollar weakness may only come once the Fed stops hiking.
Major Currencies Vs. US Dollar Index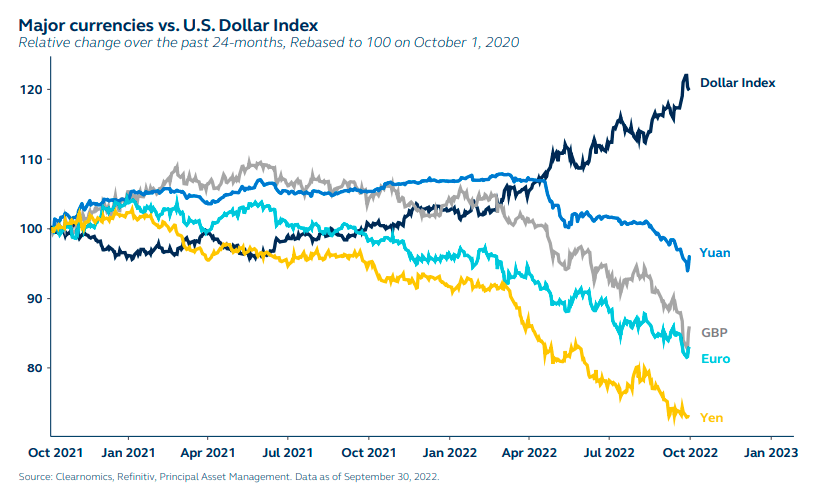
Financial conditions: Still further to tighten
With global central banks hiking rates almost en masse this year, global financial conditions have already tightened considerably, creating a hostile backdrop for risk assets. In the U.S., September marked the third-steepest monthly tightening in financial conditions since the early 2000s – outdone only by conditions during COVID and the GFC.
The environment will only become even more inhospitable as we move into Q4 and additional aggressive rate hikes are introduced in a bid to control inflation.
Furthermore, as the full cumulative effects of rate hikes only seep into the real economy with a lag, there is already a lot of tightening in the pipeline that will weaken growth in 2023. We expect the U.S. economy to enter recession in Q2 2023 as consumer and corporate sentiment deteriorate further and business investment turns negative. In Europe, the European Central Bank’s (ECB) hawkish resolve, coupled with a cost of living crisis, creates the perfect breeding ground for an imminent recession. In China, stimulus measures should help ensure a stabilization of growth, but at a depressed level that will test its key trading partners. Emerging markets will struggle through the U.S. dollar strength, with inflation and rising interest rates challenging their economies.
Tightening financial conditions have created a hostile backdrop for risk assets, which only become more inhospitable as recessionary conditions become widespread.
Developing Market And Emerging Market Financial Conditions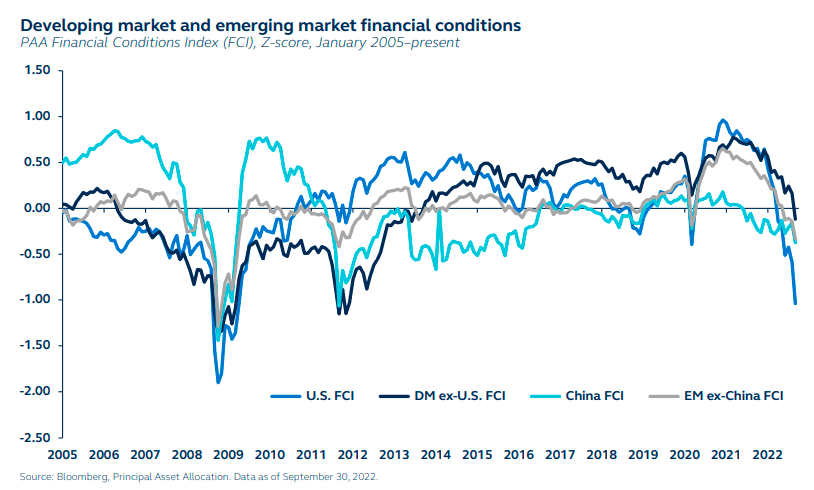
Equities
Global valuations: Not appetizing enough
High inflation, and now a hawkish stance from central banks, challenged the initially extended valuations of global equities going into 2022. As a result, equity markets have lost ground for a third consecutive quarter, with indices down anywhere from 15% to 25% across the world. However, Q3 2022 itself was marked by considerable volatility, with a sharp rally through the early part of the quarter as markets questioned the Fed’s tightening resolve.
U.S. equities only reverted to their downward trend toward the end of August as Fed comments reasserted their hawkish slant, but with such ferocity that valuations cheapened significantly. The result is that the U.S. has now been cheaper 69% of the time. Valuations in both Europe and much of the EM complex are flashing green – they have rarely been more attractive than they are today.
Just as over the past decade expensive valuations did not present any obstacles on the way up, cheap valuations do not necessarily present any obstacles on the way down. Looking beyond the next few years, however, and once markets have troughed, valuations are instructive and will provide guidance as to where the best opportunities lie.
Tighter financial conditions have impacted global equity markets and valuations have cheapened, although movement in Q3 was minimal.
Equity Returns And Valuations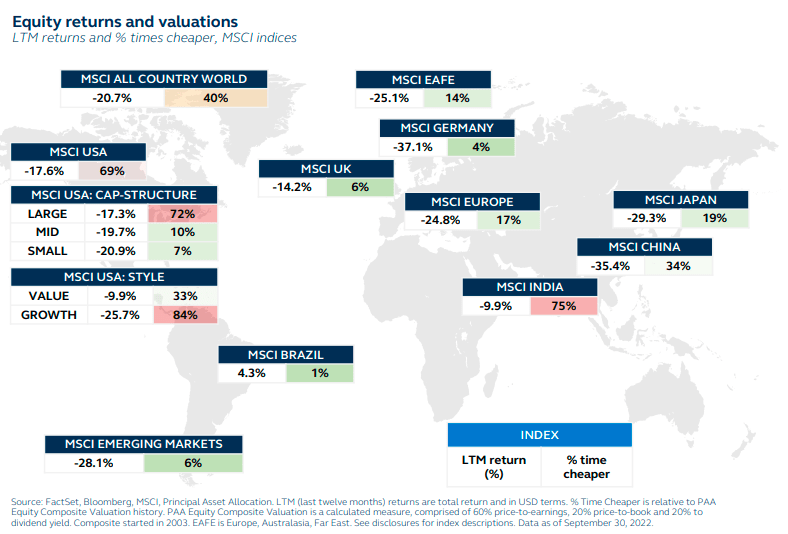
Equity market slide: Stage one
2022 is proving to be a typical echo of other bear markets in history, characterized by hopeful, yet humbling, temporary market rallies within a longer downtrend.
Bear markets are characterized by a persistent downward trend, exhibiting lower highs and lower lows within that downtrend. Bear market rallies are temporary countertrends, usually off lower lows, during such secular declines. This year has seen five such bear market rallies, with the most recent, lasting from mid -June to mid -August, prompting the S&P 500 index to gain almost 14% in total return terms. Ultimately though, as is typical during bear market rallies, weakening fundamentals have prevailed, causing equity markets to slide once more. Indeed, the S&P 500 ended up posting its worst September in two decades.
The current prolonged drawdown, initially spurred by lower valuations and extended by the surge in bond yields, is also a market that is yet to grapple with the potentially severe risks to the wider economy and corporate earnings. While stocks have sold off in 2022, aggregate earnings estimates so far have barely budged. The economic backdrop, however, points to earnings weakness ahead.
The summer rally was reminiscent of previous bear markets whereby equities experience sharp, but temporary, gains. Fundamentals ultimately reasserted themselves, guiding markets lower.
Bear Market Rallies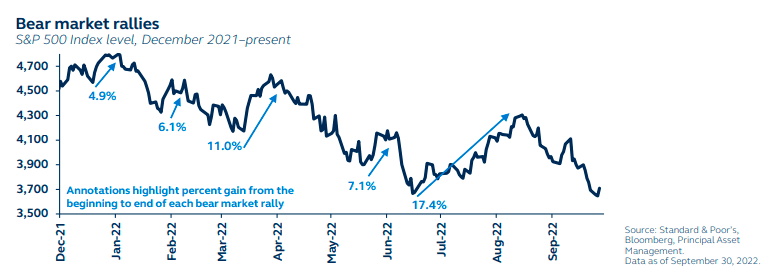
Market Performance And Earnings Expectations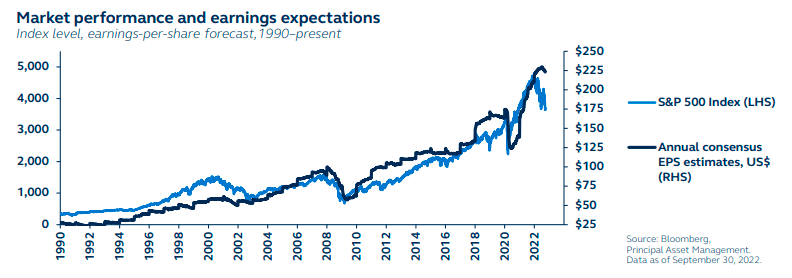
Equity market slide: Stage two
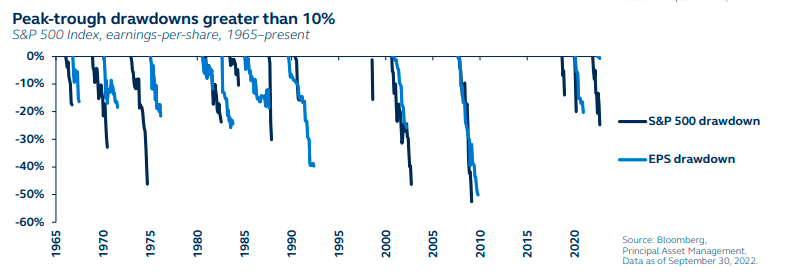
Risks embedded in earnings growth estimates remain underappreciated in the second half of 2022 and into 2023. Market complacency has been largely driven by a very significant upgrade of energy earnings, which only occupies a 4.2% sector weighting within the S&P 500 but has skewed the view of aggregate earnings estimates.
The reality is that gross margins are under threat, not just from tightening financial conditions and hawkish banks but also weakened consumer confidence. Consumers, who are already feeling the pinch from inflation, are becoming more price-sensitive. As a result, retailers are likely to discount prices to win market share, while also struggling with higher wage and material costs.
So far, earnings estimates don’t incorporate these abundant risks, but such top line contractions would likely permeate to margin pressures, eventually negatively impacting corporate earnings.
Importantly though, the equity drawdown may not extend the full length of the earnings slowdown. Previous cycles have shown that equity markets typically trough before earnings growth hits its lows, with peak Fed funds typically presenting the first flagpost.
Equity markets may be more realistic about the Fed outlook but are yet to fully appreciate downward earnings risk, indicating further losses ahead.
Consumer Sentiment And Sales Margins Peak-Trough Drawdown Greater Than 10%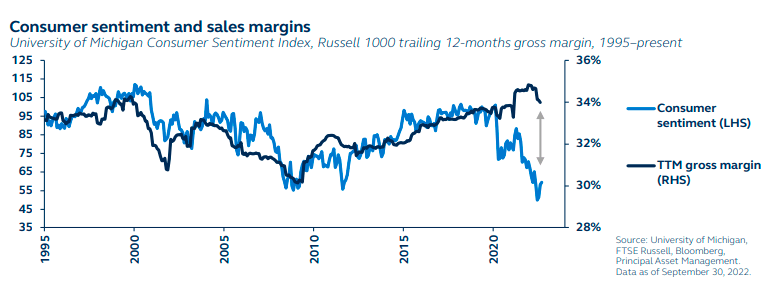
U.S. mid-caps benefit from domestic exposure
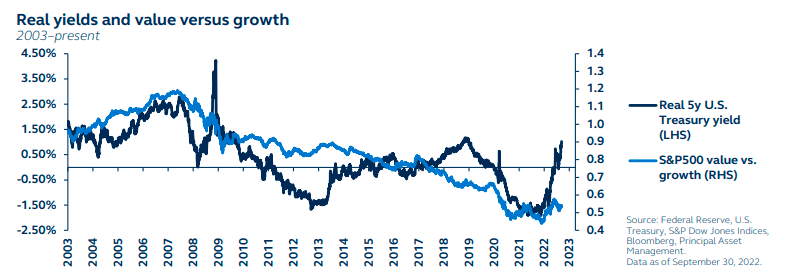
Large-caps will likely continue underperforming mid-cap equities. From a valuation perspective, while large-caps are still expensive, mid-cap valuations have fallen meaningfully below their historical averages. Large-caps will also be challenged by their global revenue exposure. Although the U.S. economy is slowing rapidly, the outlook is worse for Europe and large parts of EM, particularly given the strength of the U.S. dollar. By contrast, mid-caps tend to be more domestically focused.
Small-caps remain the most challenged by the economic outlook. Not only will they struggle to pass on higher costs, so will suffer greater margin pressures than either mid- or large caps, but they will face the greatest debt servicing challenges as growth declines.
With regards to styles, value outperformance may persist a bit longer. Rising real yields should play well for value’s lower duration, lower valuations, and higher dividend yields. However, this may switch as recession comes into view and yields decline. Growth earnings tend to be more resilient than value earnings during a downturn.
Mid-cap outperformance should persist given its more attractive valuations and greater domestic revenue exposure. In terms of styles, value can continue to outperform until growth starts to deteriorate sharply.
Valuation Composite Real Yields And Value Vs. Growth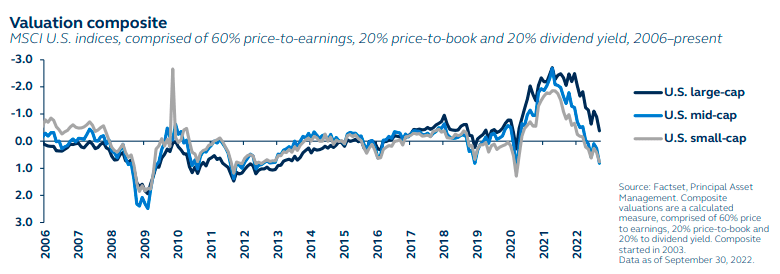
European valuations confront weak fundamentals
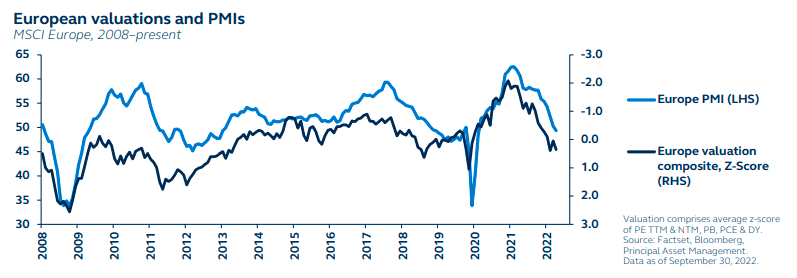
Investors have become extremely bearish about Europe. Certainly, the fundamentals for the euro area economy appear deeply concerning. With natural gas prices extremely elevated and threats of energy rationing hanging over the continent if this winter proves very severe, consumer and business confidence have plunged. Fiscal stimulus measures will offset some of the negative impact from elevated energy prices, but not enough to avoid recession.
Yet, despite the economic concerns, earnings estimates have been persistently revised higher this year, supported by the weakening euro as it lifts the earnings of companies with significant exposure outside Europe. Earnings are likely to be downgraded as the euro area economy weakens, but the euro should take out some of the sting.
With valuations near historic lows, there is a meaningful cushion to absorb negative developments on the earnings front. Indeed, at these valuations, investors should avoid moving to an underweight position, even despite the recessionary outlook and the uncertainty associated with geopolitical risk.
Europe is entering recession and uncertainty surrounds the outlook. Yet, with valuations extremely attractive, investors should avoid moving to an underweight position.
European Earnings And EUR/USD European Valuations And PMIs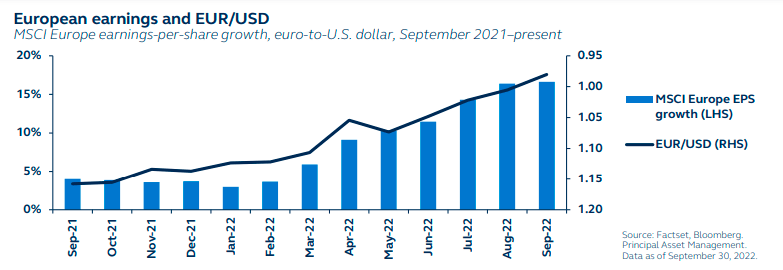
China struggles to make economic headway
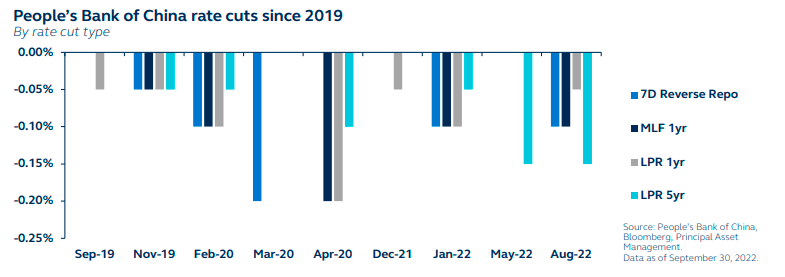
China’s equity market still faces multiple macro headwinds. COVID restrictions continue to weigh on confidence and domestic demand, while the much-battered housing market is having more profound impacts.
The People’s Bank of China has been cutting interest rates targeted at supporting the housing market. However, the risk of further renminbi depreciation and associated capital outflows has meant that the magnitude of the stimulus has been quite modest relative to the desperation of the economic situation. What’s more, with credit demand still constrained by ongoing COVID uncertainty, the effectiveness of PBoC policy cuts has been muted. The property market remains subdued, with wide-reaching effects.
Not only has it led to plunging property investment and handicapped infrastructure investment, but as land sales are an important revenue source for local government, local government fiscal stimulus has been curtailed, further weighing on the recovery. The credit impulse is unlikely to match that of previous cycles, limiting any equity market gains.
China’s equity market may struggle to gain ground until the battered housing market stabilizes, enabling policy stimulus to feed through to the wider economy and market.
China Credit Impulse Index And New Commercial Residential Construction Price Movement People’s Bank Of China Rate Cuts Since 2019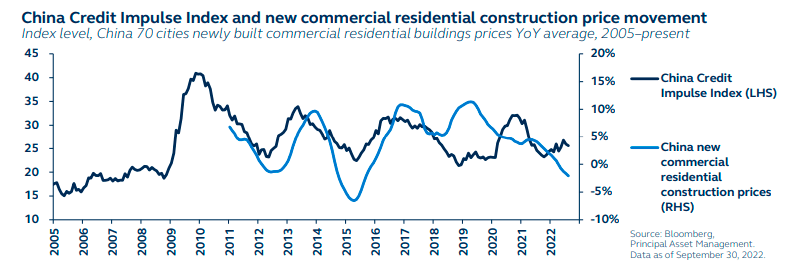
Fixed income
Bond markets bear the brunt of Fed hawkishness
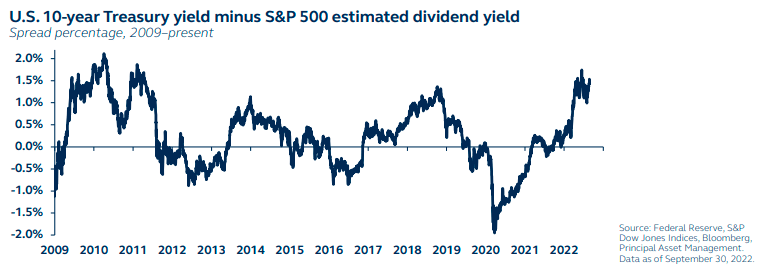
Bond markets are alert to the Fed’s increasingly hawkish tune and suffered a very sharp rout during September. Ten-year Treasury yields almost hit 4% in September – the highest since 2010 – before dropping back to around 3.8% at the end of the quarter. Two-year Treasury yields, which are particularly sensitive to the Fed policy outlook, rose above 4% for the first time since 2007. Not only does this mean that the 2s10s curve is deeply inverted and therefore signalling recession, the spike in yields has upended the TINA dynamic (“there is no alternative” to equities).
Indeed, when interest rates were sitting below 1%, as they were after the Great Financial Crisis and after the 2020 pandemic, it made perfect sense for investors to allocate to equity markets. Dividend yields significantly exceeded Treasury yields.
But this year, after several Fed interest rate increases, Treasury yields have soared above equity dividend yields. With the market narrative now shifting from inflation to recession, and post the sharp repricing higher in yields, bonds look relatively more attractive. The TINA argument to own equities is increasingly challenged.
Bond yields have soared to their highest levels since before the GFC as markets re-priced Fed expectations, upending the TINA argument.
Interest Rates US 10-Year Treasury Yield Minus S&P 500 Estimated Dividend Yield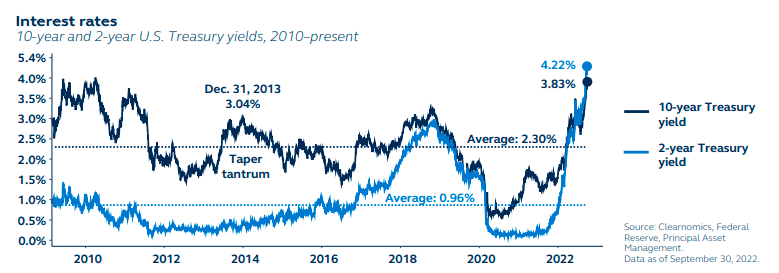
Searching for a good hiding place
For now, with the market still digesting the reality of the Fed’s policy intentions, and economic growth broadly resilient, U.S Treasury yields may remain elevated.
Looking forward, however, rising recession risk, coupled with expectations for eventual Fed policy rate cuts as inflation pressures fade, should push the overall Treasury yield curve lower, but particularly the long-end. U.S. Treasurys are usually a good place to hide out while economic risks increase.
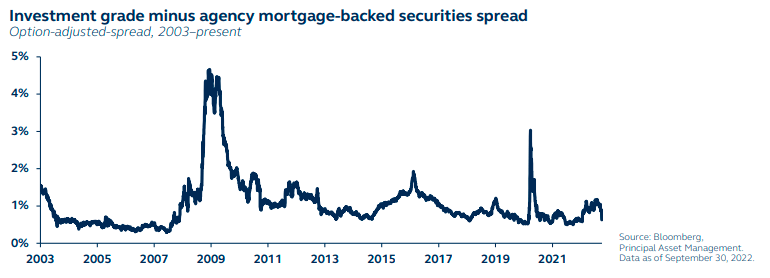
Also within core fixed income, agency securitized debt presents a compelling opportunity for investors that are seeking risk mitigation. It is true that the MBS market has underperformed so far this year, but this was largely due to a challenging technical landscape and concerns that the Fed’s quantitative tightening would imply active MBS sales.
This underperformance now means that agency MBS valuations are particularly attractive, while the possibility of active Fed sales have been all but dismissed by Chair Powell, unwinding some of the risks. Crucially too, agency MBS has historically shown a greater ability to withstand deteriorating growth than other credit segments.
Treasurys should perform well as recession approaches. Securitized debt typically show a greater ability to withstand weakening growth than other credit segments.
US Economic Backdrop And Treasury Yields Investment Grade Minus Agency MBS Spread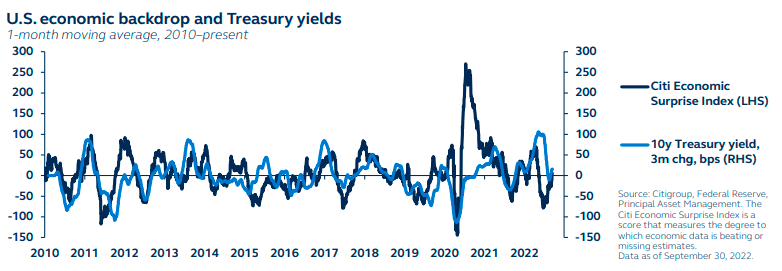
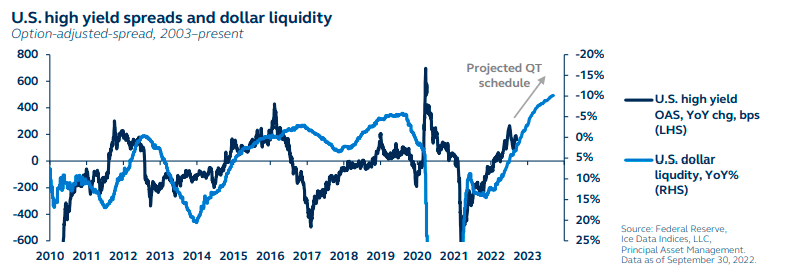
Credit spreads are still bracing for a full unwind
Investment-grade (IG) credit spreads likely face significant further widening as economic growth weakens.
Banks are raising credit standards, suggesting increased vigilance by credit underwriters as the economic outlook deteriorates. This is a signal of rising risk aversion which will likely flow through to wider credit spreads. At the same time, higher policy rates and real yields have bolstered the investment proposition of U.S. Treasurys, reducing the attractiveness of IG.
High yield (HY) has been relatively resilient, likely supported by its exposure to the energy sector. However, with recession approaching, and quantitative tightening now underway, high yield spreads are not sufficiently compensating for the growth and liquidity risks.
As the Fed withdraws liquidity from the bond markets, it will likely become increasingly challenging for corporates to roll-over debts. Tightening financial conditions will not only impact the real economy, leading to higher defaults, but market liquidity will also be challenged. With both credit and liquidity risk rising, HY spreads are likely to widen further.
Both IG and HY face widening spreads as the economic outlook and market liquidity deteriorate. We are underweight both credit segments.
US Investment Grade Spreads And Percentage Of Banks Raising Credit Standards US High Yield Spreads And Dollar Liquidity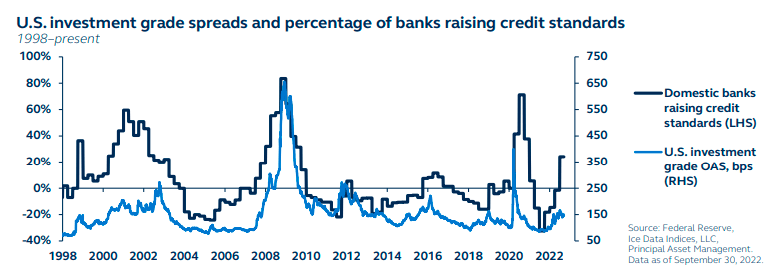
King Dollar to prolong the pain in EM debt
Despite responding proactively to the global inflation surge with early monetary tightening, many emerging market central banks are still being forced to raise rates in order to protect themselves against further U.S. dollar strength. This backdrop is taking its toll on the EM complex.
Inevitably, there will be a large disparity among emerging markets depending on their U.S. dollar currency reserves, export growth, and USD-denominated debt levels.
Larger energy-exporting emerging markets, such as Brazil, with strong export growth and plentiful currency reserves are proving more resilient. On the other hand, energy-importing emerging markets with limited currency reserves are stressed and may eventually require International Monetary Fund support as conditions become more challenging.
Despite the additional risks, local currency emerging market debt yields are only a few basis points higher than U.S. Treasury yields. While in some cases this may be partially explained by strong fundamentals, EM spreads would likely have to widen further to sufficiently offset the higher risks they pose.
The strong U.S. dollar is presenting a significant headwind to EM countries. Equally, once the greenback peaks and starts to weaken, this will be a strong tailwind for EM.
US Dollar Vs. EM Debt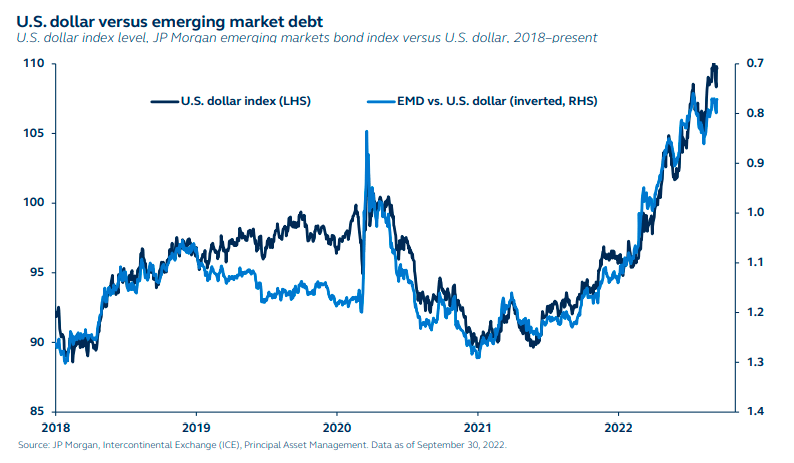
Preferred securities: In a favorable position
The environment has become more challenging over the last quarter as central banks around the world raise rates to fight inflation. Fixed-income securities, including preferred and capital securities, have had a challenging time. Yet, the asset class is in a favorable spot of price, yield, quality, and structure.
Price: Preferred securities are trading below par and are now offering attractive valuations.
Yield: They demonstrate relatively competitive yields, even compared to lower-quality fixed-income assets.
Quality: Typically investment-grade preferred securities, so default rates are lower than high yield.
Structure: Offer “fixed to floating,” “fixed to variable” rate structures which may help a long-term investor as rates rise.
What’s more, although financials would certainly be impacted during a downturn, U.S. banks and consumer-focused lenders are in strong health and should remain resilient over the coming challenging months.
Within fixed income, preferred securities are our favored asset. Not only are yields relatively attractive, but the structure can be ideal in the current environment.
Current Yield And Average Credit Rating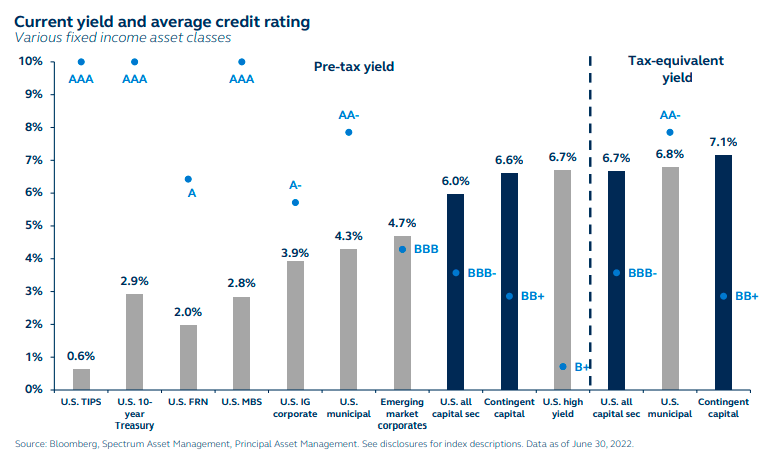
Alternatives
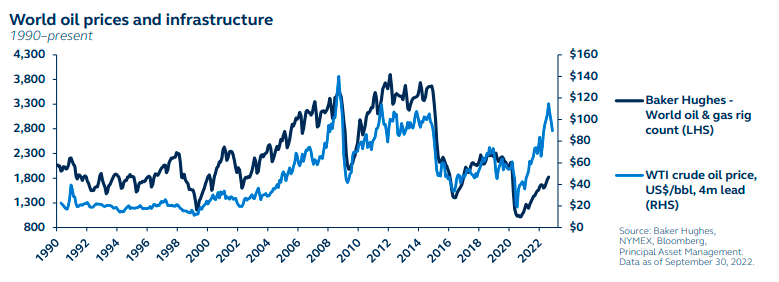
Commodity prices: Short-term relief, long-term pain
While inflation has prompted both stocks and bonds to experience historic drawdowns during 2022, commodities have rallied sharply. Since the start of 2022, natural gas is up 81%, Brent crude up 26%, and iron ore up 11%. The commodity complex, especially energy, has been the standout strategy to mitigate inflation.
Recently, however, global economic strength has faded rapidly, driving markets to become increasingly fearful of recession, resulting in lower commodity prices.
This pain should only be temporary. Although demand may be weakening, it remains firmly above supply. Limited capital expenditure in fossil fuels capacity, coupled with geopolitical tensions, means structural supply deficits that are supportive of commodity prices. The supply response from oil refiners has been muted, suggesting a decrease in the price elasticity of oil supply and, as such, supply will likely remain scarce in the years ahead.
By contrast, the equity beta component of global natural resources may result in more downside if the weakening economic backdrop continues to weigh on commodities.
Commodity prices may come under downward pressure in the near term as recession fears mount. However, structural supply shortages will likely prevent prices from falling too far and will drive them higher in the medium term.
Commodities Component Sub-Indices World Oil Prices And Infrastructure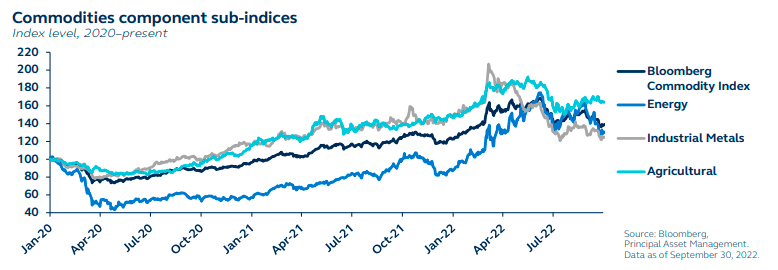
Infrastructure typically shines during high inflation
Our continued constructive views on alternatives convey not only their diversification benefits in this macro environment but also their fundamental strengths and defensive characteristics.
Infrastructure investments are one of the few asset classes that may outperform in the current slowing-growth, high-inflation environment.
As demand for critical services is less sensitive to inflation, owners of certain infrastructure assets can sustain and increase prices without significantly impacting demand, offering potentially resilient returns through periods of higher inflation. Listed infrastructure has historically delivered meaningfully higher returns than global equities during periods of higher inflation.
Furthermore, infrastructure investments typically have predictable cash flows associated with the long-lived assets, with historically attractive yield.
They also offer exposure to the global theme of decarbonization, which presents a multi-decade tailwind for utilities and renewable infrastructure companies.
Challenged equity and fixed-income markets, coupled with stubbornly high inflation, have created a positive backdrop for listed infrastructure.
Listed Infrastructure Performance Compared To Global Equity And Bond Markets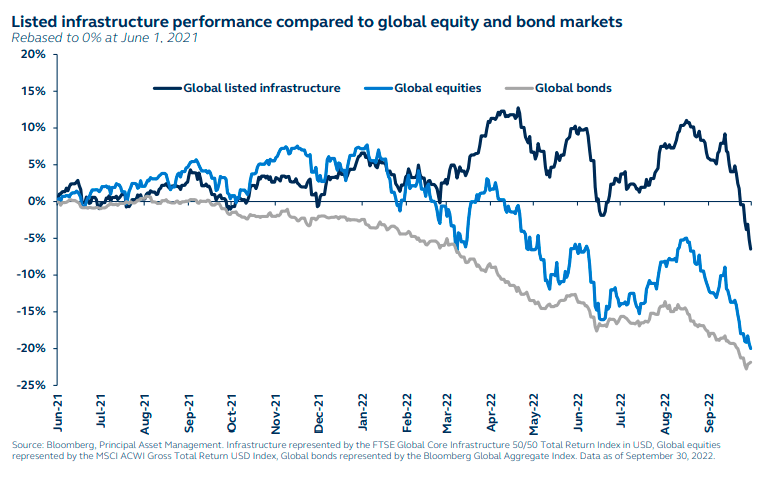
REITs still struggling with rising real yields
Typically, as economic growth weakens, defensive sectors outperform. REITs, a traditionally defensive, low-volatility sector, would usually perform well in the current low-growth, high-volatility environment.
However, Real Estate Investment Trusts (REITs) are also a very rate-sensitive sector, with a high negative correlation to real bond yields and have struggled in the rising rate environment, underperforming other defensive sectors throughout the year.
With central banks continuing to tighten policy, and inflation easing over the coming months as growth deteriorates, real yields are likely to rise further. REITs will come under further pressure, exacerbated by the incremental weakness in the housing market.
In addition, REITs valuations have dividend yields which are below 10-year U.S. Treasury yields. For investors who are seeking investment income, REITs are hardly a compelling investment case.
The rising real rate environment is particularly difficult for REITs given it is a very rate-sensitive sector, and implies further declines are likely.
REITs And Real Yields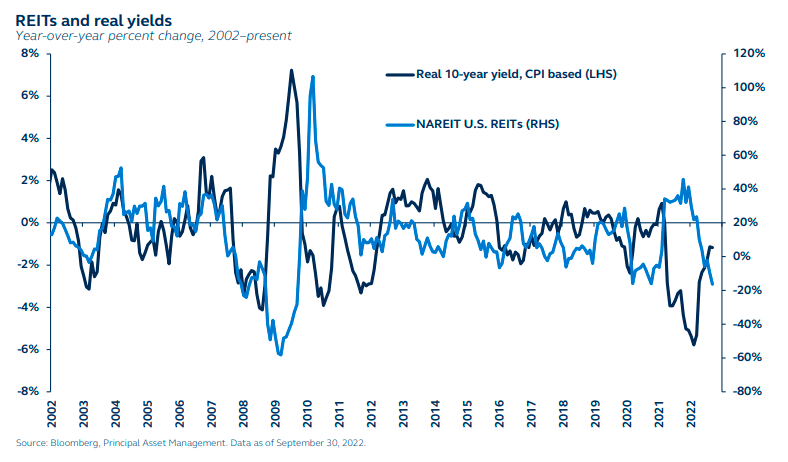
An environment made for real asset outperformance
Investors may struggle to find clear opportunities in the current environment. With inflation high and likely to decline only very gradually, investors should primarily seek assets with high return correlation to inflation.
At the same time, with economic conditions becoming increasingly more difficult, investors ought to have some exposure to low-volatility assets. Assets in the north-west quadrant – low-volatility and high-inflation correlation assets – meet this requirement.
- Core real estate and private infrastructure may provide mitigation against elevated inflation.
- Treasury inflation-protected securities (TIPS) also work as an inflation-resilient diversifier.
At the same time, although returns from commodities and listed infrastructure may be volatile, they historically outperform in inflationary environments and can help diversify equity exposure. Ultimately, holding a diversified basket of high inflation-correlated assets, some low- and some high-volatility, may provide inflation mitigation.
Investing in the current environment is very challenging. Investors may primarily want to preserve portfolios against still-elevated inflation, while also seeking to reduce volatility where possible.
Major Asset Class Inflation Sensitivity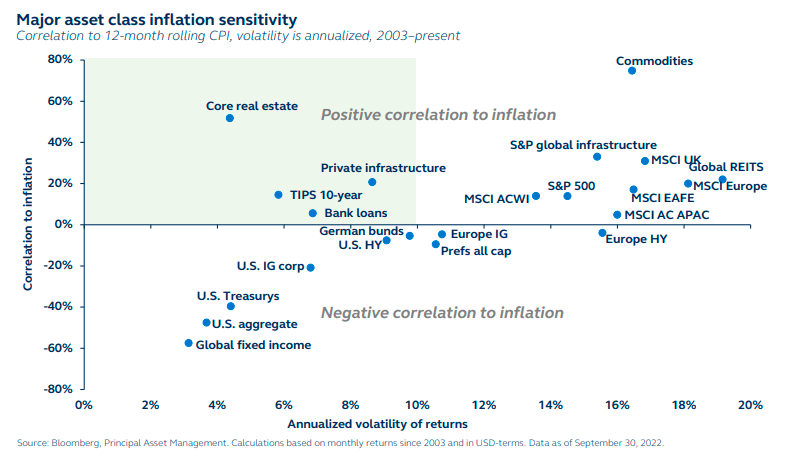
Investment implications
Moving to a more defensive mix: Underweight equities, underweight fixed income, real assets the top pick
Equities
We move equities to underweight as expectations for further Fed tightening and weakening economic growth will likely bring further declines. We retain a preference for the U.S. over other developed market (DM) and emerging market (EM) regions given relative U.S. economic strength and the strong U.S. dollar. In the U.S., we keep large-cap at neutral, given its expensive valuations and significant global exposure. By contrast, mid-caps are more domestically focused, and valuations are below historical averages. European fundamentals are deteriorating, but with valuations so attractive, we keep our neutral position.
Fixed income
Our fixed-income positioning remains underweight, but we shift further to a more defensive stance within the asset class, seeking safety as economic risks begin to pile up. We raise our exposure to both U.S. Treasurys and U.S. securities as yields should move lower as recession comes closer into view – and these assets should provide better protection than credit during periods of high volatility and risk. We reduce our exposure to investment grade from neutral to underweight and keep high yield at an underweight, expecting further spread widening given recession and liquidity fears. Preferred securities remains at overweight due to its favorable yields, low default rates, and exposure to high-quality companies. In EM credit, concerns around the strong U.S. dollar and Federal Reserve tightening keep our exposure at an underweight.
Alternatives
Our continued constructive views on alternatives convey not only their diversification benefits in this macro environment but also their fundamental strengths and defensive characteristics. Specifically, we maintain our overweight to infrastructure, encouraged by its inflation-protection characteristics, stability of cash flows, and exposure to the structural decarbonization trend given structural supply shortages. Despite short-term demand concerns, we also maintain our overweight preference to commodities, as medium-/long-term structural supply shortages should continue to support performance. We reduce our exposure to REITs from neutral to underweight, as rising real yields will continue to negatively impact these securities.
Principal Global Asset Allocation, Data as of September 30, 2022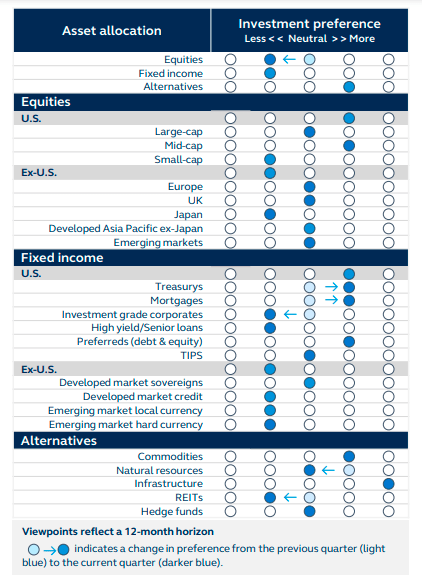
Alternatives asset class include commodities, natural resources, infrastructure, REITs, and hedge funds. Allocations across the investment outlook can be proportionately adjusted so magnitudes across categories do not have to net to neutral.
|
Equities Reduce risk appetite and focus on U.S. high-quality factors |
Position towards certainty and stability
|
How to implement
|
|
Fixed Income Time for defense |
Core fixed income and preferred securities
|
How to implement
|
|
Alternatives Pursue less correlated real asset exposures. |
Real assets
|
How to implement
|
Editor’s Note: The summary bullets for this article were chosen by Seeking Alpha editors.
Be the first to comment