

gorodenkoff/iStock via Getty Images
Rockwell Automation (NYSE:ROK) is a leader in the manufacturing automation space that employs a combination of both hardware and software options for their customers. Rockwell’s solutions aim to make their customers more agile and resilient.
Rockwell is very diversified among industries with the largest exposure being food & beverage which accounted for roughly 20% of FY 2021’s sales.
ROK FY 2021 Revenue Breakdwon by End Market (ROK Q2 FY 2022 Earnings Call Presentation)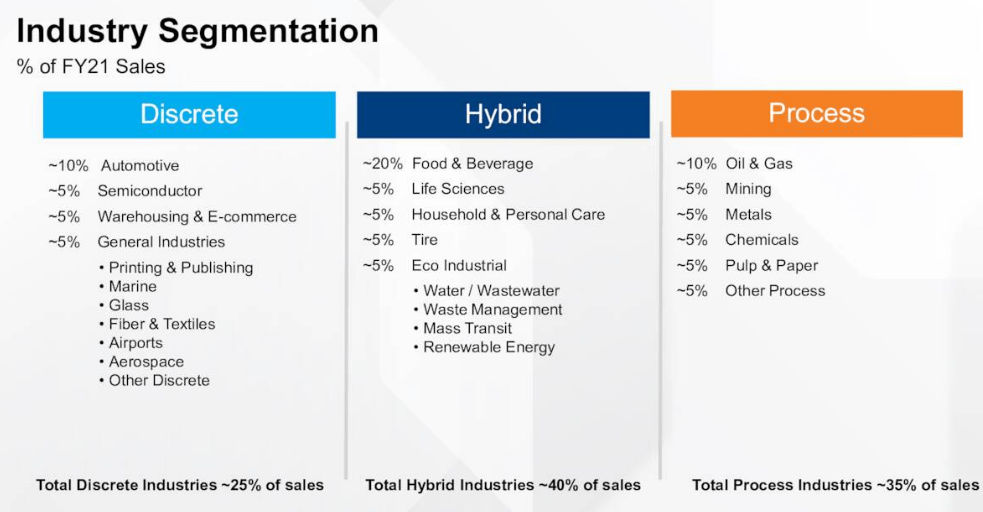
That diversification among end markets allows Rockwell to weather most economic storms well. As a handful of industries start to pull back, others can help pick up the slack.
A major benefit to Rockwell’s business is that they intimately know the operations of their customers. That leads to high switching costs for their clients as they can’t risk a full or even partial shutdown to their operations for a small incremental gain in costs or productivity. It also helps to lock-in their customers for the long-term.
As we’ve seen over the last two years, there’s hardly any company that hasn’t been affected by supply chain disruptions. Many companies are looking to combat that by on-shoring or re-shoring their manufacturing or just expanding their capabilities to different locales.
If that trend plays out, I would expect Rockwell to see a huge boost to their business as new factories are likely to be on the higher end of automation. Automation improves efficiencies as well as speed of the operations allowing businesses to be better equipped to face changing environments. That kind of transition takes time and could lead to a multi-year investment cycle from their customers.
Rockwell has been pushing into software solutions that can work in conjunction with their hardware. Expansion of the software solutions should come along with higher margins as well as more recurring revenue. ARR as of Q2 FY 2022 was up 50% with 17% being organic growth.
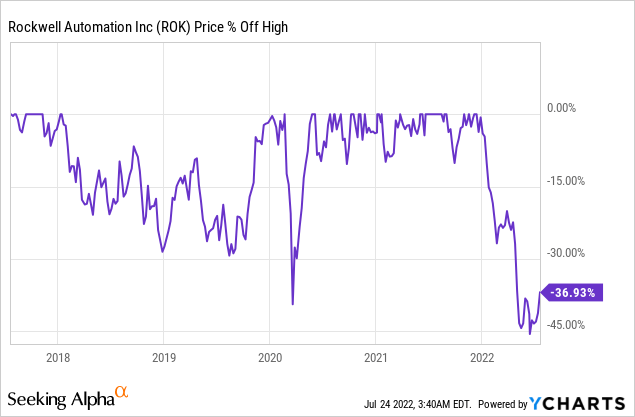
I’m always on the lookout for new potential investments. Rockwell’s share price pulled back over 45% from its late 2021 high near $355, although it currently sits roughly 37% off that high after a rally over recent weeks. That large of a pullback piqued my interest into looking deeper at the business.
Dividend History
As a dividend growth investor, I try to build the bulk of my portfolio around companies that lie in the so-called sweet-spot with current dividend yields in the 2.5% – 4.0% range and annual dividend growth in the 6-10% area. However, as a relatively young investor, I also want to sprinkle in what I perceive to be quality companies even if they carry much lower initial dividend yields, but come with the possibility of much faster dividend growth.
Rockwell Automation Dividend History (ROK Investor Relations)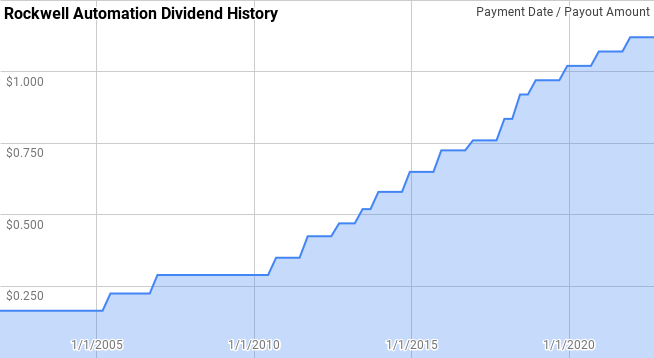
Rockwell’s dividend growth streak is up to 13 years now giving them the title of Dividend Challenger. Although Rockwell has paid the same or higher dividend since at least 2002 with a few periods of frozen dividends.
During the 13-year dividend growth streak, Rockwell’s annual dividend growth has ranged from 4.7% to 20.9% with an average of 11.1% and a median of 11.5%.
Beginning with 2002, there’s been 16 rolling 5-year periods with annualized dividend growth ranging from 8.1% to 16.3% with an average of 11.3% and a median of 11.5%.
Over that same time, there’s been 11 rolling 10-year periods with Rockwell’s annualized dividend growth spanning from 9.9% to 13.4% with an average and median of 11.7%.
The rolling 1-, 3-, 5-, and 10-year annualized dividend growth rates from Rockwell since 2002 can be found in the following table.
| Year | Annual Dividend | 1 Year | 3 Year | 5 Year | 10 Year |
| 2002 | $0.66 | ||||
| 2003 | $0.66 | 0.00% | |||
| 2004 | $0.66 | 0.00% | |||
| 2005 | $0.78 | 18.18% | 5.73% | ||
| 2006 | $0.900 | 15.38% | 10.89% | ||
| 2007 | $1.160 | 28.89% | 20.68% | 11.94% | |
| 2008 | $1.160 | 0.00% | 14.14% | 11.94% | |
| 2009 | $1.160 | 0.00% | 8.83% | 11.94% | |
| 2010 | $1.220 | 5.17% | 1.70% | 9.36% | |
| 2011 | $1.475 | 20.90% | 8.34% | 10.38% | |
| 2012 | $1.745 | 18.31% | 14.58% | 8.51% | 10.21% |
| 2013 | $1.980 | 13.47% | 17.52% | 11.29% | 11.61% |
| 2014 | $2.320 | 17.17% | 16.30% | 14.87% | 13.40% |
| 2015 | $2.600 | 12.07% | 14.22% | 16.34% | 12.79% |
| 2016 | $2.900 | 11.54% | 13.56% | 14.48% | 12.41% |
| 2017 | $3.040 | 4.83% | 9.43% | 11.74% | 10.11% |
| 2018 | $3.510 | 15.46% | 10.52% | 12.13% | 11.71% |
| 2019 | $3.880 | 10.54% | 10.19% | 10.83% | 12.83% |
| 2020 | $4.080 | 5.15% | 10.31% | 9.43% | 12.83% |
| 2021 | $4.280 | 4.90% | 6.83% | 8.10% | 11.24% |
| 2022 | $4.480 | 4.67% | 4.91% | 8.06% | 9.89% |
Source: Author; Data Source: Rockwell Automation Investor Relations
Of course, the safety of a dividend is of big importance to dividend growth investors. As such, the dividend payout ratio is a metric that I follow to see how much of the earnings or free cash flow has been committed to the dividend payout. All else being equal, the lower a payout ratio the better, as it allows for continued dividend growth during temporary setbacks for the business as well as allows for faster dividend growth as the payout ratio is expanded.
ROK Dividend Payout Ratios (ROK SEC filings)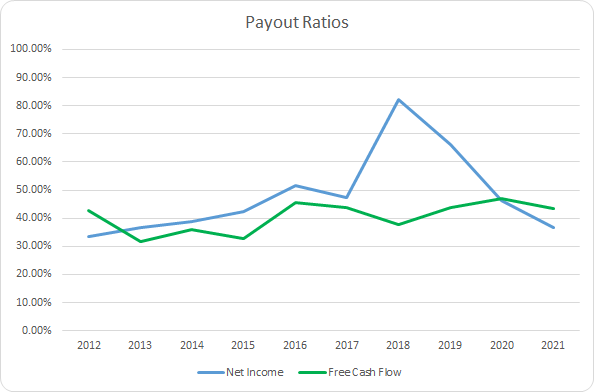
Rockwell’s dividend payout ratios have been quite steady over the last decade implying that dividends have roughly tracked with the growth of the underlying business. The 10-year average net income payout ratio is 48.1% with the 5-year average at 55.7%. Likewise, the average free cash flow payout ratios are 40.5% and 43.2%, respectively.
Quantitative Quality
The aim for my portfolio is to identify what I believe are quality companies that have an ability to continue growing and improving over time. In doing so, I track a business across a number of financial metrics to see how the business has performed and transformed over time.
ROK Revenue Profits and Cash Flow (ROK SEC filings)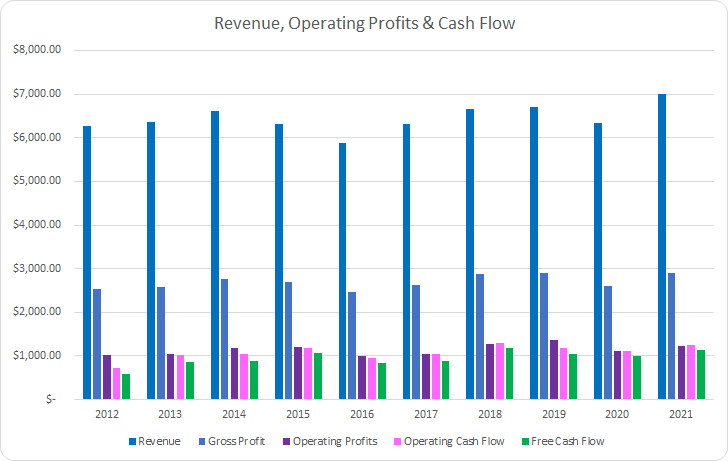
The first thing that stands out is the lack of growth over that time for Rockwell. Over the last decade, revenues are up just 11.8% or 1.2% annualized with gross profits rising 14.9% or 1.6% annualized.
Operating profits tracked along with sales increasing 18.1% or 1.9% annualized. However, operating cash flow showed rather impressive growth, relatively speaking, improving by 75.4% or 6.4% annualized. Similarly, free cash flow grew by 97.1% in total or 7.8% annualized.
My expectation is that a good business will show at minimum stable margins over time and more likely improving margins. I typically want to see free cash flow margins greater than 10%.
ROK Margins and CCR (ROK SEC filings)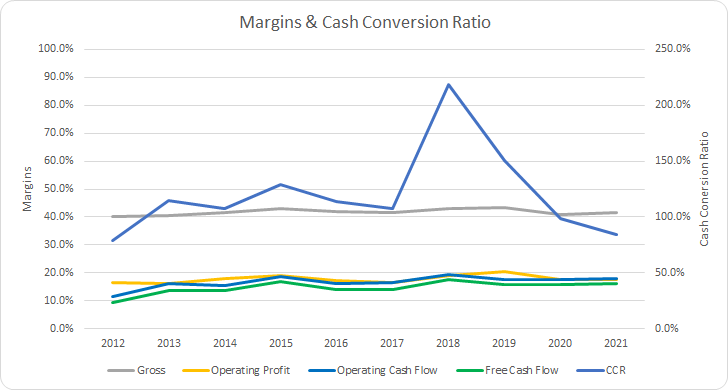
Rockwell’s gross margin has averaged 41.8% over the last decade and 42.1% for the most recent 5-years. However, Rockwell’s free cash flow margin has shown solid improvement over that time. The 10-year average free cash flow margin is 14.7% with the 5-year average at 15.9%.
Additionally, I want to invest in businesses that are efficient at generating free cash flow from their asset and invested capital base. The main metric that I track is the free cash flow return on invested capital, FCF ROIC. In general, I expect to see stable FCF ROIC’s over time and preferably rising levels. Rising FCF ROICs imply that the business is generating higher cash flows compared to subsequent rises in invested capital and are investing additional capital into higher return projects.
ROK Free Cash Flow Returns (ROK SEC filings)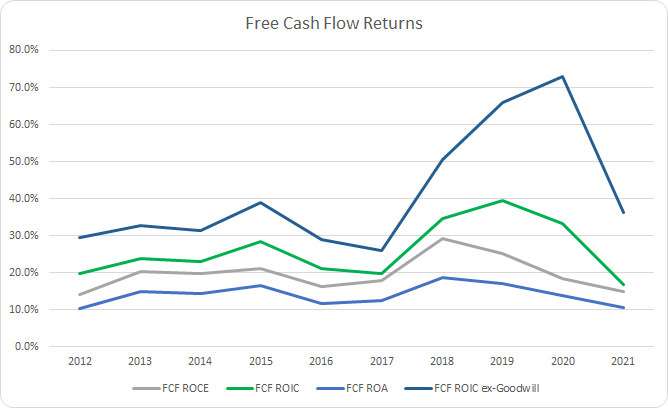
Rockwell has maintained excellent free cash flow returns over the last decade with every year showing impressive FCF ROAs greater than 10%. Similarly, the 10-year average FCF ROIC works out to 26.0% with the 5-year average at 28.8%.
To understand how Rockwell uses its free cash flow, I calculate three variations of the metric defined below:
- Free Cash Flow, FCF: Operating cash flow less capital expenditures
- Free Cash Flow after Dividend, FCFaD: FCF less total cash dividend payments
- Free Cash Flow after Dividend and Buybacks, FCFaDB: FCFaD less net cash used on share repurchase activity
ROK Free Cash Flows (ROK SEC filings)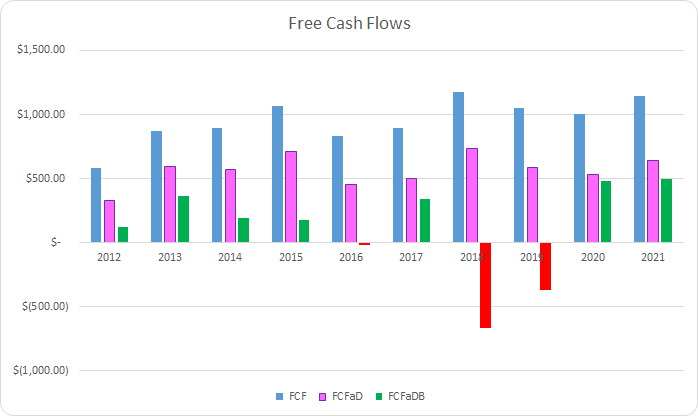
Rockwell has consistently generated strong FCF during the last decade. In total, they have earned $9.5 billion in FCF over that time. Rockwell has also sent a cumulative total of $3.8 billion to shareholders through dividends which puts the 10-year FCFaD at $5.7 billion. Rockwell has also used a net total of $4.5 billion on share repurchases which puts the cumulative FCFaDB for the last 10 years at $1.1 billion.
Personally, I would prefer special dividends rather than buybacks, as too often management teams are eager to repurchase shares when everything is going well and they are flush with cash. Unfortunately, the good times usually coincide with rich valuations and repurchases are slowed, or stopped altogether, when the inevitable bad times come and valuations become depressed. As such, I realize that most businesses will purchase buybacks as opposed to special dividends.
ROK Shares Outstanding (ROK SEC filings)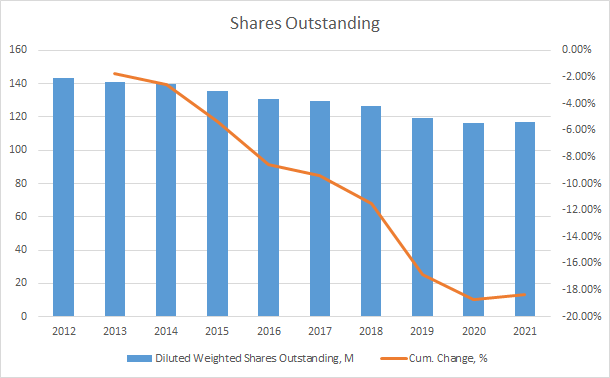
Over the last decade, Rockwell has been aggressive with reducing its share count. During that time, the share count has fallen by 18.3% in total or roughly 2.2% annualized.
That’s been a solid tailwind to the per-share growth of the business, which translated 1.2% annualized total revenue growth into 3.6% per-share growth. Similarly, free cash flow showed 7.8% annualized growth versus 10.3% annualized growth on a per share basis.
As an investor in the equity of a business, I want to make sure the business isn’t excessively leveraged. One measure that I follow is the debt-to-capitalization ratio. I want to see stable or improving debt-to-capitalization ratios over time.
ROK Debt to Capitalization Ratio (ROK SEC filings)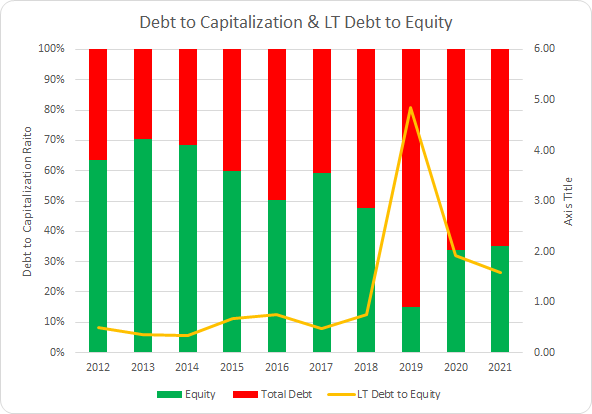
Rockwell’s debt-to-capitalization ratio has been on the rise over the last decade. The 10-year average sits at 50% while the 5-year average comes to 62%. Similarly, the long term debt-to-equity ratio has been on the rise. The 10-year average LT debt-to-equity ratio is 1.22x with the 5-year average up to 1.9x.
When trying to understand how much leverage there is on the business, I place more weight on the net debt ratios. The net debt ratios examine the net debt (total debt less cash) versus some measure of profits or cash flow. This gives you a better idea of how much debt is placed upon the underlying business as well as how quickly they could de-lever assuming no material changes to the business.
ROK Debt Ratios (SEC Filings)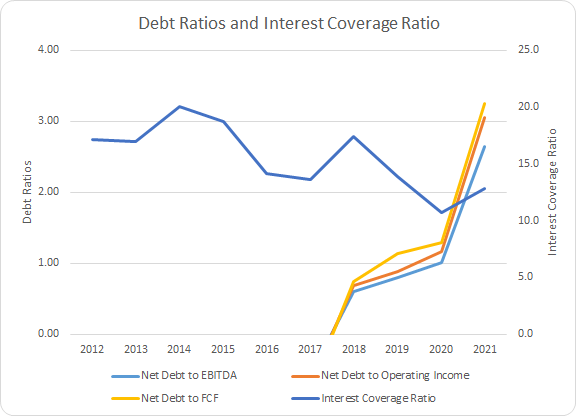
Prior to FY 2018, Rockwell carried a net cash position on their books which is rather enviable. However, with the subsequent increase in debt levels, their net debt ratios have been on the rise. The 10-year average net debt-to-EBITDA, net debt-to-operating income, and net debt-to-FCF ratios are 0.26x, 0.29x, and 0.29x. However, the 5-year averages are 0.89x, 1.02x, and 1.13x.
Similarly, the interest coverage ratio has been falling, although not precipitously. The 10-year average interest coverage ratio is 15.6x with the 5-year average at 13.7x.
Despite what appears to be pretty solid ratios, I’ll be watching the net debt ratios as they were up significantly in FY 2021 even in the face of improving metrics in the denominator. However, that’s largely due to the acquisition related increase in debt. Management is expecting to continue to de-lever and a follow through on that would be very welcomed.
Valuation
When valuing a potential investment, I always try to value the business from different viewpoints in an attempt to try and home in on a fair value range. The valuation methods that I use are dividend yield theory, a reverse discounted cash flow analysis, and a minimum acceptable rate of return (MARR) analysis.
Dividend yield theory is a valuation method built on the premise of reversion to the mean. It operates under the assumption that investors, collectively, will value a business such that it provides a “normal” dividend yield over time. For Rockwell, I’ll use the average 3-year forward dividend yield as a proxy for fair value.
Rockwell Automation Dividend Yield Theory (ROK Investor Relations and Google Finance)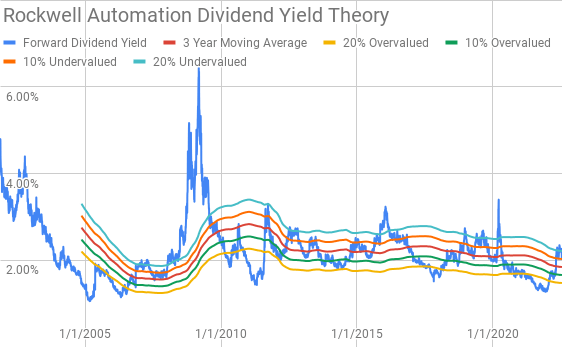
Since around 2012, Rockwell has typically offered investors a forward dividend yield between the 2-3% range. The +/- 20% ranges have also been fairly good markers of short-term under- or overvaluation areas. Currently, Rockwell shares offer a forward dividend yield of 2.02% compared to the 3-year average forward dividend yield of 1.84%.
A reverse discounted cash flow analysis can be used to reverse engineer what the future growth and margins of a business needs to be in order for the current market valuation to be justified. In other words, it’s sort of a reality check on what you need to believe the business will be able to generate in terms of growth and cash flow.
I use a simplified DCF model built on revenue growth, an initial free cash flow margin of 15.0% that improves to 17.0% during the forecast period, and a terminal growth rate of 3.0%.
Based on a 5-year average after tax cost of debt of 3.15% for Rockwell and my standard hurdle rate of a 10% cost of equity the WACC comes to 9.0%. Using an 8.0% cost of equity, the WACC for the DCF comes to 7.3%.
Under those assumptions, Rockwell needs to grow revenues 7.9% annually during the forecast period in order to justify the 10% cost of equity. With the 7.3% WACC/8% cost of equity, the required revenue growth declines to just 2.8%.
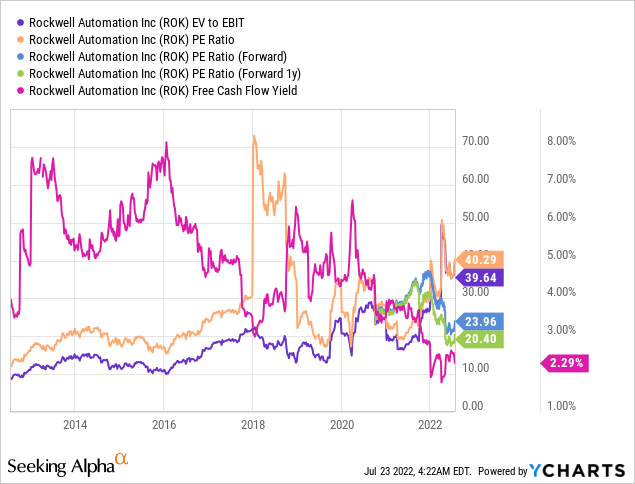
For the MARR analysis, I’ll begin with the analysts’ estimates. For FY 2022, analysts expect that Rockwell will earn $9.28 per share and the average estimate for FY 2023 is $10.91. They also expect Rockwell to be able to grow EPS at a 10.0% rate over the next 5 years. I then assumed that EPS growth would slow to 5.0% annually for the following 5-years. Dividends are assumed to target a 48% payout ratio.
The next step is to determine a reasonable multiple to use as a terminal multiple in order to figure out a future share price. As you can see in the following YChart, Rockwell has typically traded between ~15x and ~30x TTM EPS with ~20x being more of a median multiple.
The following table shows the potential internal rates of return that an investment in Rockwell could generate provided the assumptions laid out above prove to be achievable forecasts. Returns assume that shares are purchased for $221.60, Friday’s closing price. Dividends are assumed to be taken in cash as well as paid and increased along the intervals that Rockwell has normally followed.
| IRR | ||
| P/E Level | 5 Year | 10 Year |
| 30 | 19.8% | 12.9% |
| 25 | 15.2% | 10.9% |
| 22.5 | 12.6% | 9.8% |
| 20 | 9.8% | 8.6% |
| 17.5 | 6.7% | 7.2% |
| 15 | 3.2% | 5.7% |
Source: Author
Additionally, I use the MARR framework to work backwards from the future price and determine what I could pay today in order to generate the returns that I desire from my investments. My base hurdle rate is a 10% IRR and for Rockwell I’ll also examine 12% and 8% return thresholds.
| Purchase Price Targets | ||||||
| 10% Return Target | 12% Return Target | 8% Return Target | ||||
| P/E Level | 5 Year | 10 Year | 5 Year | 10 Year | 5 Year | 10 Year |
| 30 | $322 | $279 | $298 | $239 | $348 | $328 |
| 25 | $271 | $240 | $251 | $205 | $293 | $280 |
| 22.5 | $246 | $220 | $228 | $189 | $266 | $257 |
| 20 | $221 | $200 | $205 | $172 | $239 | $233 |
| 17.5 | $196 | $180 | $182 | $155 | $211 | $210 |
| 15 | $171 | $160 | $159 | $138 | $184 | $186 |
Source: Author
Conclusion
Rockwell is an interesting company to me as they help other companies do things better, cheaper, and faster. Rockwell’s sales have struggled to show much improvement over the last decade; however, they have shown a strong improvement in profitability over that time.
Rockwell has typically maintained strong free cash flow margins routinely in the 15% area with impressive FCF ROICs well above 20%. Rockwell has been looking to expand its automation and optimization software offerings that should lead to higher margins overall as the push away from strictly hardware continues.
ROK 2Q FY 2022 Guidance (ROK FY 2022 Q2 Earnings Call Presentation)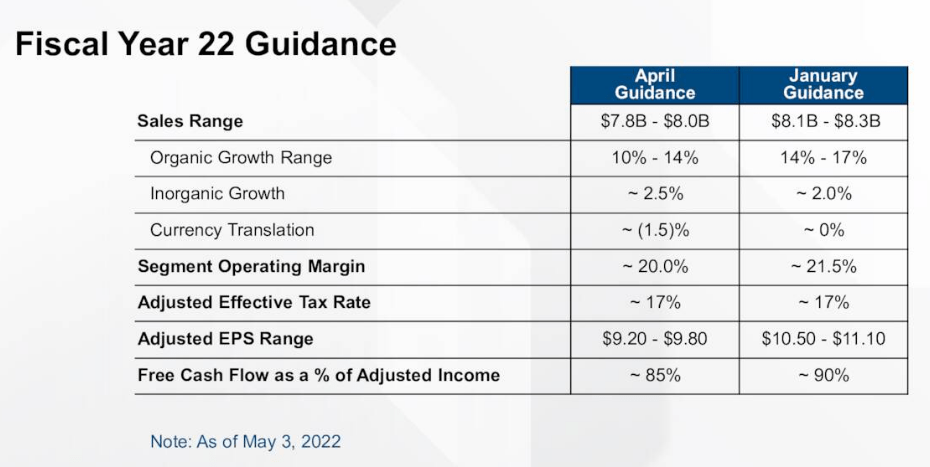
While historically revenue growth has been lackluster, management is expecting solid growth for FY 2022. Guidance has dropped but is still expected to come in at 10%+ for the year, although that’s fallen from the high teens area after the Q1 release.
Dividend yield theory suggests a fair value range between $221 and $270. Meanwhile the MARR analysis with a 10% return target and an exit multiple between 17.5x and 22.5x puts fair value between $196 and $246. Lowering the return threshold to 8% raises the fair value range to $211 and $266.
The reverse DCF seems to imply that 10% returns will be pretty difficult for Rockwell to achieve with revenue growth required to come to 7.9% annually during the forecast period although it’s not entirely impossible. Or a significant increase to margins to help bring down the necessary growth rate. However, 8% returns appear to be a fairly low hurdle for Rockwell to hit. Of course, continued share repurchases similar to the last decade, ~2.2% annual reduction, could help to push the returns up over the 10% mark.
A potential growth avenue is on-shoring/re-shoring of manufacturing as companies look to improve the supply chain issues that played out during the pandemic. If that comes to pass, I would expect to see more capital spent on higher tech manufacturing processes in an attempt to capture some of the lost margin as labor costs are likely to rise. That would bode well for Rockwell.
Rockwell looks intriguing at the current price of $221.60 per share. If Rockwell’s growth, as forecast by analysts, and used in the MARR analysis comes to pass, then 10%+ returns are quite likely. Helping to bolster the current undervaluation is the ~10% undervaluation as suggested by dividend yield theory.
Be the first to comment