

Cindy Ord/Getty Images Entertainment
Robinhood (NASDAQ:HOOD) was founded in 2013 and is a true pioneer in the concept of “free trading”. The company spearheaded the industry with its transaction volume-based model which enticed many new investors into the market. Robinhood had incredible growth in 2020, as the platform was poised to benefit from the stimulus check-fueled trader who was locked down at home. But now we are in a very different macroeconomic environment and investors are more caution about transacting. In this post I’m going to breakdown Robinhood’s financials and valuation, and why this could be a “Hold” or “Hodl” for you meme stock traders out here, let’s dive in.
Third Quarter Financials
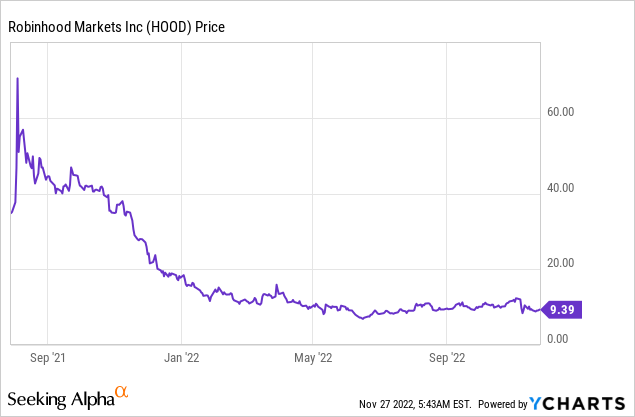
Robinhood reported mixed financial results for the third quarter of 2022. Revenue was $361 million, which increased by 13.5% sequentially but missed analyst estimates by $6.8 million. This was driven by a continued decline in Monthly Active Users (MAU) which declined from 18.9 million to 12.2 million or negative 35% year over year. Taking a step back, this is a common trend I have noticed across the entire stock investing niche since the high inflation numbers were released in the second quarter of 2021. This caused the investing community to immediately factor in higher interest rates and thus lower valuation multiples on stocks, due to a higher discount rate. We then saw a large transition from “growth stocks” to “value stocks” by institutional investors. However, many retail investors were “left holding the bag” on high-growth stocks which had declined substantially. As the stock market, dipped, retail investors bought, but it kept dipping. Then I believe many retail investors fell out of love with the stock market and are now in a place of stagnant activity. This pattern matches with the S&P 500 index which peaked in December 2021, although the Nasdaq felt more pressure.
Monthly Active Users (Q3,22 report)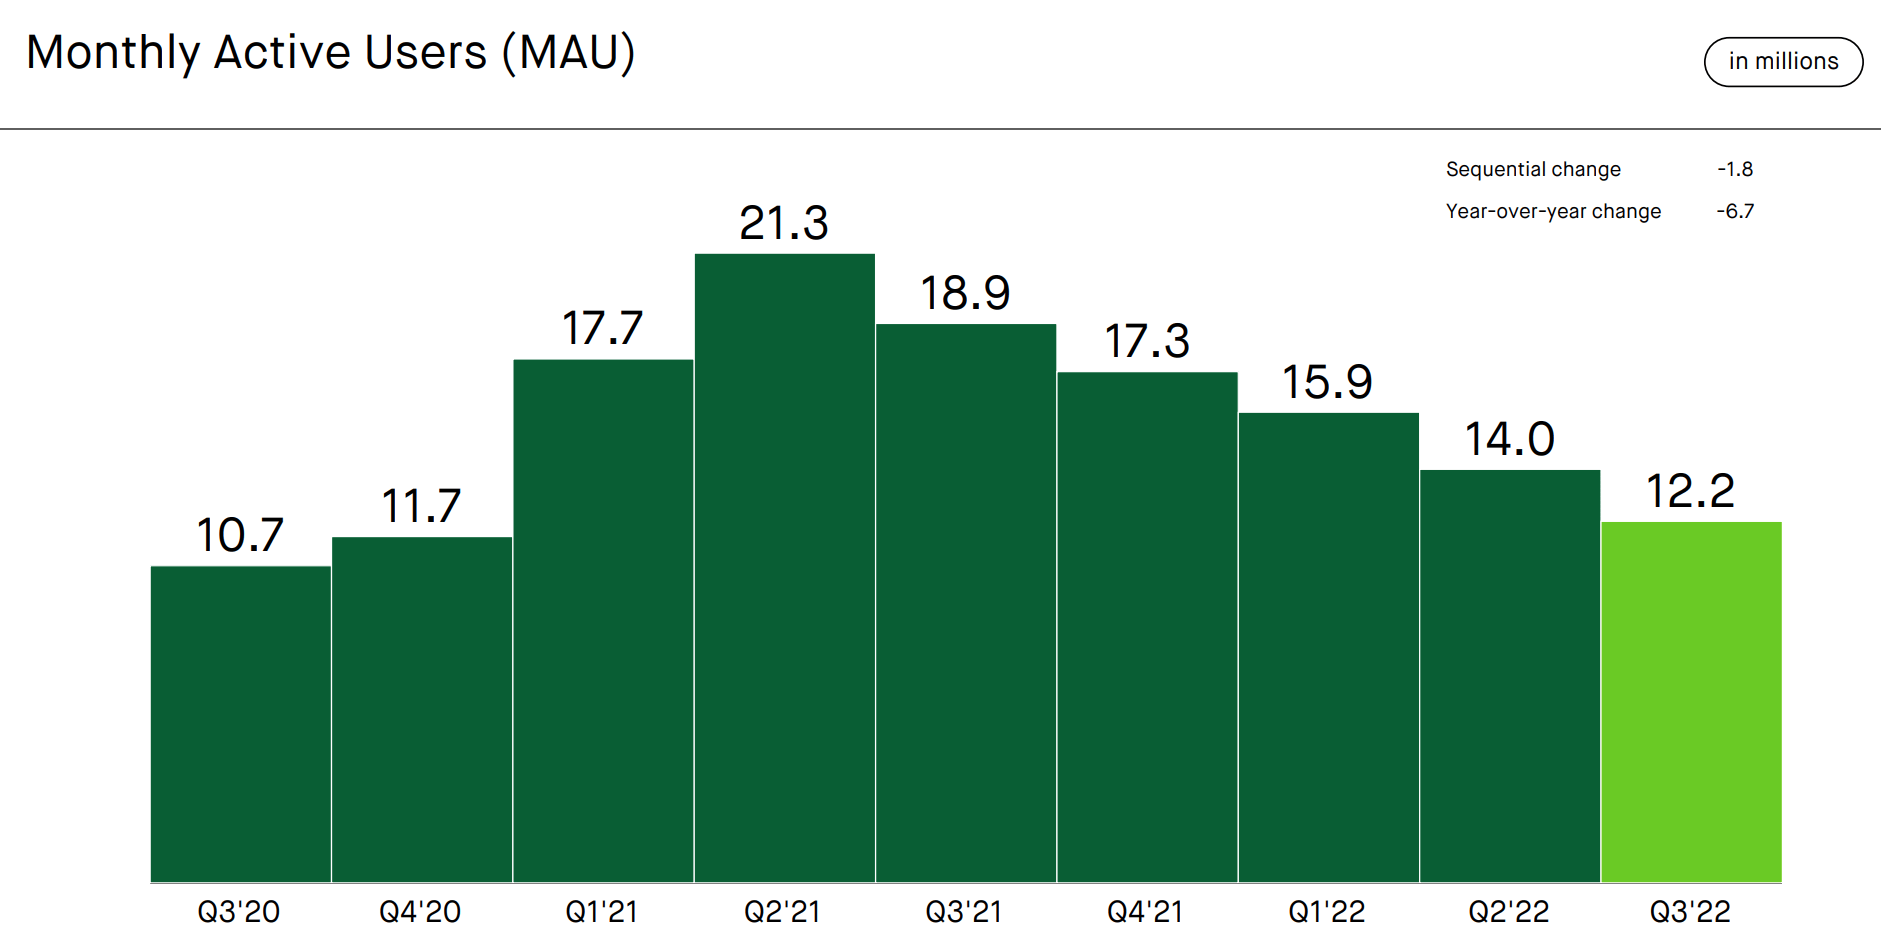
The good news for Robinhood is its net funded accounts have started to increase to 22.9 million, up 60,000 since the second quarter. Therefore despite transaction-based revenue declining, Robinhood increased its Net Interest Revenues. This metric increased by $17 billion year over year, cash sweep balances increased to $3.7 billion with $2.4 billion in gold. In my previous analysis on Coinbase (COIN) I highlighted a similar pattern as many investors preferred to leave cash/crypto inside their account and opt for the use of more “staking” interest-generating savings products.
Net Interest Revenue (Q3,22)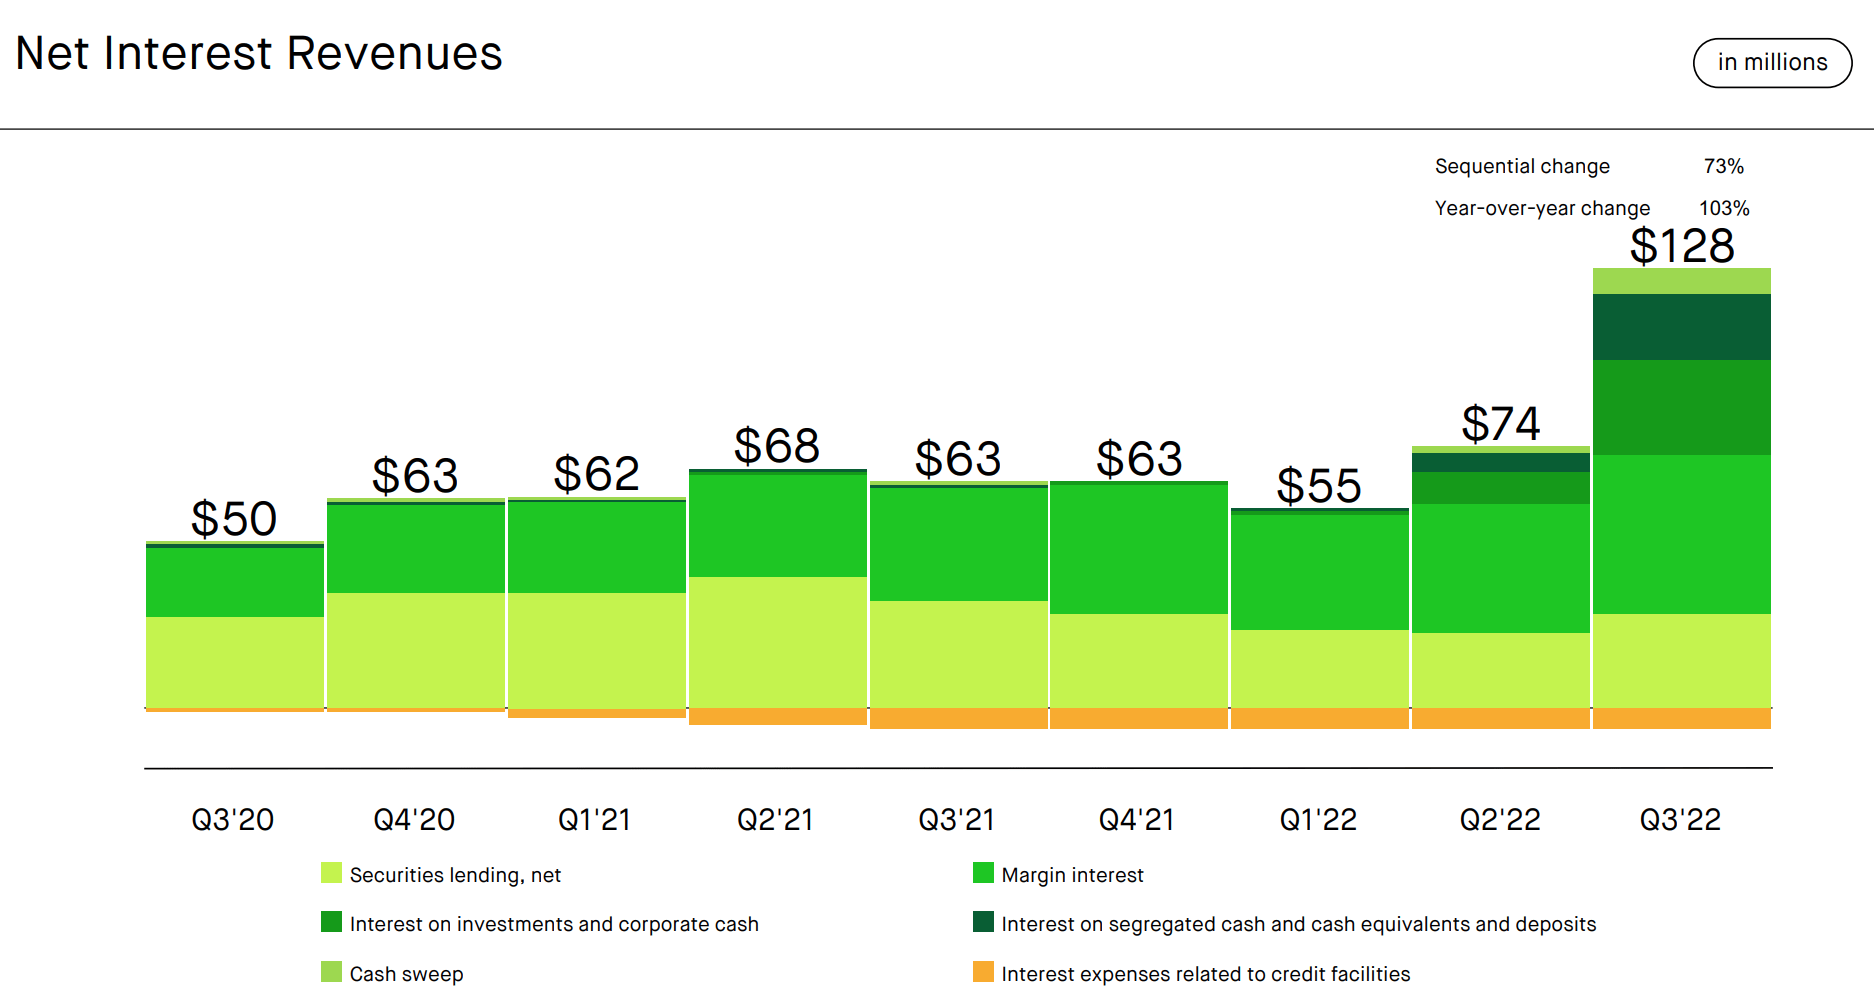
In May, Robinhood launched its fully paid securities lending program, which generated approximately $4 million of revenue in the third quarter. Assets Under Custody were relatively flat since the last quarter at $65 billion which represented the aforementioned trends of saving and “holding” stocks. Ironically buying stocks when they are down is the best time to purchase, as they are cheaper but as liquidity has been pulled from the economy most investors are in a fear-based mindset, like a rabbit in the headlights.
Assets Under Custody (Q3,22 report)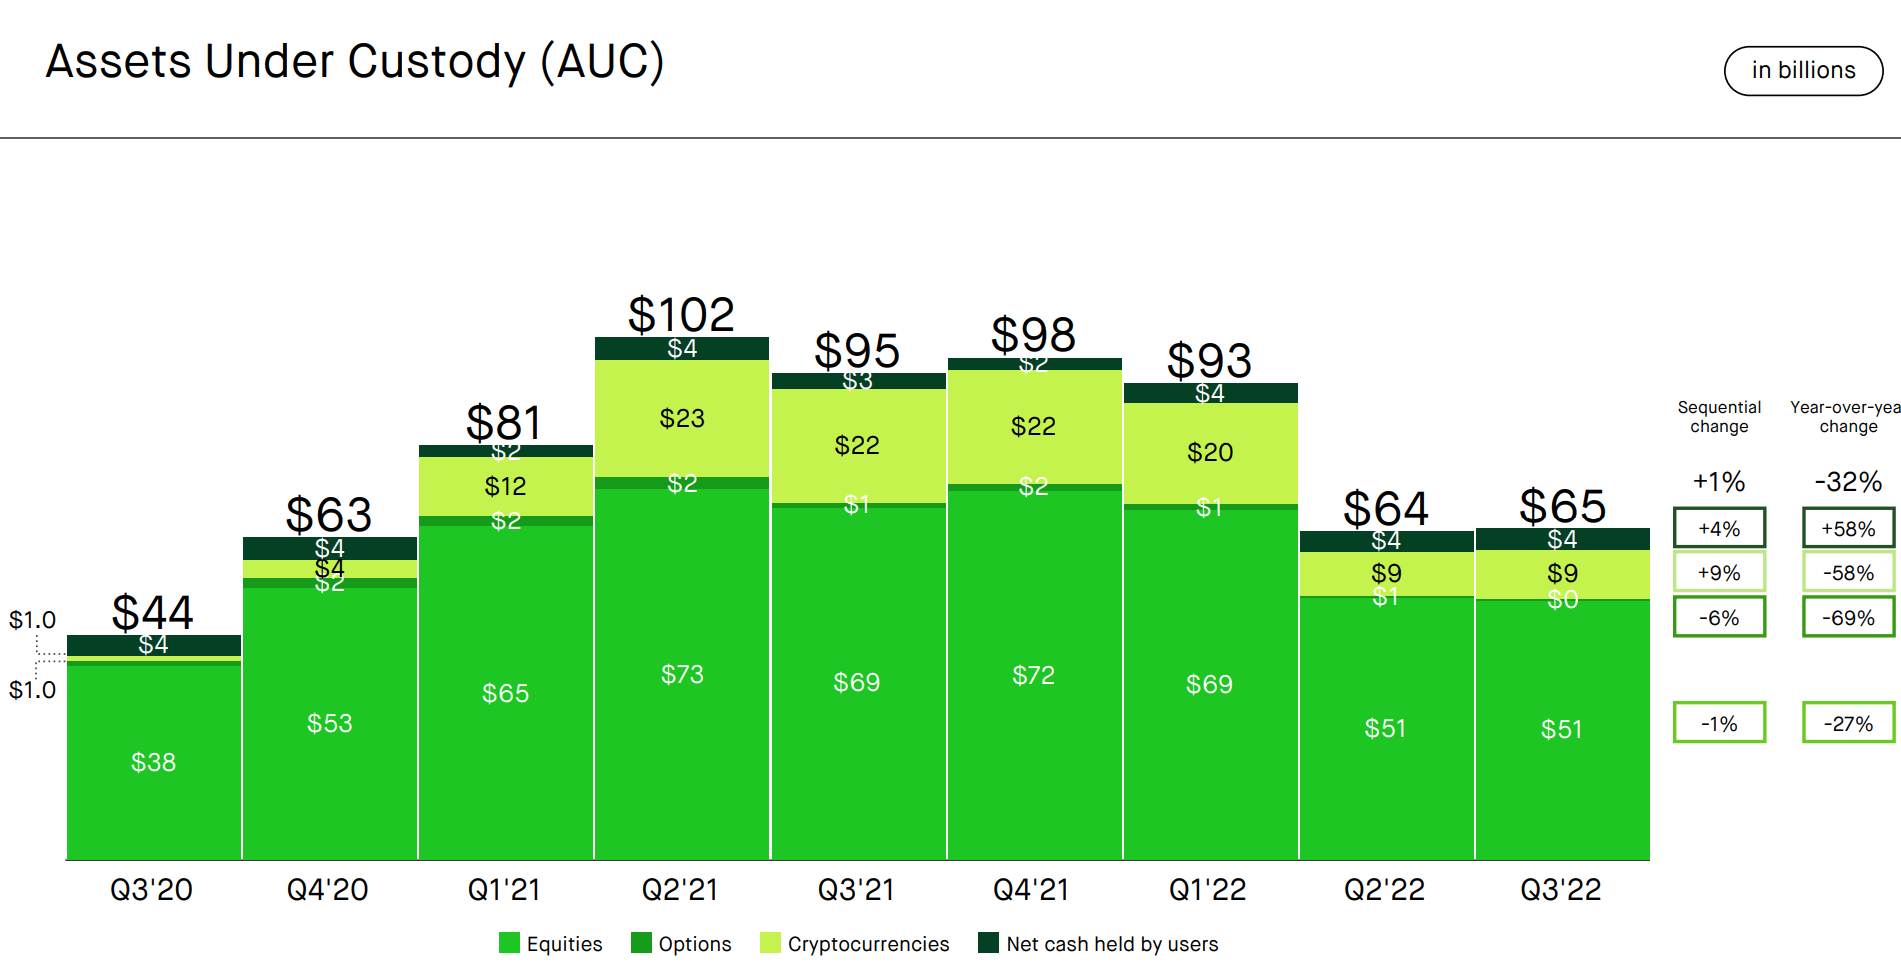
Due to the increase in Net Interest Revenue, the Average Revenue Per User [APRU] has increased by $7 since the prior quarter, which is a positive.
Average revenue per user (Q3,22)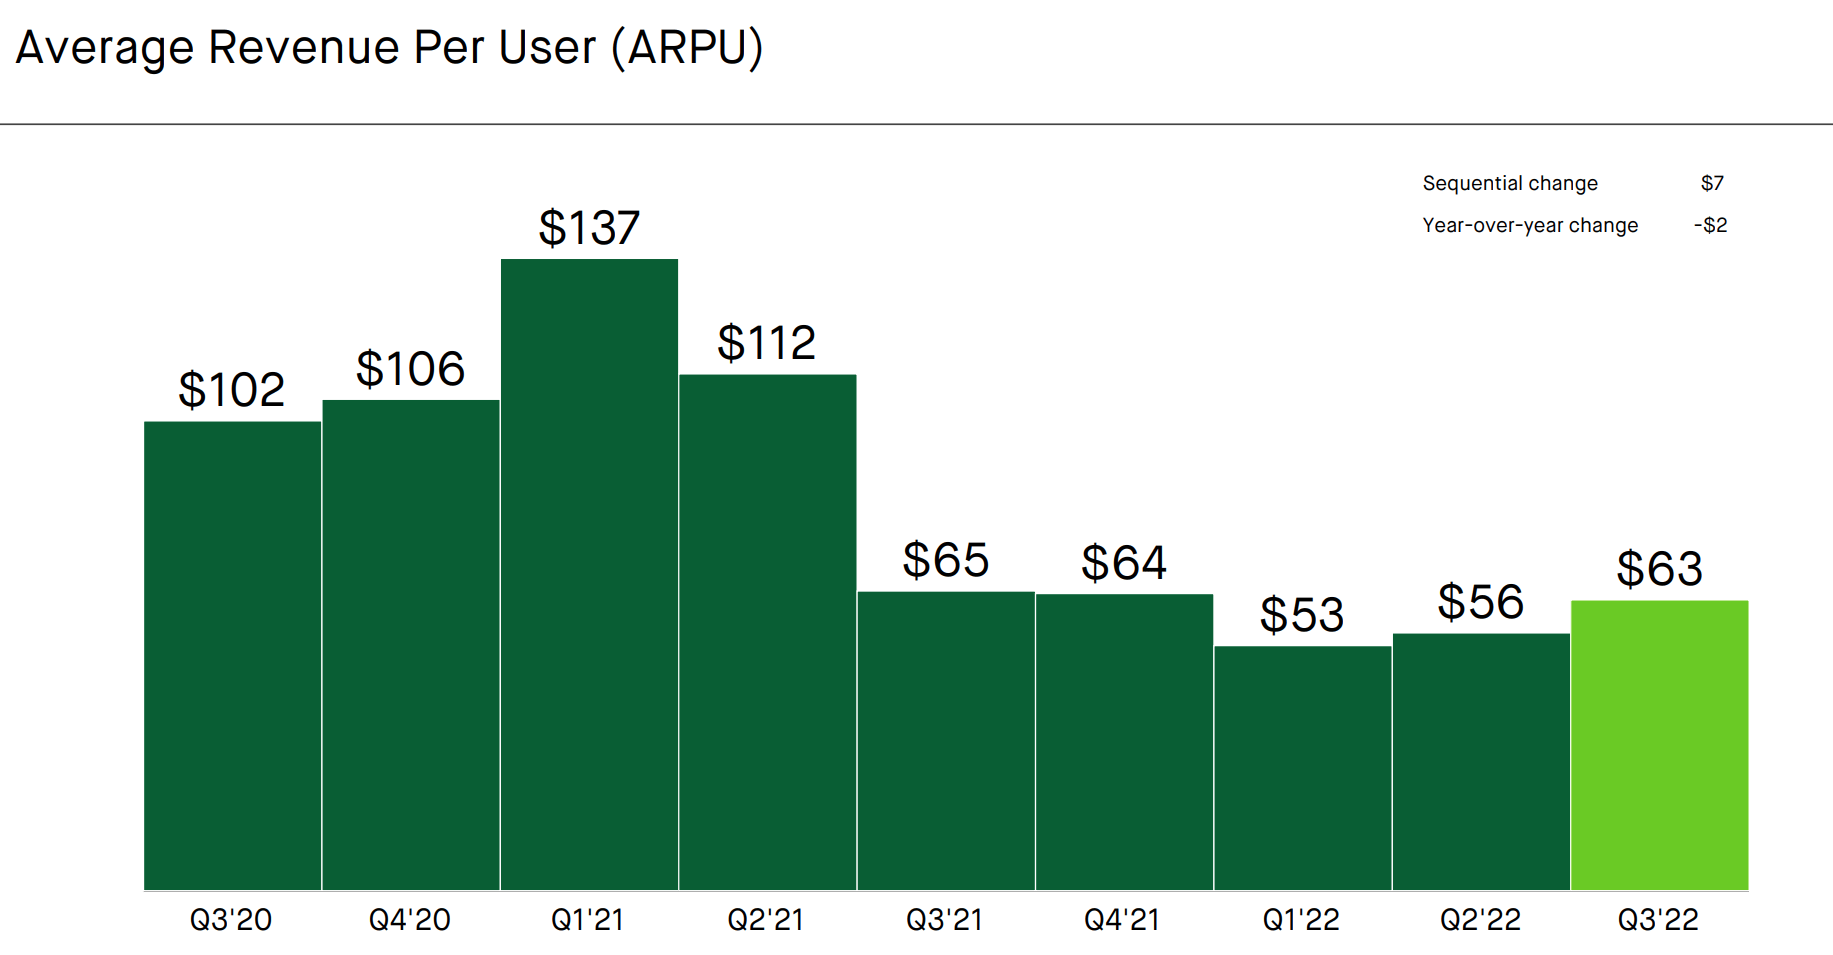
Profitability and Expenses
Robinhood reported strong earnings per share of -$0.20 which beat analyst expectations by $0.11. Net Losses have continued to narrow from negative $1.3 billion in Q3,21 to negative $175 million by Q3,22 which is a strong positive.
Net Income (Q3,22 report)
The profitability improvement has been driven by an 8% decline in Operating expenses which decreased from $464 million to $425 million. This was driven by lower operations and marketing expenses, as the company pulled back on unnecessary advertising spending. General and Administrative expenses did increase from $112 million to $151 million, up 35% year over year. Ideally overtime, I would like to see this metric declining as the business improves its efficiency at scale. Share-Based compensation has declined from an eye-watering $1.2 billion in Q3,21 to just $110 million which is a positive.
Operating Expenses (Q3,22)
Robinhood has a solid balance sheet with $6.2 billion in corporate cash. In addition to $3 billion in available lines of credit. This includes ~$2.5 billion of excess cash above financial “risk” scenarios. The strong cash position gives the company the ability to execute potential acquisition opportunities during this period of low company valuations. For extra information, Robinhood has $1.58 billion in Total Debt, which is well covered by the cash balance alone.
Balance Sheet (Q3,22 report)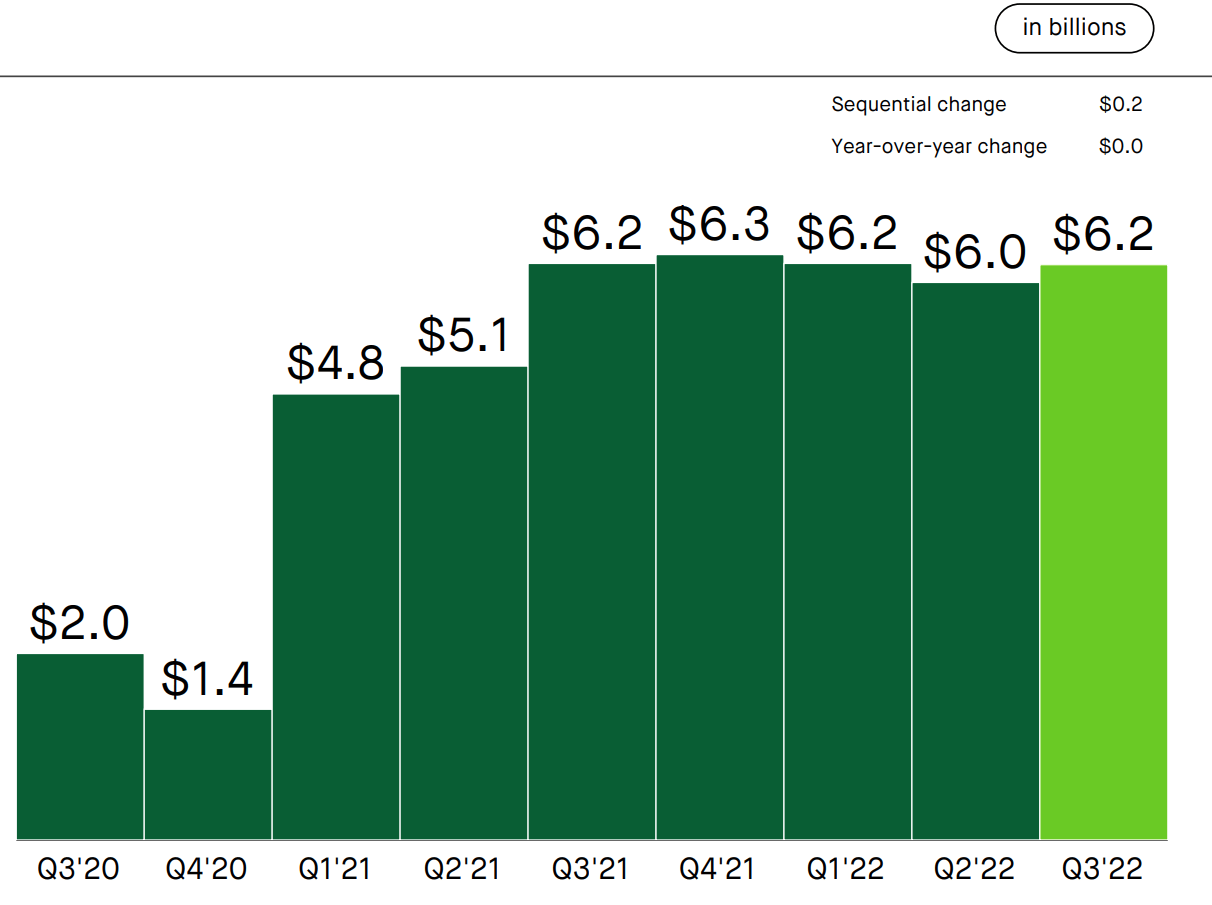
Advanced Valuation
In order to value Robinhood I have plugged the latest financials into my advanced valuation model which uses the discounted cash flow method of valuation. I have forecasted a conservative 10% revenue growth for next year and 20% over the next 2 to 5 years. This is contingent on this being the “bottom” of the decline in retail trading and we could start to see increased activity moving forward, especially given inflation is on a downward trend.
Robinhood stock valuation 1 (created by author Ben at Motivation 2 Invest)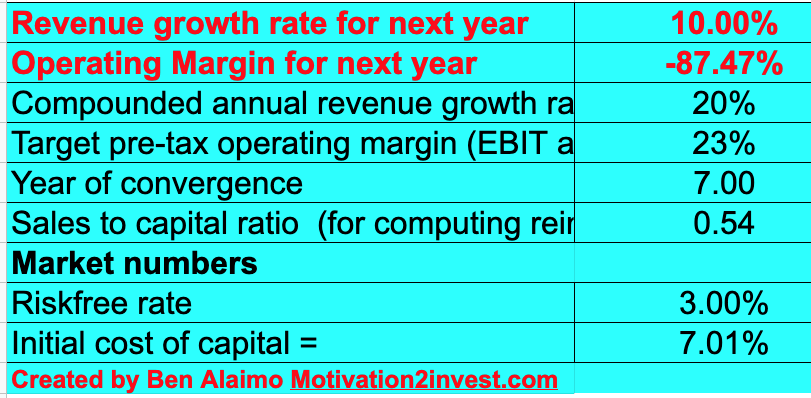
To increase the accuracy of the valuation I have capitalized the company’s R&D expenses. In addition, I have forecasted the business to continue to increase its operating margin to 23% over 7 years.
Robinhood stock valuation 1 (created by author Ben at Motivation 2 Invest)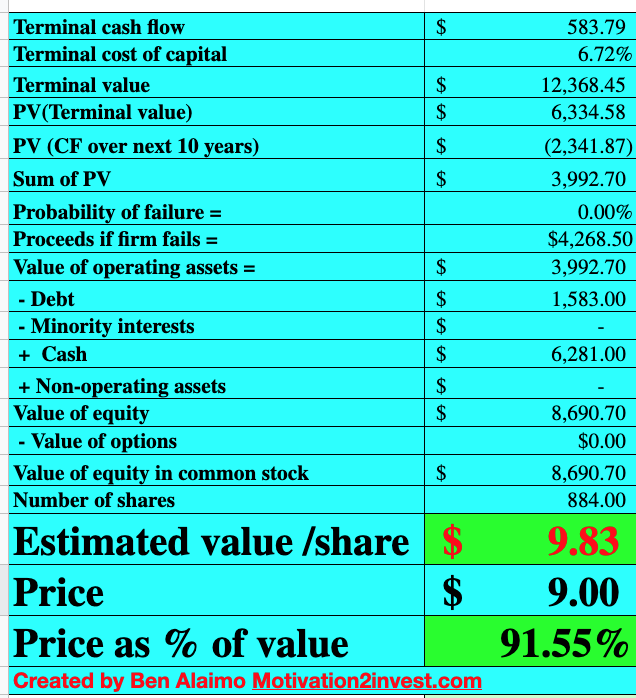
Given these factors I get a fair value of $9.83 per share, the stock is trading at $9 per share at the time of writing and is thus 7.5% undervalued.
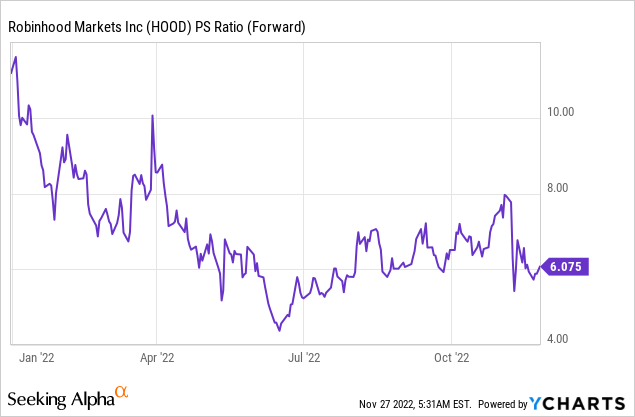
Robinhood also trades at a price-to-sales ratio = 6, which is significantly cheaper than historic levels.
Risks
Competition
Although Robinhood was a pioneer in “free trading”, it was quickly followed by many competitors which offered a similar solution. Today many fintech apps offer stock trading as an optional extra for example with Square’s cash app or Revolut in Europe. This means technically the business doesn’t really have a solid moat or barrier to entry for its business.
Recession/Low Trading Volume
The high inflation and rising interest rate environment has caused many analysts to forecast a recession. During this period consumers are often uncertain about job security and have experienced higher input costs. Therefore many have less excess cash and the right mindset to continue to trade in the market. This lower trading activity could last for at least another year, before the next bull market as the stock market has been cyclical in the past. For this to happen there needs to be a mindset shift from “fear” to “fear of missing out” which was prevalent in 2020.
Final Thoughts
Robinhood is a fantastic company which a strong brand and a solid technology platform. The company is currently facing headwinds from the tough macroeconomic environment but long term it has a chance of bouncing back. The stock is undervalued at the time of writing but my issue is really the competition in the space, therefore I will label the stock as a “hold” or “hodl” at this time.
Be the first to comment