

Csondy/E+ via Getty Images
First Quarter 2022 Performance Summary
|
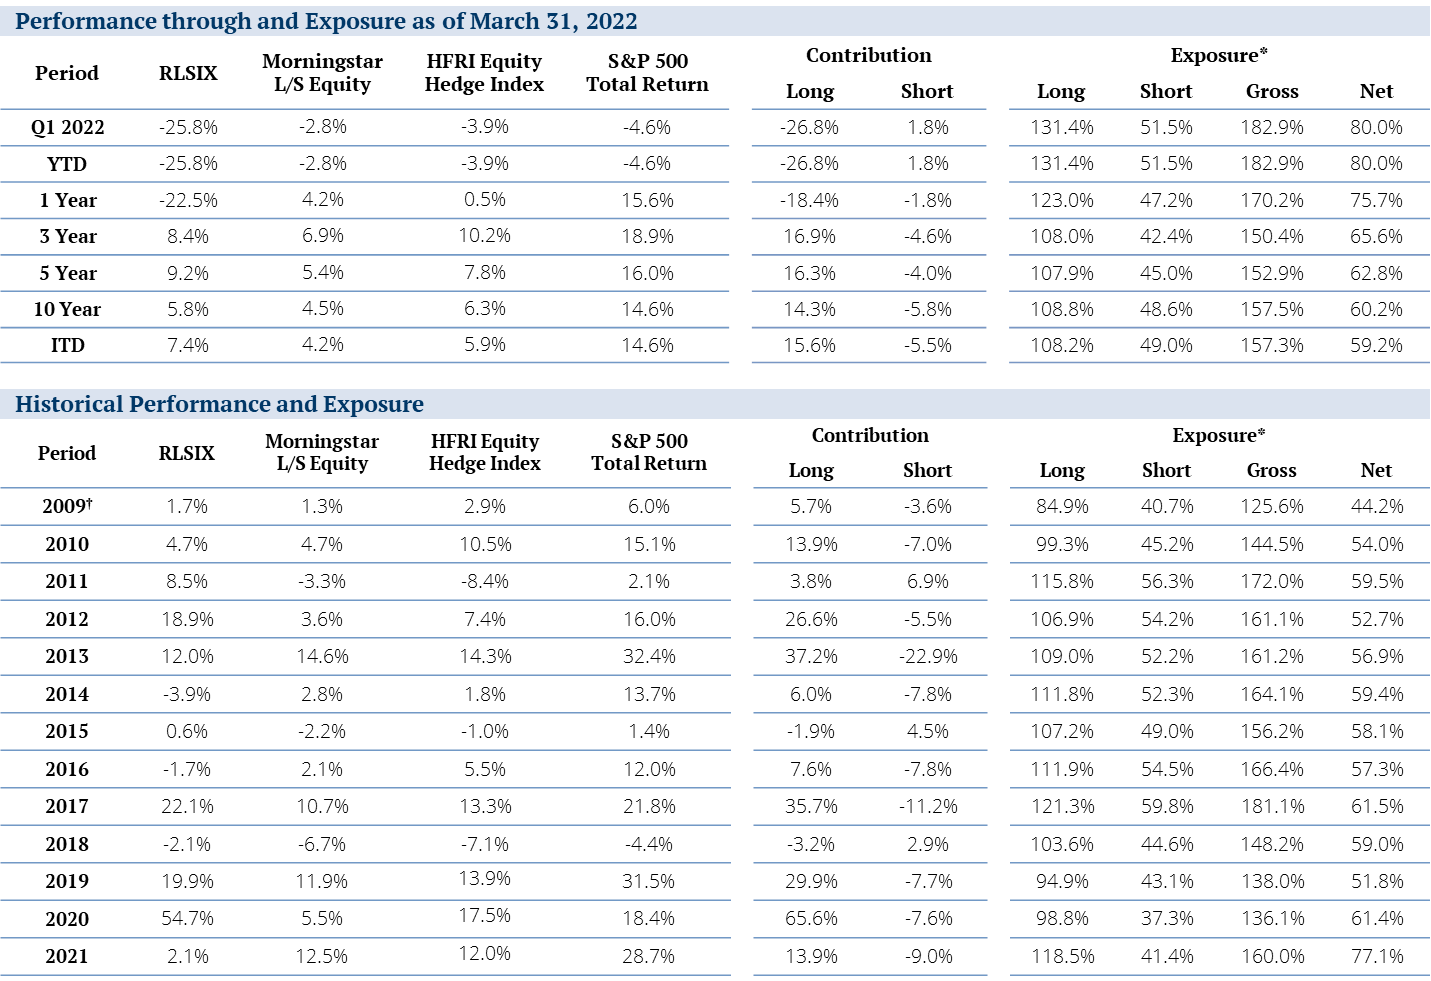
Performance: Net Returns as of March 31, 2022 |
||||||
|
Current Quarter |
One Year |
Three Year |
Five Year |
Ten Year |
Since Inception |
|
|
Institutional Shares (RLSIX) |
-25.78% |
-22.47% |
8.41% |
9.21% |
5.79% |
7.44% |
|
Retail Shares (RLSFX) |
-25.84% |
-22.65% |
8.14% |
8.96% |
5.58% |
7.27% |
|
Morningstar L/S Equity Category |
-2.75% |
4.24% |
6.90% |
5.35% |
4.51% |
4.18% |
|
HFRI Equity Hedge Index |
-3.86% |
0.53% |
10.19% |
7.83% |
6.34% |
5.94% |
|
S&P 500 Total Return Index |
-4.60% |
15.65% |
18.92% |
15.99% |
14.64% |
14.60% |
Annualized performance since inception of the Mutual Fund (3/30/2012) was 5.79% for RLSIX and 5.58% for RLSFX.
The performance quoted for periods prior to March 30, 2012 is that of RiverPark Opportunity Fund, LLC (the “Predecessor Fund”). The inception date of the Predecessor Fund was September 30, 2009. The performance of the Predecessor Fund includes the deduction of actual fees and expenses, which were higher than the fees and expenses charged to the Fund. Although the Fund is managed in a materially equivalent manner to its predecessor, the Predecessor Fund was not a registered mutual fund and was not subject to the same investment and tax restrictions as the Fund. Performance shown for periods of one year and greater are annualized.
Index performance returns do not reflect any management fees, transaction costs, or expenses. Indexes are unmanaged and one cannot invest directly in an Index. Morningstar L/S Equity Category Returns sourced from Morningstar Principia. HFRI Equity Hedge Index performance is sourced from Hedge Fund Research, Inc.
The performance quoted herein represents past performance. Past performance does not guarantee future results. The investment return and principal value of an investment will fluctuate so that an investor’s shares, when redeemed, may be worth more or less than their original cost, and current performance may be higher or lower than the performance quoted. For performance data current to the most recent month end, please call 888.564.4517.
Expense Ratio: Institutional: 1.73% gross and 1.73% net, Retail: 2.03% gross and 2.00% net as of the most recent prospectus, dated January 26, 2022. Gross Expense Ratio does not reflect the ability of the adviser to recover all or a portion of prior waivers, which would result in higher expenses for the investor. Please reference the prospectus for additional information.
Given the extreme volatility and our significant losses this quarter, we thought it best to lead off this quarter’s letter with two observations:
- Our current long book represents one of the most exciting groups of growth businesses that we have ever owned; and
- The portfolio trades at one of the widest gaps to intrinsic value that we have ever seen. Now, on to a more in-depth review of our recent performance.
The first quarter of 2022 was a difficult one for our fund. Over this year’s first three months, the Fund lost 25.8%, our worst quarterly period since inception and substantially worse than the more tepid declines suffered by the S&P 500 (down 4.6%) and most hedge funds (the Morningstar Long/Short Equity Category returned -2.8% while the HFRI Equity Hedge Fund Index posted a loss of 3.9% for the quarter).
This quarter continued a period of subpar performance from our long book that began in the middle of last year during which many emerging large cap growth firms have come under consistent and significant pressure. Although many of these companies were “COVID Winners” that helped propel strong results for the Fund in 2H20 (and remain amongst the most exciting growth businesses we own), investors have aggressively rotated away from these (and many other) high growth names in a “risk off” reaction to the current macro and geopolitical landscape.
Our short book provided very little protection this quarter (contribution only 1.8% to performance) as many of the larger cap and slow growth legacy incumbents that we prefer to short held up well over the last few months. While we did have some notable winners this quarter amongst our growthier shorts (including Carvana (CVNA), Lucid Group (LCID), and DraftKings (DKNG), down 44%, 34%, and 34%, respectively), prices throughout our short book reacted with substantially less volatility than our long book over the past few months.
Rather than follow the market’s so-called “de-risking” strategy, we “leaned in” to our higher growth long positions (in some cases materially) at what we believe to be generationally attractive prices. In addition, we brought several new high conviction research ideas out of our pantry and into the long portfolio at prices that we believe to be particularly compelling. This quarter, our new additions included long time growth leaders Netflix (NFLX) and Nvidia (NVDA), both of which were under substantial pressure during the quarter, as well as healthcare services firm Teladoc (TDOC), whose stock price had fallen precipitously from its mid COVID high. Each of these firms has long been on our watch list and we found each of their valuations particularly compelling during the recent downdraft. We mostly maintained our long exposure during the quarter, ending the period at 133.8% (down a bit from 140.4% at the end of the year but up from 116.5% at end of 3Q21 and 88.5% at year-end 2020) which remains near our high long exposure since inception.
To date, it is fair to say that this strategy has so far been costly as prices, in many instances, have weakened further. Nevertheless, we believe the prices at which we acquired our positions represent extremely attractive entry points that will, over time, provide substantial long-term returns. Given the impressive fundamentals throughout the long portfolio, our current long book now represents the highest revenue and earnings growth portfolio that we have owned since the fund’s inception in 2009. And, following this quarter’s sell-off, it also represents the most attractively valued portfolio we have ever owned relative to expected future earnings and free cash flow. This combination of price and value is what drives our confidence in this portion of our portfolio as it is not often that one gets to buy wonderful businesses at wonderful prices.
In our short book, we have closed out all our growthier shorts and have added incrementally to other positions (as well as adding in a few newer ones) to take advantage of higher relative valuations for many lower growth businesses that we believe will be challenged to grow in a post COVID world. These include several firms across the consumer-packaged goods landscape, the telecom/cable world and a cross section of low growth industrial and business services firms that we believe are all on the wrong side of the creative destruction divide. At quarter-end, our short exposure was a relatively normal (for us) 45.0%, down from 62.4% at year-end 2021, but up from an all-time low of 17.0% at year-end 2020.
All in, our gross and net exposures as of quarter-end tallied 178.8% (near our strategy high since inception) and 88.9% (also towards the higher end since inception), respectively.
While we are deeply disappointed by our recent losses, we believe that we are currently invested in an exceptional risk-reward portfolio and look forward to strong absolute and relative returns in the quarters to come. We believe that our long book owns a fantastic cross section of wonderful long-term secular winners now priced at generationally attractive prices while our short book remains fully invested against a full complement of individual stock positions in businesses where we believe the competitive destruction wave is building against them, yet valuations appear stretched. We believe we are well positioned throughout both portfolios for what we expect will be substantial gains on both sides in the months and years ahead.
Strategy Review
Given that, in most “normal” markets, it is rare to find many wonderful companies that trade at distressed prices, thoughtful long-term investors generally focus their long portfolio on one of two strategies – “deep value” or “high quality.”
“Deep value” investors typically focus on finding companies that trade at a wonderful price – at a price far below a “normal multiple” of the company’s earnings or net asset/book value. This strategy is built on the expectation that if a business and its stock price are both currently depressed, should the business find stability or recover, the multiple will move higher. Many of the staunchest of these investors would be more than happy to buy a cigar butt at a cheap price as long as it has a puff or two left in it.1
In contrast, “high quality” investors focus on finding wonderful companies and buying them at a reasonable price. Most of these investors define a wonderful company as one that is highly profitable, expertly managed and has a durable competitive advantage. 2 These investors have a distinct preference for investing in businesses with strong fundamentals and avoid those that are structurally unsound even if they are cheap by some metrics. “Quality” focused investors expect to generate strong compounding returns driven by the ever-growing piles of cash that the business generates rather than by simply selling at a higher valuation when/if the business reprices closer to its historical average. While this strategy may require a longer wait – the weight of the cash being generated by the business will eventually generate attractive returns and overcome any debate about valuation.3
Interestingly, when reflecting on this choice, many of the most famous and successful investors who started out in the “deep value” camp eventually gravitated to the “quality” team as they concluded that “A great business at a fair price is superior to a fair business at a great price.” 4
- Finding the really outstanding companies and staying with them through all the fluctuations of a gyrating market proved far more profitable to far more people than did the more colorful practice of trying to buy them cheap and sell them dear. – Phillip Fisher
- Observation over many years has taught us that the chief losses to investors come from the purchase of low-quality securities at times of favorable business conditions. – Benjamin Graham
- Quality matters, in businesses and in people. Better-quality businesses are more likely to grow and compound cash flow; low-quality businesses often erode and even superior managers, who are difficult to identify, attract, and retain, may not be enough to save them. – Seth Klarman
Occasionally, however, the best of all worlds for investing our long portfolio does arrive – where we have that rare chance to buy wonderful companies at wonderful prices.
Unfortunately, these moments are usually short-lived and often require that one act (or avoid reacting poorly and selling at a distressed price) when fear is raging across the world or in a particular segment of the market. Over just the past few years – terrorist attacks, banking crises and global pandemics certainly generated enough fear to cause even wonderful businesses to go “on sale.” As did the Dot Com sell-off, the Flash Crash, the LTCM unwind, the summer of Brexit and the last time the Fed embarked on a tightening cycle (4Q18). In fact, when using hindsight (which is always 20/20), one can find plenty of instances where you can look back and kick yourself for not buying (or buying more) of a wonderful business in the midst of a material sell-off (in the market as a whole or just in a specific sector or security) that went on to spectacular later returns – such as Amazon (AMZN) at a split-adjusted $1 (2002 after the Dot Com crash), Blackstone (BX) at $6 (in mid-2009 during the financial crisis) or Apple (AAPL) at $35 (in early 2018 following the last Fed tantrum).
We view the current carnage across our long book (and much of the NASDAQ) as offering a similar window of opportunity (that we do not expect to remain open for long) to own wonderful businesses that have been marked down to wonderful prices.
The current tantrum in the stocks of high growth companies has resulted from a series of investor macro concerns that we believe to be misplaced.
Interest Rates and Inflation – The primary culprit pressuring our long book in recent months has been the hyper-focus of traders and pundits on the “certainty” that inflation will stay elevated, that interest rates will rise significantly, and that this environment will be difficult for growth stocks, which should thus be sold. This narrative is based, in large part, on the financial theory that long duration assets – of which growth stocks are included – will see their multiples contract with rising rates. 5
Our belief is somewhat different.
Not only are we less sure that current trends will continue (we are more of the opinion that inflation rates will normalize over the next few quarters as Covid stimulus and supply chain disruptions dissipate), but we are also not convinced that these headwinds will predominantly impact growth stocks.
First, we believe that Info Tech and other growth stocks have been amongst the market’s biggest winners over the last 5-10 years because they led the economy – with market leading and exponential revenue and cash flow growth. That growth was driven by offering better and more convenient products and services at more competitive prices, not because of any macroeconomic factor or Fed policy. We believe that these businesses, and many of the younger and emerging franchises that we have recently acquired, will similarly lead the economy (and the stock market) for years to come (regardless of interest rates or macro trends) if they continue their market-share taking momentum. Secular trends and innovation driven growth have always been relatively immune to interest rate and business cycles. In fact, these trends and market share changes often accelerate during more challenging economic times.
It is also important to recognize that those companies with high demand products and services are the ones (and often the only ones) that can pass cost increases on to customers – as most innovative tech companies have already been doing for years given the ever-rising costs of tech talent over the past decade. If inflation does stay elevated, it is only those companies that are able to grow revenue and earnings well in excess of the rate of inflation that will allow investors’ capital returns to keep pace.6 Given these features, market leading secular growth companies have often emerged from past inflationary periods with more than enough incrementally higher revenue, earnings and cash flow growth to offset the impact of applying a higher discount rate to future cash flows. We believe this current environment will prove the same.
Conversely, it has been those slower growth companies facing secular headwinds, especially those with large debt balances, that suffer the most from inflationary pressures as they are unable to offset cost increases with higher prices (resulting in contracting margins). And, if levered with significant debt (as many mature, slow growth companies often are) these “price takers” also suffer earnings pressure from higher interest charges. To us, it is these companies that should be avoided in a higher inflation/higher rate environment, and this is where we have focused the majority of our short positions.
Ukraine. The geo-political uncertainty associated with the invasion of Ukraine, and its impact on humanity, is troublesome on many levels. However, not unlike COVID, we do not believe that most secular growth companies will be materially impacted by the disruption. Neither Russia, nor the Ukraine, represent significant end markets or parts of the supply chain for any of our businesses. And we don’t believe the war, even if it drags on, will have a significant long-term impact on the arc of technology and innovation adoption across our companies’ markets.
As distressing as the conflict in the Ukraine is, unless it morphs into something significantly more global, we are of the opinion that this conflict will not be particularly important in the revenue and earnings path of most businesses. 7
Recession. Many pundits now point to the threat of a recession in 2023 or sooner – an opinion we do not share. One should keep in mind, however, that recessions, like market corrections, are not abnormal; we assume every business we invest in will have to manage through one or more recessionary periods during our investment cycle. Secular growth companies generally power right through these periods as they often take even more market share in difficult economies than in thriving ones as customers more rapidly shed higher priced and less convenient products and services. Also, many of the businesses we own offer important “new staples” to their customers – the products and services the customers cannot live without. These include consumer facing businesses such as Amazon, Netflix, the social media companies, Apple, Google (GOOG), and Uber (UBER) as well as the new cloud software platforms such as Microsoft (MSFT), Adobe (ADBE), RingCentral (RNG), Twilio (TWLO) and Autodesk (ADSK). We believe that many consumers would likely look elsewhere for savings rather than turn off any of these services. Again, it is the legacy vendors of share losing products and services that are more at risk from a tougher economic backdrop, and this is where we have focused a portion of our short book.
Our Focus
Rather than focusing on the above (or other macro) topics – which we believe will all be old news in relatively short order – we have positioned both our long and our short portfolio to profit from a much different set of forces that we believe to be both structural and materially more powerful.
As highlighted in our recent letters, we continue to believe that we are in the midst of a generational shift in our economy and society driven by innovation and digital technologies. These are massive forces that are stimulating growth while at the same time accelerating productivity, increasing convenience, lowering costs, and causing the competitive destruction of the incumbents that fail to adapt. Importantly, these forces also have longer term deflationary impacts which had already been contributing to the very low inflation levels we have enjoyed for the past few decades (and is another reason we believe that the recent jump in prices will be short lived). We believe that all companies must embrace and adapt to these creative and destructive forces to survive, much less thrive.
It is our view that those who lead these transformations will take material market share from those that fail to adapt – and this has been the foundation for much of our research and investing focus for the past several years. It has been our strategy to own the winners and short the losers of this transition and we have, time and again, used market volatility to pivot into larger positions in (or short) those companies that we believe are on the right or the wrong side of creative destruction at increasingly attractive prices.
Wonderful Businesses
Despite the above market-wide concerns, and in stark contrast to the investment performance of our long book, the business fundamentals across this section of our portfolio have remained exceptional.
In nearly all cases across the portfolio, we raised our projections for longer term revenue and earnings growth and, most importantly, free cash flow generation following our companies’ latest earnings reports.8 According to our models, each of our longs are on a path to double-digit compounding revenue growth with expanding margins and substantial free cash generation over the coming 5-10 years – growth rates that we expect to be durable and sustainable. In addition, nearly all our portfolio companies also sport cash rich balance sheets with little if any net debt and impressive ratios of operating cash generation compared with expected cap ex needs. This means that these businesses are both self-funding and are, or will soon be, in a position to, among other things, return material amounts of excess cash to shareholders, especially if their shares remain depressed.9
In fact, we believe the majority (if not most) of our holdings are already – or will soon become “20 for 20s” – businesses that can grow in excess of 20% per year for at least 20 years. Over the course of time, it is these businesses that have generated the vast majority of each decade’s market-wide investment returns. Finding and owning them through their period of market dominance remains the “north star” of our investment process.
Below is a list of our current portfolio highlighting each company’s revenue growth over the past five years (which, across the portfolio averaged an impressive 33% compound annual rate) along with their most recent quarter’s growth (averaging 31% year over year) and the growth we expect for the next five years (averaging 21%, more than 5x the growth expected in the S&P 500).
|
Looking Forward: Revenue Growth |
2016-2021 Revenue CAGR |
4Q21 Revenue Growth |
2021-2026 Revenue CAGR |
|
SoFi Technologies Inc |
57% |
51% |
41% |
|
Shopify Inc |
64% |
41% |
36% |
|
Snap Inc |
59% |
42% |
36% |
|
Airbnb Inc |
24% |
78% |
33% |
|
Twilio Inc |
59% |
54% |
32% |
|
Block Inc |
50% |
47% |
28% |
|
RingCentral Inc |
33% |
34% |
27% |
|
Pinterest Inc |
54% |
20% |
26% |
|
Uber Technologies Inc |
35% |
83% |
26% |
|
Teladoc Health Inc |
75% |
45% |
25% |
|
NVIDIA Corp |
27% |
61% |
24% |
|
Farfetch Ltd |
56% |
23% |
24% |
|
ServiceNow Inc |
33% |
29% |
24% |
|
PayPal Holdings Inc |
19% |
13% |
20% |
|
Intuitive Surgical Inc |
16% |
17% |
19% |
|
Meta Platforms Inc |
34% |
20% |
18% |
|
Illumina Inc |
14% |
26% |
18% |
|
Exact Sciences Corp |
78% |
2% |
17% |
|
Zillow Group Inc |
20% |
10% |
17% |
|
Microsoft Corp |
13% |
21% |
17% |
|
Amazon.com Inc |
28% |
9% |
16% |
|
Netflix Inc |
27% |
16% |
16% |
|
Walt Disney Co/The |
4% |
26% |
15% |
|
Alphabet Inc |
23% |
32% |
14% |
|
Charles Schwab Corp/The |
20% |
13% |
14% |
|
Adobe Inc |
22% |
20% |
14% |
|
Mastercard Inc |
12% |
27% |
12% |
|
Autodesk Inc |
9% |
16% |
12% |
|
Apple Inc |
11% |
29% |
10% |
|
Blackstone Inc |
19% |
38% |
10% |
|
Portfolio Average: |
33% |
31% |
21% |
|
S&P 500 INDEX |
7% |
17% |
4% |
Note: For actuals, SoFi and Airbnb start with 2019 and 2017 revenue, respectively, due to limited reported financial histories; Block uses gross profit instead of revenue due to pass-through costs; Blackstone uses Fee-earning AUM; 2026 revenue uses RiverPark estimates.
In contrast, the vast majority of our short book is invested against businesses that average low single digit revenue growth. In most cases, these are businesses that have added significant debt in recent years through a combination of share repurchases and often poorly timed acquisitions in order to reposition for the future. Over time, it is these businesses that we believe are most at risk in both a rising inflation/interest rate landscape as well is in a more difficult.
Wonderful Prices
Even at peak prices for our fund during the middle of last year, our projections of company earnings and cash flows supported our hurdle of doubling our (and your) money in every holding within five years. At today’s lower prices across our long book, based on what are, in most cases, substantially higher earnings projections, we believe the returns from our long portfolio can be far greater.
While periods of downside volatility can certainly test one’s resolve, they also, invariably create amazing investment opportunities as many a baby is thrown out with the bathwater. Hence some of the markets most colorful expressions have come from those that have profited handsomely from ignoring the crowd and investing with a contrarian approach:
- Buy when there’s blood in the streets – Nathan Rothschild
- Buy on the cannons – John Neff
- The time of maximum pessimism is the best time to buy – John Templeton
- When “everyone” comes to the same conclusion, that conclusion is just about always wrong – David Dreman
We believe this to be one of those times where one should “be greedy when others are fearful.”10 Our current long portfolio on forward earnings trades at a substantial discount to the overall market’s valuation while offering substantially higher growth. In fact, a much larger than average portion of our long book currently trades at a single digit multiple of our estimate for 2027 earnings (we generally use earnings 4-5 years out to calculate whether we can conservatively make a double) for businesses that we still believe to be very early in their growth stages. If we are even close to correct in our analysis of these companies’ earnings potential, the returns from their stocks from current levels should be significant.
| Looking Forward: 2027 PE Estimates |
Current Price/2027 EPS |
|
SoFi Technologies Inc |
4.5 |
|
RingCentral Inc |
5.3 |
|
Meta Platforms Inc |
5.7 |
|
Pinterest Inc |
6.0 |
|
Farfetch Ltd |
6.4 |
|
Snap Inc |
6.5 |
|
PayPal Holdings Inc |
8.0 |
|
Alphabet Inc |
8.5 |
|
Blackstone Inc |
8.6 |
|
Zillow Group Inc |
8.8 |
|
Charles Schwab Corp/The |
9.1 |
|
Apple Inc |
9.1 |
|
Walt Disney Co/The |
9.7 |
|
Uber Technologies Inc |
10.1 |
|
Netflix Inc |
10.7 |
|
Mastercard Inc |
11.8 |
|
Airbnb Inc |
11.8 |
|
Twilio Inc |
12.0 |
|
Teladoc Health Inc |
13.1 |
|
Adobe Inc |
13.3 |
|
Amazon.com Inc |
13.8 |
|
Microsoft Corp |
14.2 |
|
ServiceNow Inc |
15.6 |
|
Illumina Inc |
16.6 |
|
NVIDIA Corp |
16.8 |
|
Shopify Inc |
17.7 |
|
Intuitive Surgical Inc |
18.3 |
|
Autodesk Inc |
20.1 |
|
Block Inc |
20.7 |
|
Exact Sciences Corp |
24.6 |
|
Portfolio Average: |
11.9 |
|
S&P 500 INDEX |
14.1 |
Note: Price as of 3/31/2022; 2027 EPS uses RiverPark estimates.
Again, in contrast, most of our short book currently trades in line or at a premium to the broader market as a whole for what we believe to be a substantially below average group of businesses. We also believe that this is precisely the group of firms most likely to report earnings and revenue disappointments, which will surely be blamed on the current macro landscape. While this group of businesses has held up well in what has proved to be a resilient broader market, we believe the downside risk (and therefore profit potential) from our short portfolio can be significant in the quarters to come.
In sum, while we are always disturbed by any significant mark-to-market losses, we believe we own wonderful businesses at what are now wonderful prices while maintaining a relatively full short book of those businesses most at risk of secular declines. We, thus, believe our Long/Short strategy is particularly well positioned for this emerging landscape with substantial opportunity for gains on both sides of our portfolio in the months and years ahead.
New Long Positions
Netflix is the global streaming TV leader and is more than twice the size of each of Hulu, Amazon Prime Video and Disney+. And yet, with an estimated 800 million+ global pay-tv subscribers (excluding China) yet to adopt streaming, we believe Netflix still has a large runway for continued subscriber growth. In addition to its growth opportunities in traditional TV and movie streaming, the company also recently launched a mobile gaming service that opens an additional $100 billion-plus market for future growth. Netflix has spent over a decade building its global footprint of subscribers as well as its now deep library of both global and local content and is now transitioning to accelerating it margins and free cash flow generation.
We believe that 2022 is an inflection year for Netflix as management has stated that the company should finally become and then remain FCF positive for the foreseeable future. A combination of price increases and a stabilization of content investments should position the company to continue its mid-teens annual revenue growth while driving improved operating margin to north of 30% over the next few years (revenue grew 19% for 2021 and operating margin was 21%, up from 10% in 2018). We also believe that the stabilization of content spend should allow the company to materially scale its annual free cash flow (which can be used to retire debt, accelerate growth and/or return to shareholders). We took advantage of the over 50% drop in the company’s shares over the last several months to initiate a small position in this world class innovative growth leader.
Nvidia is the leading designer of graphics processing chips (commonly known as GPU’s- graphics processing units), required for powerful computer processing. Over the past 20 years, the company has evolved through innovation and adaptation from a predominantly gaming- focused chip vendor to one of the largest semiconductor/software vendors in the world, dominating the core secular growth markets of gaming, data centers and professional visualization. Over the past decade, the company has grown revenue at a compound annual rate of over 20% while expanding operating margins and, through its asset light business model, producing ever increasing amounts of free cash flow. For 2021 the company generated 61% revenue growth to $27 billion, expanded its EBITDA margins to over 44% and generated over $8 billion of free cash flow. Over the past five years, the company has generated a cumulative $23 billion of FCF after cumulative capital expenditures of less than $4 billion.
We expect future growth to remain robust as NVDA chips and software are critical to many of the core technologies being adopted globally, including cloud computing, virtual reality and advanced artificial intelligence. As with NFLX, we took advantage of the over 40% recent drop in the company’s shares over the last several months to initiate a small position.
Teladoc is the largest telehealth provider in the US and has recently begun to expand internationally. TDOC’s platform enables an ever-expanding list of patient-doctor interactions (including those for primary health care, mental health issues and chronic condition management) to transition from an on-site visit to one that can be done remotely with full video- based interaction. TDOC provides its platform of services on both a business-to-business and direct-to-consumer basis, through monthly subscription-based relationships. For its core business-to-business clients, the company contracts with a wide range of entities, including large scale employers (the company currently contracts with over 50% of the Fortune 500), health plans, health systems, and medical insurance companies, which currently cover more than 50 million members. For these customers, the company provides a win-win-win, as patients spend no time traveling and less time waiting, doctors are more efficient seeing more patients in less time, and payers (employers and plan sponsors) save money while being able to offer a highly popular additional benefit for their employees. This B to B market is projected to be a +$100 billion market opportunity and TDOC is the clear global market leader. For its direct-to- consumer clients, the company provides a growing suite of services for individuals to have affordable access to on-demand and scheduled medical services, for which their current insurance does not provide reimbursement (such as extended mental health counseling).
Although the company has been growing steadily for well over a decade, the business has transformed over the past few years as the COVID pandemic caused a significant increase in the demand for virtual healthcare. In addition, the company’s 2020 acquisitions of Livongo, the leader in virtual chronic condition management, and InTouch a competitive telehealth platform, materially broadened the company’s product offerings. At its recent analyst day, management guided to 25-30% top line growth for each of the next three years, exiting 2024 with more than $4 billion in annual revenue. The company also anticipates expanding margins by 100-150 basis points per year in each of the next three years, while still accelerating its investments in marketing and R&D. As with many of our recent purchases, we took advantage of the decline in the company’s shares (down a breathtaking 70% from its 2021 high of almost $300 per share) to establish a small position in Teladoc.
Portfolio Review
|
Top Contributors to Performance for the Quarter Ended March 31, 2022 |
Percent Impact |
|
|
Carvana Co. (short) |
0.54% |
|
|
Lucid Group, Inc. (short) |
0.38% |
|
|
NVIDIA Corp. (long) |
0.37% |
|
|
Edgewell Personal Care Co. (short) |
0.32% |
|
|
Lumen Technologies, Inc. (short) |
0.29% |
Portfolio Attribution is produced by RiverPark Advisors, LLC (RiverPark), the Fund’s adviser. Although RiverPark believes that its attribution methodology adheres to generally accepted standards in the industry, attribution analysis is not an exact science and different methodologies may produce different results.
Performance Attribution is shown gross of fees. Holdings are subject to change.
|
Top Detractors From Performance for the Quarter Ended March 31, 2022 |
Percent Impact |
|
|
RingCentral, Inc. (long) |
-2.56% |
|
|
Farfetch Limited (long) |
-2.50% |
|
|
SoFi Technologies, Inc. (long) |
-2.26% |
|
|
Meta Platforms, Inc. (long) |
-2.20% |
|
|
Shopify Inc. (long) |
-1.98% |
Portfolio Attribution is produced by RiverPark Advisors, LLC (RiverPark), the Fund’s adviser. Although RiverPark believes that its attribution methodology adheres to generally accepted standards in the industry, attribution analysis is not an exact science and different methodologies may produce different results.
Performance Attribution is shown gross of fees. Holdings are subject to change.
Top Ten Long Holdings
Below is a list of our top ten long holdings as of the end of the quarter:
|
Holdings |
Percent of Net Assets |
|
|
Blackstone Inc. |
7.4% |
|
|
Alphabet Inc. |
7.0% |
|
|
Uber Technologies, Inc. |
6.9% |
|
|
Apple Inc. |
6.8% |
|
|
Amazon.com, Inc. |
6.8% |
|
|
Microsoft Corp. |
6.5% |
|
|
Snap Inc. |
6.2% |
|
|
The Charles Schwab Corp. |
6.1% |
|
|
RingCentral, Inc. |
5.4% |
|
|
Meta Platforms, Inc. |
5.4% |
|
|
64.4% |
Holdings subject to change.
Below is a list of the key secular themes represented on both sides of our portfolio as of the end of the quarter.
|
Long Portfolio Themes |
Short Portfolio Themes |
|||
|
Application Software |
Industrials |
|||
|
Innovative Healthcare |
Consumer Packaged Goods – Food |
|||
|
Social Media |
Telecom/Cable |
|||
|
E-Commerce |
Traditional Media |
|||
|
Payments |
Consumer Packaged Goods – Household |
|||
|
Online Bank/Brokerage |
Legacy Consumer |
|||
|
Travel/Rides |
Global Gaming |
|||
|
Operating System Software |
Flawed Technology |
|||
|
Alternative Asset Management |
Big Box Retail |
|||
|
Search/YouTube |
||||
|
Mobile Compute |
||||
|
Media |
||||
|
Real Estate Ads and Services |
||||
|
Semiconductors |
This is a representative (non-exhaustive) list of our largest current long and short themes. Holdings subject to change.
Summary
We continue to believe that our secular-themed long/short portfolio is well positioned to generate strong absolute and relative performance in the years to come. We will continue to keep you apprised of our process and portfolio holdings in these letters each quarter. As always, please do not hesitate to contact us if you have any questions or comments about anything we have written or about any of our funds.
We thank you for your interest in the RiverPark Long/Short Opportunity Fund.
Sincerely,
Mitch Rubin
Portfolio Manager and Chief Investment Officer
† Inception date of the Fund was September 30, 2009.
Annualized performance since inception of the Mutual Fund (3/30/12) was 5.8% for RLSIX.
The performance quoted herein represents past performance. Past performance does not guarantee future results.
The performance quoted for periods prior to March 30, 2012 is that of RiverPark Opportunity Fund, LLC (the “Predecessor Fund”). The inception date of the Predecessor Fund was September 30, 2009. The performance of the Predecessor Fund includes the deduction of actual fees and expenses, which were higher than the fees and expenses charged to the Fund. Although the Fund is managed in a materially equivalent manner to its predecessor, the Predecessor Fund was not a registered mutual fund and was not subject to the same investment and tax restrictions as the Fund.
The Contribution numbers set forth above are produced by RiverPark Advisors, LLC (RiverPark), the Fund’s adviser, in accordance with generally accepted standards in the industry. The calculation of contribution is not an exact science and different methodologies may produce different results
* Where applicable, the exposures are delta-adjusted and are computed by averaging the exposures of each month-end within each period.
Footnotes
1 “If you buy a stock at a sufficiently low price, there will usually be some hiccup in the fortunes of the business that gives you a chance to unload at a decent profit, even though the long-term performance of the business may be terrible. I call this the “cigar butt” approach to investing. A cigar butt found on the street that has only one puff left in it may not offer much of a smoke, but the “bargain purchase” will make that puff all profit.” Warren Buffett’s 1989 Shareholder Letter.
2 A wonderful company is not necessarily a growth company – as Buffet has described, a stable company such as See’s Candy, with strong free cash generation and little capital needs that can sustain it free cash generation for a very long time can also be truly “wonderful.”
3 In Ben Graham’s timeless example, this is the weighing machine (in contrast to the near-term voting machine) that ultimately produces the value of an investment in the long run.
4 Charlie Munger. Warren Buffett has time and again credited his partner Munger with shifting Berkshire’s focus from cigar butts to great businesses.
5 Notably, recent data does not support this theory as in three of the last for rate-hiking campaigns since the 1990s, growth stocks outperformed. In fact, more than a few analysts that have studied the data (going back 150 years!) have concluded, as did a recent Bloomberg article, that “there’s no reliable relationship between the level of interest rates and how much investors are willing to pay for stocks.” Bloomberg, April 5, 2022
6 A further feature of our companies, and many of today’s leading growth firms is that they also have substantial excess cash balances – in a higher rate environment, these balances produce a substantial cost-free earnings benefit in the form of increasing interest income from a rising rate environment.
7 We also note that energy costs are not of paramount significance to most of our companies. In addition, we expect currently elevated energy prices to level off and retreat as global supply ramps up to replace the disruption from the Russia/Ukraine conflict. We also note that, even in the 2011-2014 period, the last time energy prices remained stubbornly elevated, inflation remained relatively low throughout that period, growth stocks performed extremely well and a demand induced production boom sent energy prices plummeting back down relatively quickly.
8 With the notable exceptions of PayPal and Facebook, where, although we were disappointed by near term execution and guidance, we continue to believe that the long term growth potential for both firms remains exceptional and that their management teams are skilled and focused on the problems at hand.
9 Several, including Amazon, Google, Apple, Meta and Zillow have been executing and/or have recently increased share repurchase authorizations.
10 Warren Buffet – Berkshire Hathaway 1986 letter.
Editor’s Note: The summary bullets for this article were chosen by Seeking Alpha editors.
Be the first to comment