

Shana Novak
In this analysis of Revolve Group, Inc. (NYSE:RVLV), we covered the company following its strong Q2 2022 with revenue growth of 26.9%. We analyzed the top U.S. e-commerce companies’ performance in Q2 and compared it with Revolve. Moreover, we analyzed the company’s growth based on active customers, purchase frequency, and sales per order to determine its growth drivers supporting its robust growth.
Oversold Relative To E-commerce Market Competitors
|
Company |
Revenue Market Share (Q2 2022) |
Revenue YoY Growth % (Q2 2022) |
Revenue Growth QoQ % (Q2 2022) |
Analyst Consensus Difference (Q2 2022) |
Stock Price Change (Q2 2022) |
|
Amazon (AMZN) |
30.41% |
-0.01% |
2.31% |
1.76% |
-33.83% |
|
eBay (EBAY) |
0.94% |
-9.22% |
-2.46% |
2.54% |
-26.06% |
|
Etsy (ETSY) |
0.23% |
10.63% |
1.00% |
5.07% |
-41.13% |
|
Wayfair (W) |
1.28% |
-14.87% |
9.72% |
2.82% |
-56.65% |
|
Qurate (QRTEA) |
1.15% |
-15.72% |
2.43% |
-0.67% |
-38.65% |
|
Chewy (CHWY) |
0.94% |
12.81% |
0.11% |
-0.82% |
-13.66% |
|
Overstock (OSTK) |
0.21% |
-33.53% |
-1.47% |
-12.09% |
-36.78% |
|
Stitch Fix (SFIX) |
0.19% |
-15.63% |
-2.05% |
-1.41% |
-47.41% |
|
1-800-Flowers (FLWS) |
0.19% |
-0.23% |
3.47% |
-0.19% |
-23.27% |
|
Revolve |
0.11% |
26.90% |
2.33% |
-0.97% |
-49.46% |
|
Average |
3.56% |
-3.89% |
1.54% |
-0.40% |
-36.69% |
Source: Company Data, SeekingAlpha, Khaveen Investments
Based on the above table, the average revenue growth YoY in Q2 2022 for the top 10 US e-commerce companies was -3.89%. Only 3 companies had positive growth, which were Etsy (10.6%), Chewy (12.8%) and Revolve (26.9%). The worst-performing company was Overstock whose revenues declined by 33.5% in Q2 2022.
In terms of analyst consensus, 4 companies surpassed expectations which were Amazon, eBay, Etsy and Wayfair. Etsy is the only company that had positive growth and beat analyst consensus. On the other hand, Revolve’s revenue was in line with analyst consensus, with a difference of only -0.97%. Though, the average consensus difference was -0.4%. While the e-commerce companies performed negatively, the average stock price change in Q2 was -36.7% which is lower than the average revenue growth decline of -3.9%.
Overall, within the top e-commerce companies in the U.S., the average revenue growth was negative at -3.89% in Q2 2022. However, all companies’ stock prices had declined including Revolve. Based on its performance in Q2, Revolve had the highest revenue growth of 26.9% YoY and was in line with analyst expectations with a difference of only -0.4% with revenue consensus. Thus, we believe its stock price decline of 49.46% is not justified relative to the higher average stock decline of 36.69%.
Down Despite Highest Growth Among Fashion And Apparel Competitors
|
Company |
Revenue YoY Growth % (Q2 2022) |
Revenue Growth QoQ % (Q2 2022) |
Analyst Consensus Difference (Q2 2022) |
Stock Price Change (Q2 2022) |
|
Revolve |
26.90% |
2.33% |
-0.97% |
-49.46% |
|
Stitch Fix |
-15.63% |
-2.05% |
-1.41% |
-47.41% |
|
Farfetch (FTCH) |
10.70% |
12.53% |
2.26% |
-51.87% |
|
ASOS (OTCPK:ASOMF) |
-2.33% |
0.86% |
-0.93% |
-61.81% |
|
Average |
4.91% |
3.42% |
-0.26% |
-52.64% |
Source: Company Data, SeekingAlpha, Khaveen Investments
Furthermore, among the U.S. fashion and apparel e-commerce competitors in the table, Revolve’s growth was better than the average of 4.9% YoY in Q2 2022. However, its revenue growth difference to consensus is slightly lower than the average of -0.26%. Though, its stock price was better than the average change of -52.6%. In comparison, Farfetch had superior revenue growth that was above the average and surpassed analyst consensus while its stock price change was above average.
Overall, Revolve’s Q2 revenue growth YoY was the highest among competitors at 26.9%, above the average of 4.91%. Besides Revolve, only Farfetch had positive growth in Q2 2022 YoY. Although its revenue growth on a quarterly basis was slightly lower than the average and its difference to analyst consensus also lower than average, we believe its stock price decline of 49.46% is relatively high when comparing its robust revenue growth YoY.
Revenue Growth Slows As Orders Per Customer Growth Slows
To determine the key growth drivers of the company, we analyzed its breakdown by customers, orders per customer and sales per order.
|
Revolve |
Q1 2021 |
Q2 2021 |
Q3 2021 |
Q4 2021 |
Q1 2022 |
Q2 2022 |
|
Active Customers (‘000s) |
1,477 |
1,554 |
1,678 |
1,840 |
2,041 |
2,165 |
|
Growth % (YoY) |
-3% |
1% |
12% |
44% |
38% |
39% |
|
Active Customer Increase |
(51) |
21 |
174 |
558 |
564 |
611 |
|
Orders per Customer |
0.87 |
1.14 |
1.09 |
0.95 |
1.06 |
1.04 |
|
Growth % (YoY) |
13% |
50% |
44% |
20% |
22% |
-9% |
|
Sales per order |
139.5 |
129.2 |
133.4 |
136.6 |
131.5 |
129.3 |
|
Growth % (YoY) |
12% |
5% |
1% |
-1% |
-6% |
0% |
|
Revenue ($ mln) |
178.9 |
228.6 |
244.1 |
239.8 |
283.5 |
290.1 |
|
Growth |
22% |
60% |
62% |
70% |
58% |
27% |
Source: Revolve, Khaveen Investments
Based on the table above, Revolve’s revenue grew strongly at 27% YoY in Q2 2022. This was driven by its active customer growth of 39% YoY. Its active customers grew by 611,000 compared to the previous year’s quarter. Its active customer growth had accelerated since Q3 2021. Based on management in its earnings briefing, the company highlighted the pandemic recovery for its growth.
Now as we think about the quarter, we were able to deliver strong double-digit growth in an environment that became increasingly challenging as the quarter progressed. Taking it a level deeper, our product category trends for the second quarter confirmed that our core Revolve customer was getting out again in force, driving incredible growth in dresses with particular strength in special event styling. She is traveling, going to wedding and living their life to the fullest begin. For these truly special occasions in life, Revolvers as the trusted source for integration and our go-to fashion destination. The reopening this year has been most evident in the Revolve segment, where net sales increased 30% year-over-year in the second quarter despite international headwinds. – Michael Mente, Co-Founder, Co-Chief Executive Officer & Director
However, the company’s orders per customer growth declined by 9% in the quarter while sales per order growth were flat. Its sales per order growth declined due to its total order placed growing by only 26.8% compared to its active customer growth of 39% YoY. Thus, we believe this could be due to new customers purchasing less than existing customers of Revolve. According to its latest earnings briefing, management explained that revenue per client increased over time.
This data is quite encouraging, considering that new customer growth has been really healthy for the past several quarters, and that revenue per customer tends to increase significantly over time. Consider that in 2021, customers who had purchased from Revolve in a previous year represented 49% of our total active customers for the year, yet these more tenured customers generated 77% of total net sales for the year. – Mike Karanikolas, Co-Founder, Co-Chief Executive Officer & Chairman of the Board
|
Revolve Projections |
2017 |
2018 |
2019 |
2020 |
2021 |
2022F |
2023F |
2024F |
Average |
|
Active Customers (‘000s) |
842 |
1,175 |
1,488 |
1,472 |
1,840 |
2,413 |
2,639 |
2,864 |
|
|
Growth |
18% |
40% |
27% |
-1% |
25% |
31% |
9% |
9% |
22% |
|
Active Customer Increase |
130 |
333 |
313 |
(16) |
368 |
573 |
226 |
226 |
|
|
Orders per Customer |
3.03 |
3.16 |
3.17 |
3.06 |
3.61 |
3.80 |
4.01 |
4.22 |
|
|
Growth |
8% |
4% |
0% |
-4% |
18% |
5% |
5% |
5% |
5% |
|
Sales per order |
156.6 |
134.4 |
127.5 |
129.1 |
134.3 |
130.65 |
127.07 |
123.58 |
|
|
Growth % |
0% |
-14% |
-5% |
1% |
4% |
-3% |
-3% |
-3% |
-3% |
|
Revenue ($ mln) |
399.6 |
498.7 |
601 |
580.6 |
891.4 |
1,198 |
1,343 |
1,494 |
|
|
Growth |
28% |
25% |
21% |
-3% |
54% |
34% |
12% |
11% |
25% |
Source: Revolve, Khaveen Investments
We projected the company’s customer growth in 2022 with Q3 and Q4 based on Q2 customer additions of 124 mln for a total customer increase of 573 mln in 2022. Moreover, we projected its customer additions beyond 2022 based on its 5-year average of 226 mln which is a growth rate of only 9% in 2023. Factoring in its orders per customer and sales per order growth based on a 5-year average, we projected its revenue growth in 2022 to be 34% but to slow to 12% in 2023.
Risk: High Product Return Rate
We believe one of the risks of the company is its high product return rate or refunds. According to the company’s annual report, its average order value in 2021 was $271 which is lower compared to its net sales per order of $134.30. Furthermore, the company highlighted its hassle-free returns in its international markets which resulted in higher return rates. Thus, we believe its high return rates could pose a risk to its revenue growth.
One of the primary drivers of the higher return rate compared to pre-COVID levels is a fast-growing percentage of our international net sales coming from countries like Canada, where we offer hassle-free returns a major growth catalyst that has resulted in Canada net sales quadrupling in just the past 6 quarters. – Mike Karanikolas, Co-Founder, Co-Chief Executive Officer & Chairman of the Board
Verdict
Overall, the e-commerce market had average revenue growth of -3.89% among the top 10 companies but Revolve grew by 26.9% YoY. Still, we believe its stock price performance of -49% is unjustified relative to the market decline of an average of 36.69%. Similarly compared with competitors, we believe its stock performance compared to fashion and apparel competitors also does not reflect its strong growth. However, we expect its growth rate to decline beyond 2022 and projected its growth at 12% in 2023.
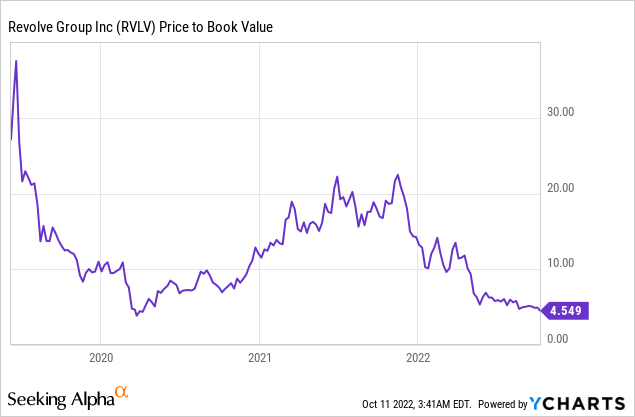
Based on the analyst consensus price target of $31.19, we rate the company as a Strong Buy with an upside of 41% as its stock price had declined by 61% YTD and its stock price at a P/B of 4.5x below its 5-year average of 12.2x.
Be the first to comment