

Igor Vershinsky/iStock via Getty Images
When it comes to the vehicle market, there are a number of large players out there. But at the same time, there are also some small companies that focus on niche offerings. One example of this is a company called REV Group (NYSE:REVG). Despite experiencing significant volatility late last year and after seeing a rather soft first quarter for its 2022 fiscal year, the company believes that 2022 as a whole will still end up fairly robust in the grand scheme of things. Even though the company has seen its share price rise nicely in recent months, leading to shares being priced at levels that are higher than they were previously, the enterprise still appears to be trading at fairly cheap levels. Because of this, while I do believe that the easy money has certainly been made, I would make the case that the business probably does have further upside potential moving forward.
A soft quarter will lead to a solid year
For those who might not remember, REV Group focuses on the production and sale of specialty vehicles, particularly those centered around the fire and emergency categories. Its products include ambulances, rescue vehicles, pumpers, lifts, and more. The last time I wrote about the company was in an article published in December of 2021. This followed a one-day drop in the company’s share price in the amount of 25.5% after missing guidance for the fourth quarter of its 2021 fiscal year. In that article, I made the case that the company was trading on the cheap and that management had overseen operational improvements and increased sales year over year. At the end of the day, I still decided to rate the company a ‘buy’ prospect, believing that growth would continue moving forward. Since then, I have found myself pleasantly surprised. While the S&P 500 has experienced a drop of 3.9% since the publication of the article, shares of REV Group have returned for investors a profit of 16.7%.
Interestingly, the decline in share price the company experienced did not repeat itself when, earlier this year, management reported financial results covering the first quarter of the company’s 2022 fiscal year. This came in spite of the fact that the business did report some weakness year over year. For instance, revenue in that quarter came in at $537 million. That represents a year-over-year decline of 3.1% compared to the $554 million generated in the first quarter of its 2021 fiscal year.
Author – SEC EDGAR Data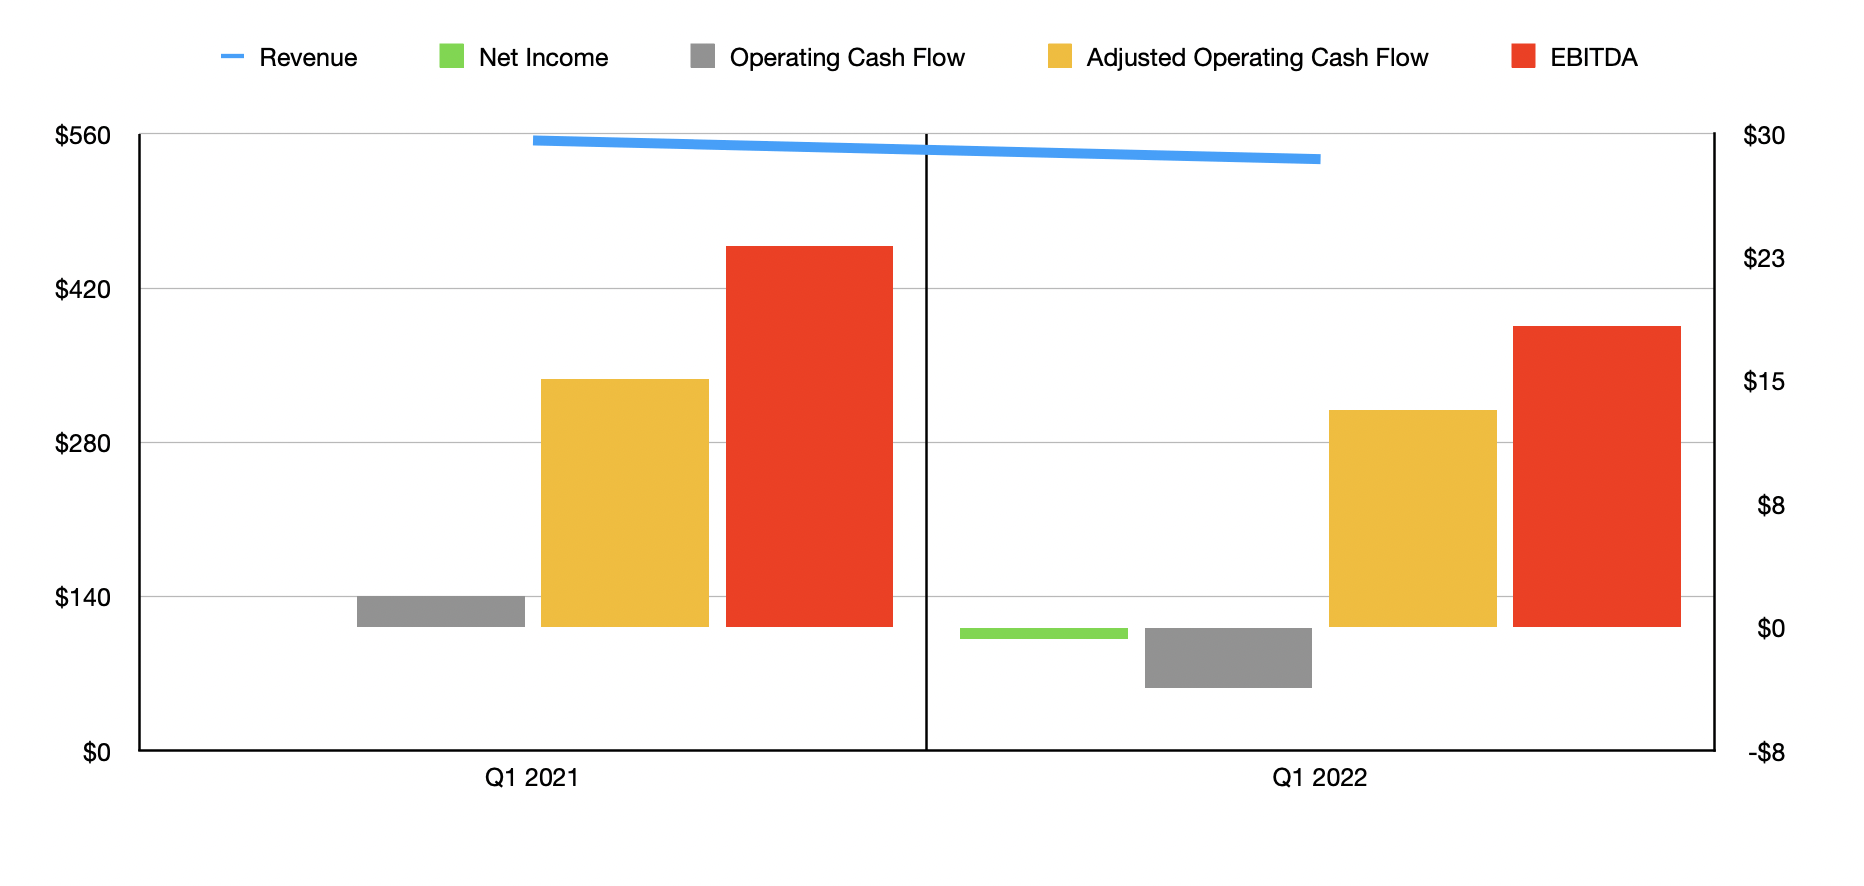
The company’s top line was not the only area to suffer. During the quarter, the business generated a net loss of $0.7 million. This compares to a complete breakeven one year earlier. Operating cash flow went from a positive $1.9 million to a negative $3.7 million. Even if we adjust for changes in working capital, it would have dropped from $15.1 million to $13.2 million. In addition to this, we should also pay attention to EBITDA. According to management, this metric came in at $18.3 million in the latest quarter. That compares to the $23.2 million generated one year earlier, implying a year-over-year decline of 21.1%.
Perhaps the reason why REV Group was spared further significant downside was because management offered a fairly rosy view of the company’s 2022 fiscal year as a whole. According to management, sales for the year should come in at between $2.3 billion and $2.55 billion. At the midpoint, this would work out to revenue of $2.425 billion. That would translate to a modest increase over the $2.38 billion generated in 2021 and it would come in 6.5% above what the company generated in 2020. In fact, this should be the highest revenue the company has achieved in at least six years.
In addition to anticipating attractive sales, the company is also forecasting with positive profitability. Net income should be between $45 million and $73 million. At the midpoint of that range, this would imply a year-over-year increase of 32.9% compared to the $44.4 million management reported for 2021. On an adjusted basis, the range should be from $64 million to $89 million, with the midpoint translating to a year-over-year decline of just 0.5%. On top of this, management is also forecasting EBITDA of between $125 million and $155 million. The midpoint reading here of $140 million would come in just under the $141.5 million reported for 2021. Management did not provide any guidance when it came to operating cash flow, opting instead to provide guidance for free cash flow. But if we assume a similar year-over-year decline for operating cash flow as what we should see with EBITDA, then operating cash flow for the year should be around $97.1 million on an adjusted basis. It’s also worth noting that management likely made investors happy with the announcement that, during that quarter, the business bought back 2 million shares for $24.4 million. That translates to about 3.1% of all shares previously outstanding.
Author – SEC EDGAR Data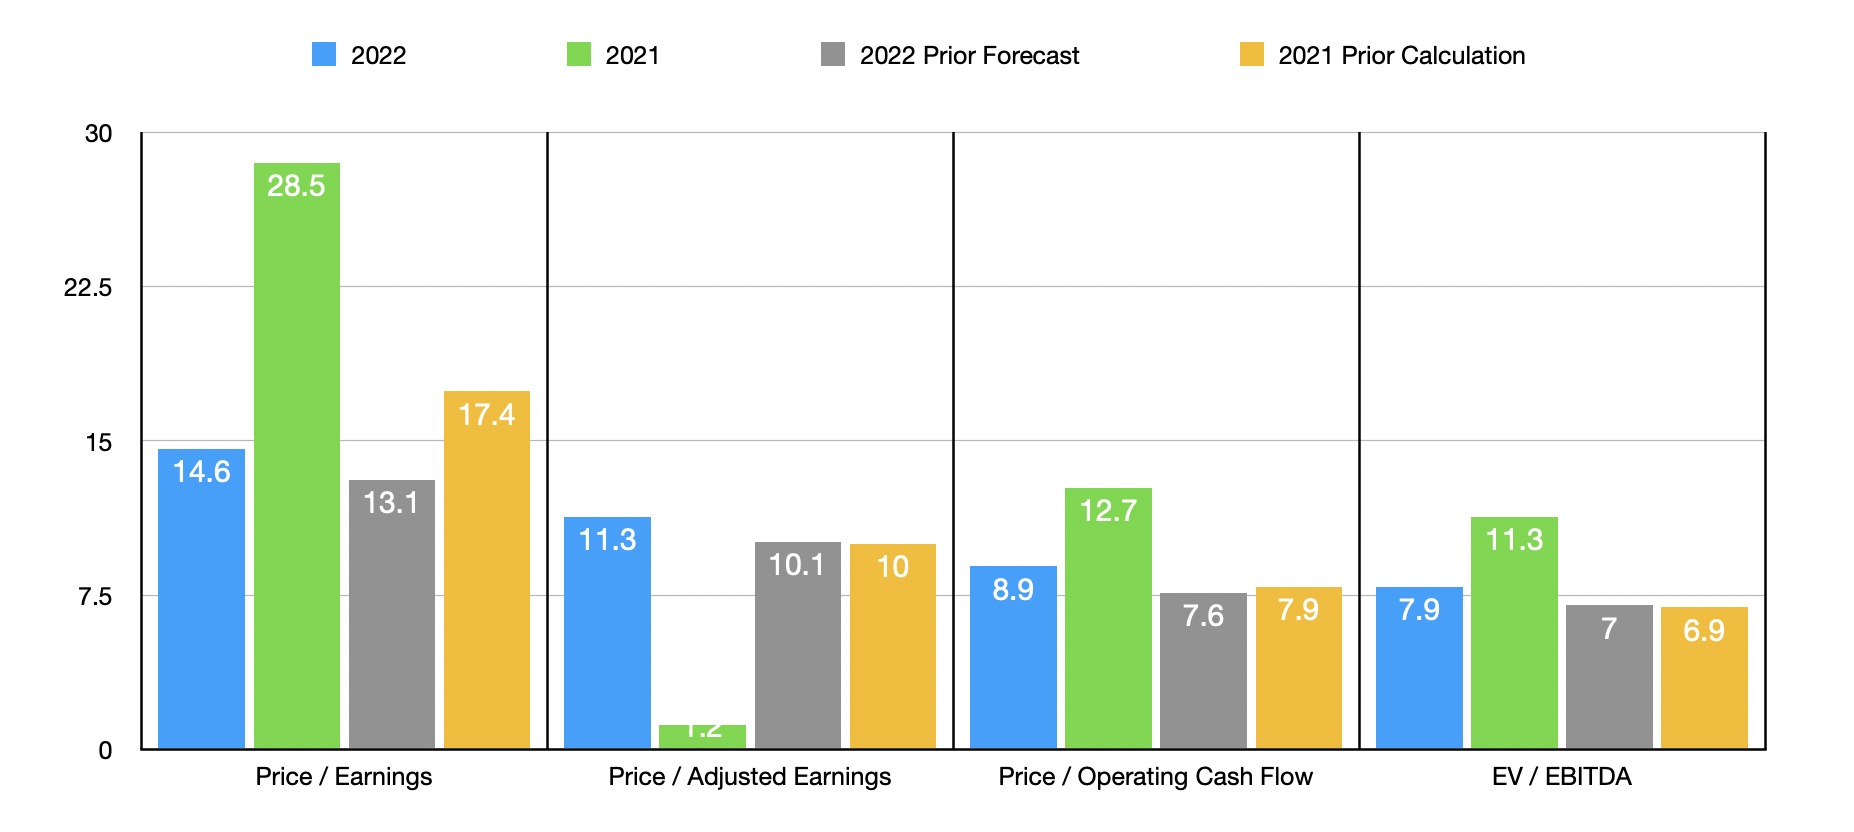
When it comes to pricing the company, the picture is pretty simple. Using the company’s 2021 results, it is trading at a price to earnings multiple of 19.5. This is up slightly from the 17.4 reading that I calculated in my prior article. The price to adjusted operating cash flow multiple would be 8.8. That compares to the 7.9 in my prior article. And the EV to EBITDA multiple would be 7.8. That compares to the 6.9 in my prior article. Using, instead, the 2022 estimates for the business, shares are priced at these multiples of 14.6, 8.9, and 7.9, respectively. In my prior article, I offered an estimate as to what these metrics might be. And at that time, I calculated 13.1, 7.6, and 7. To put the pricing of the company into perspective, I also decided to compare it to five similar firms. On a price-to-earnings basis, these companies ranged from a low of 3.8 to a high of 1,555. Using both our 2021 and 2022 calculations, we find that only one of the five companies is cheaper than our prospect. The same holds true when looking at the price to operating cash flow approach, with a range of between 8.4 and 134.8. Meanwhile, using the EV to EBITDA approach, the range would be from 14.5 to 43.7. In this case, our prospect is the cheapest of the group.
| Company | Price / Earnings | Price / Operating Cash Flow | EV / EBITDA |
| REV Group | 19.5 | 8.8 | 7.8 |
| Douglas Dynamics (PLOW) | 26.3 | 12.9 | 14.5 |
| Hyliion Holdings (HYLN) | 3.8 | N/A | N/A |
| Astec Industries (ASTE) | 55.8 | 134.8 | 17.8 |
| Wabash National (WNC) | 1,555 | 9.3 | 15.2 |
| Blue Bird Corporation (BLBD) | 40.2 | 8.4 | 43.7 |
Takeaway
Although we are seeing some softness in the financial performance for REV Group today, the overall picture for the company seems to be quite solid. This will never be a rapidly growing enterprise with strong margins. But if management’s guidance for 2022 ends up being accurate, or even close to it, shares are priced at levels that should be considered attractive. Admittedly, much of the easy upside has probably already been had. But for long term, value-oriented investors who like this market, REV Group may be a good prospect to consider.
Be the first to comment