

undefined undefined/iStock via Getty Images
Let’s review this week’s economic releases.
The Chicago Fed’s National Activity Index points towards above-trend growth:
The Chicago Fed National Activity Index (CFNAI) moved down to +0.51 in February from +0.59 in January. Three of the four broad categories of indicators used to construct the index made positive contributions in February, but two categories deteriorated from January. The index’s three-month moving average, CFNAI-MA3, ticked down to +0.35 in February from +0.37 in January.
Personal consumption spending contributed the only negative data:
The contribution of the personal consumption and housing category to the CFNAI fell to –0.04 in February from +0.21 in January.
Building permits were modestly lower:
Building permit data (Census)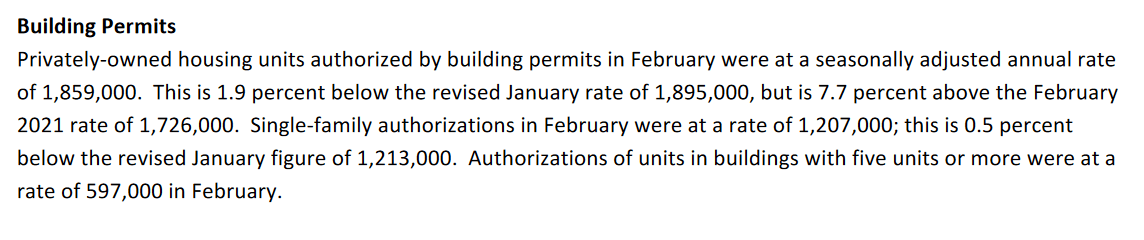
Here’s a chart of the data:
1-unit building permits (FRED)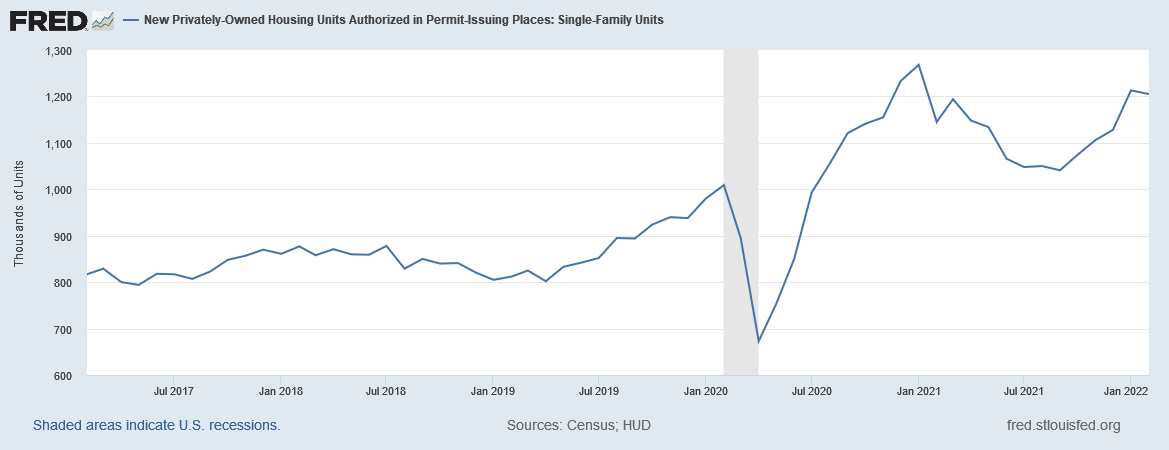
1-unit permits started to rise last September. The latest dip is likely a modest cooling during a period of rising activity.
We now have a complete set of new housing industry data. Existing home sales were lower:
Total existing-home sales,1 Existing-Home Sales, completed transactions that include single-family homes, townhomes, condominiums and co-ops, sank 7.2% from January to a seasonally adjusted annual rate of 6.02 million in February. Year-over-year, sales decreased 2.4% (6.17 million in February 2021).
Here’s a chart of the data:
Existing home sales (Calculated Risk)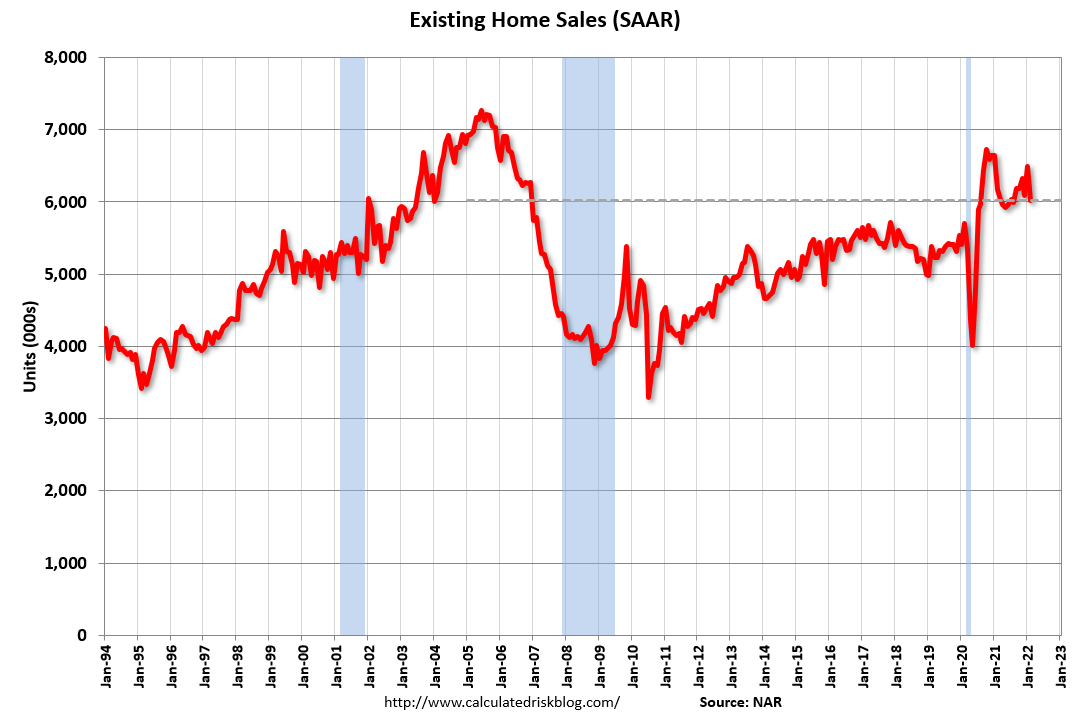
This data has been consistent for about a year.
New home sales were off:
New home sales (Census)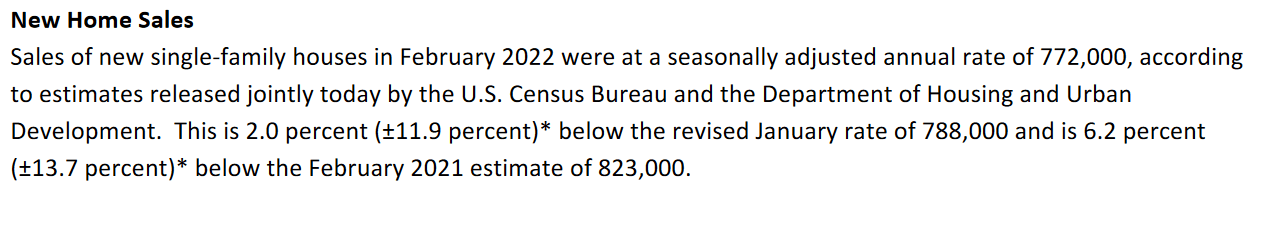
Here’s the chart:
New home sales (FRED)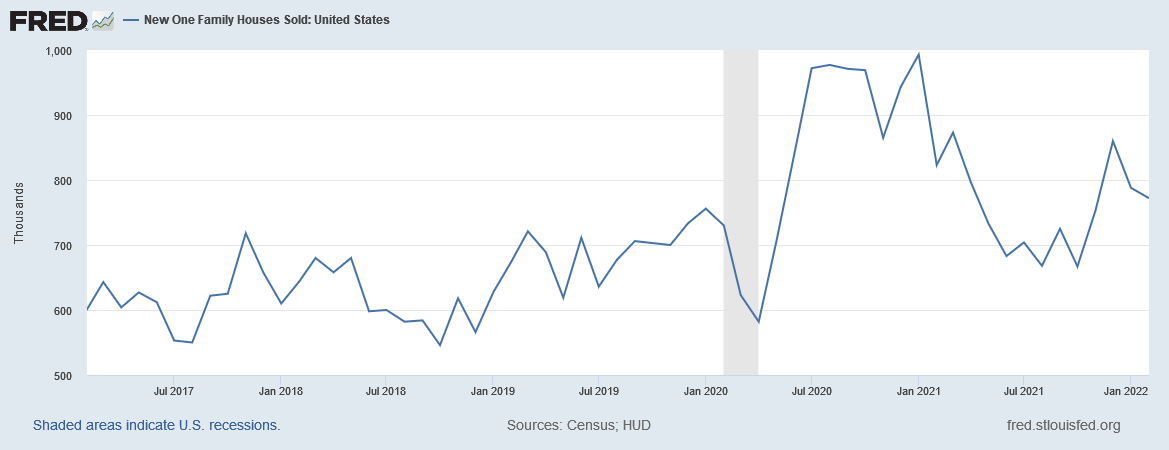
The recent declines are likely due to rising rates. But trends (higher rates and lower sales) should continue throughout the year.
Durable goods orders were lower:
Durable goods orders (Census)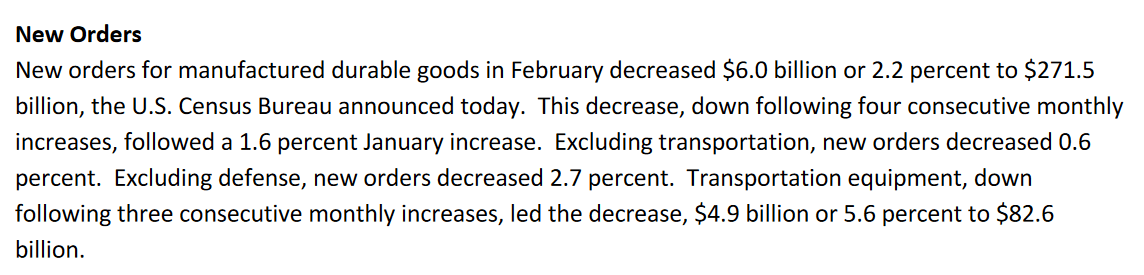
Here’s the data:
Durable goods orders and durable goods ex-transportation (FRED)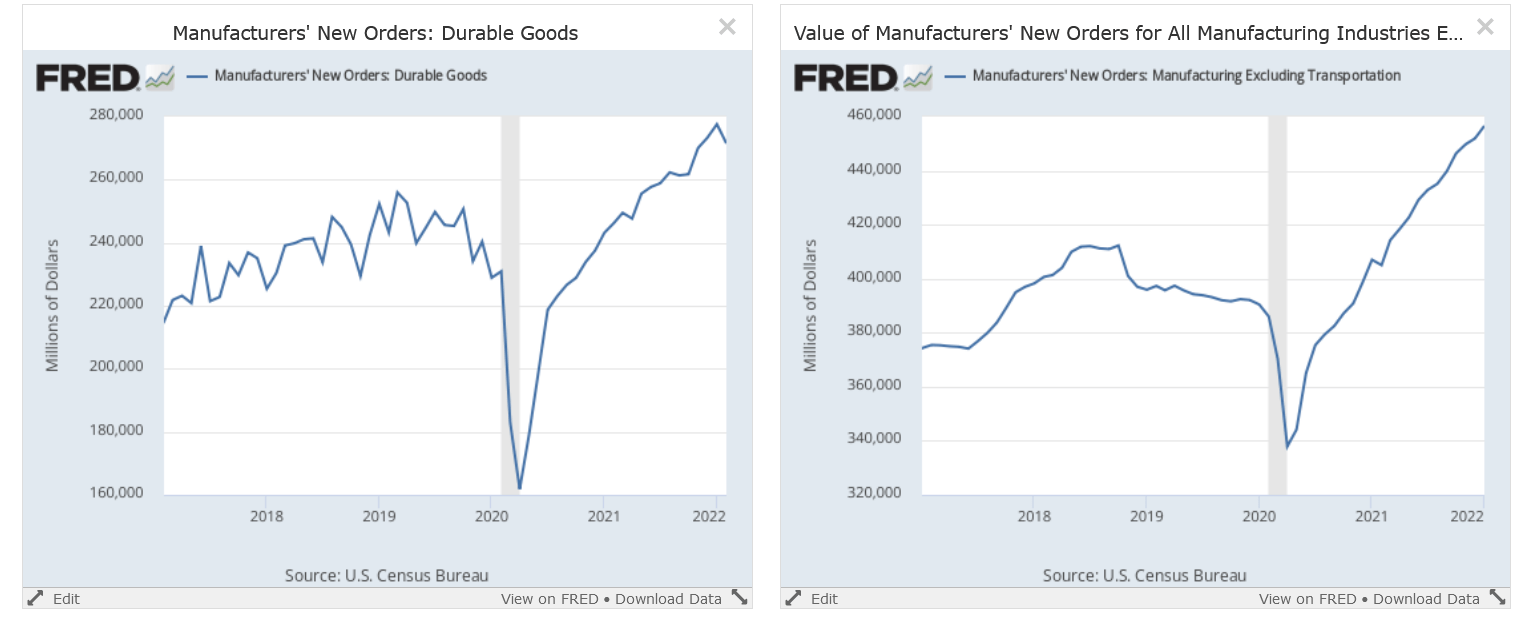
This is the first dip in total new orders in nearly two years. Total orders ex-transportation, however, are still rising.
At worst, the above data is neutral. But a more accurate description is that it’s softly positive.
Now let’s turn to the charts, starting here:
1-year SPY, QQQ, DIA, and IWM (StockCharts)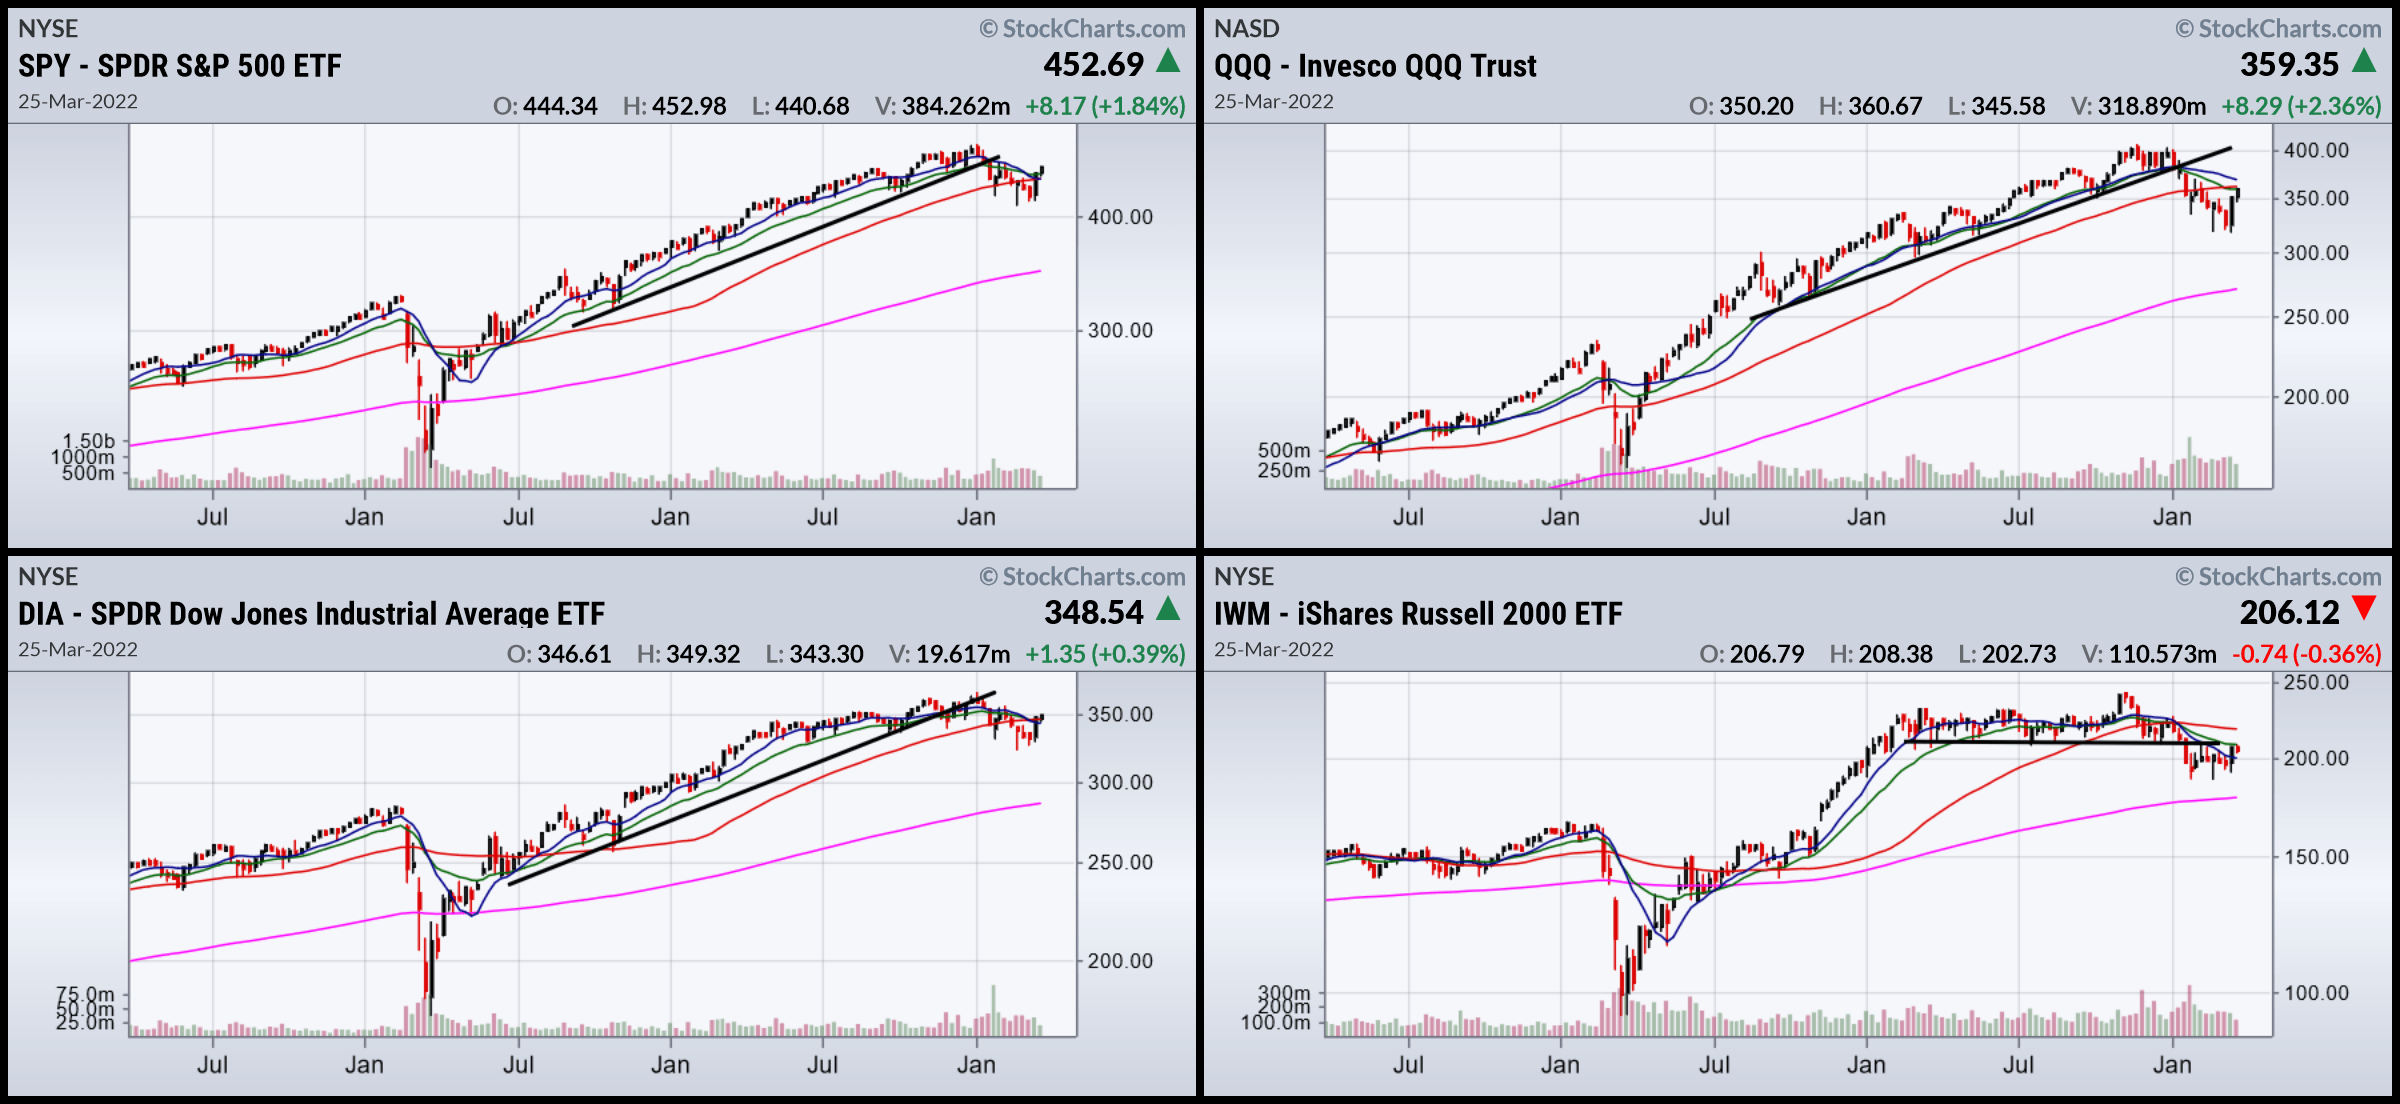
All of the indexes have broken key long-term support. That means we’re now in a new market phase.
6-month SPY, QQQ, DIA, and IWM (StockCharts)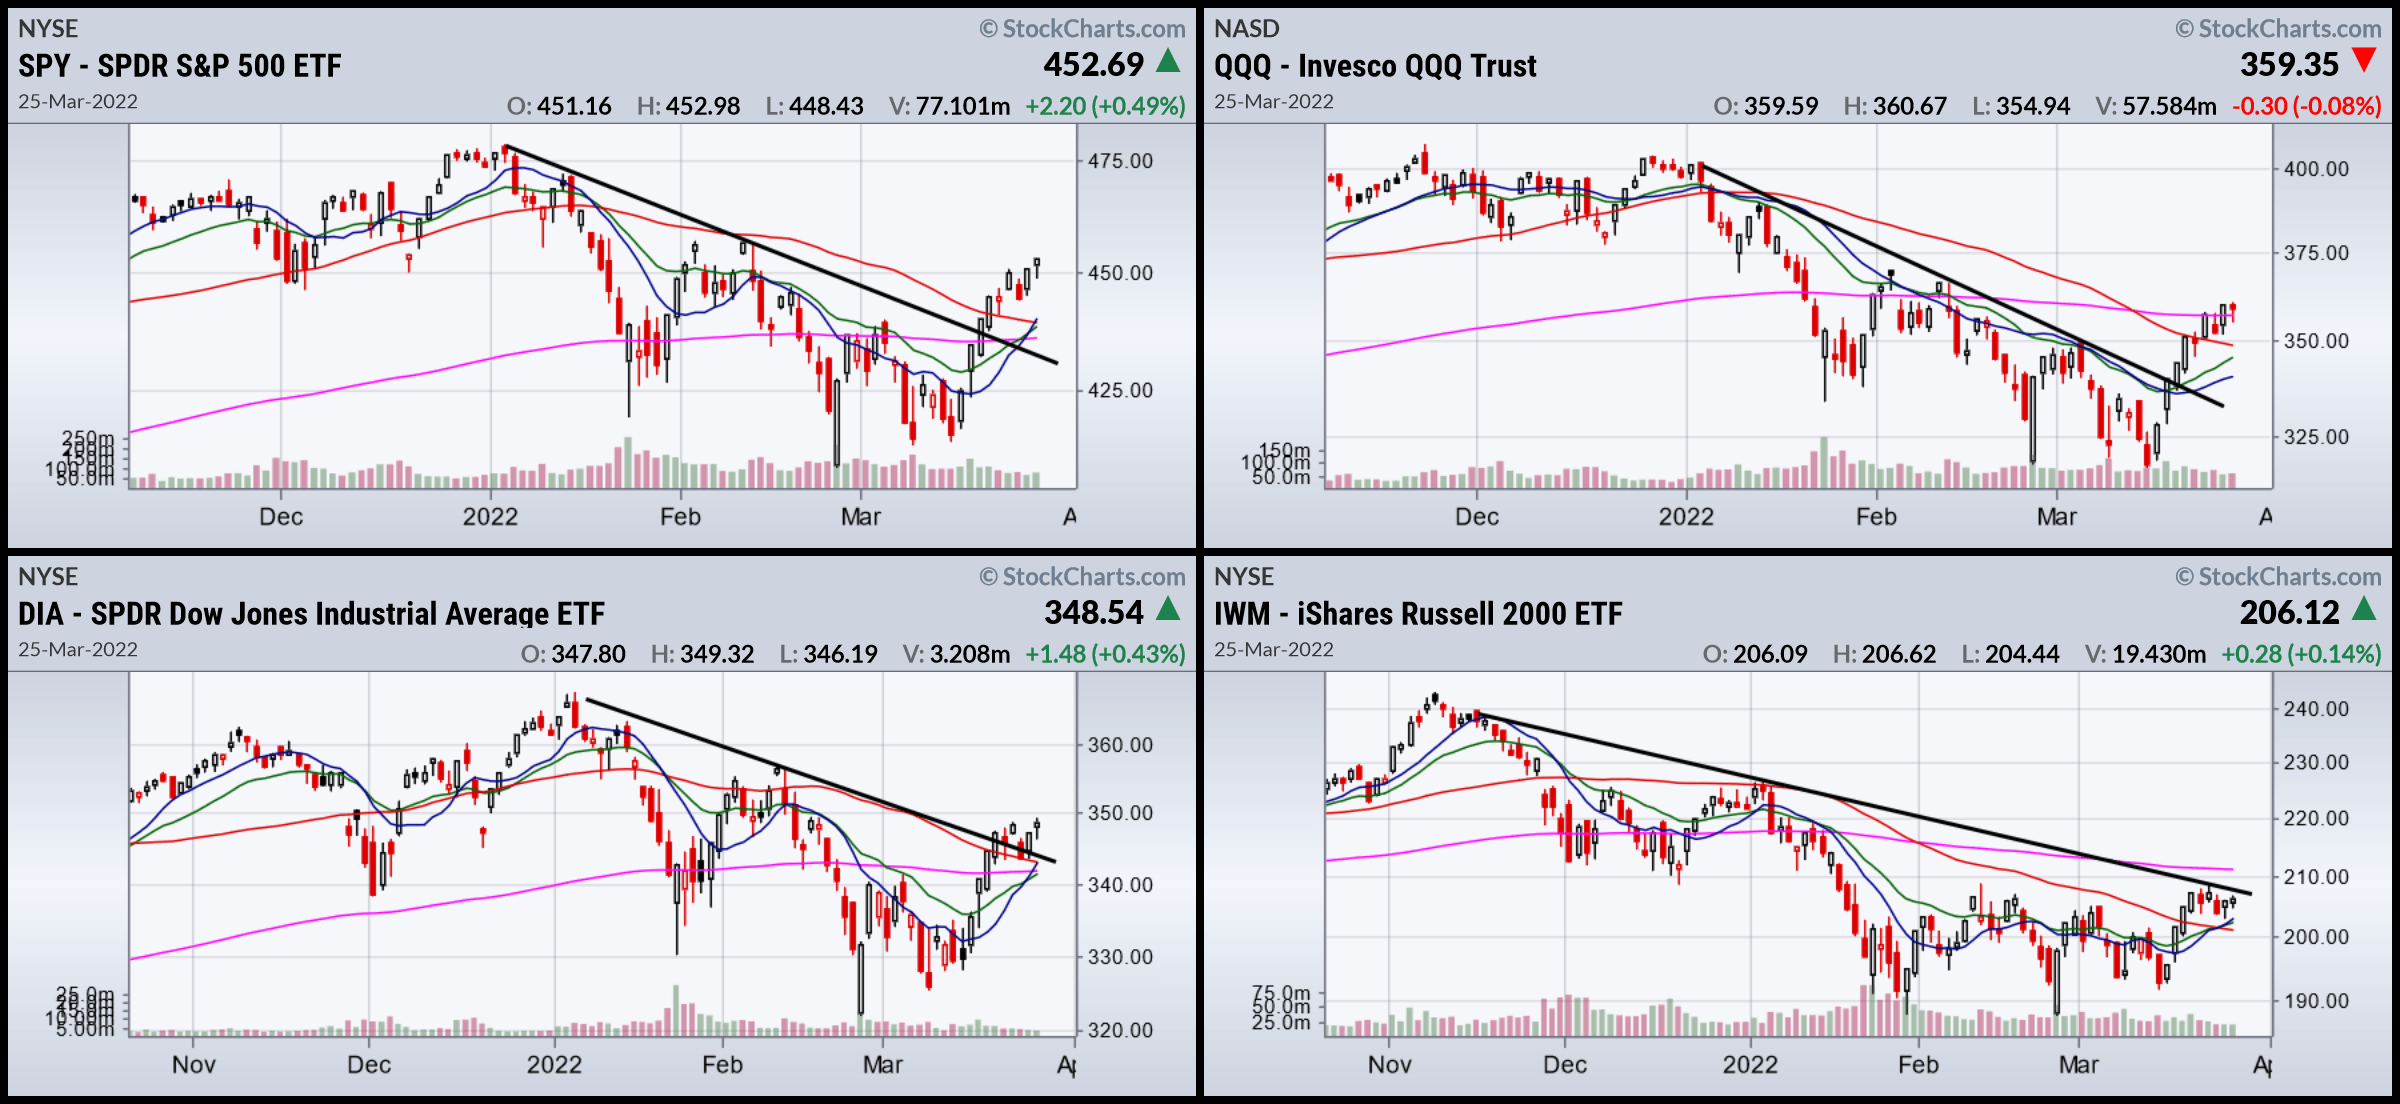
But the shorter-term charts show that the markets have mostly broken the recently-established downtrend, with the exception of the IWM.
This means we need to assess the possibility of a new upward trend emerging.
Technical Indicators (Author’s Data)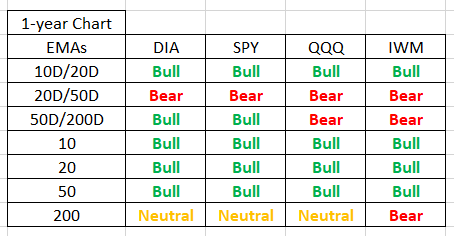
The above spreadsheet is from the author’s Stockcharts.com data. It is based on the exponential moving averages from 1-year charts. On the bearish side, the longer-term indicators are still negative. All 20-day EMAs are below 50-day EMAs, two 50-day EMAs are below 200-day EMAs, and all 200-day EMAs are either neutral (moving sideways) or bearish (heading lower).
But shorter-term data is positive. All the 10-day EMAs are above the 20-day EMAs, and all 10, 20, and 50-day EMAs are moving higher.
In other words, the markets want to turn more bullish but that hasn’t translated into long-term bullishness yet.
The biggest challenge to a prolonged rally is the Fed. As I noted earlier this week, the Fed has clearly shifted to a hawkish stance. Three presidents have stated they are in favor of a 50-basis point hike to stem inflationary pressures.
And that leads to the final point: the old trader’s adage of, “Don’t fight the Fed.” Higher rates are typically bearish for stocks. That greatly diminishes the possibility of a longer-term rally.
Be the first to comment