

vicnt/iStock via Getty Images
Investment Thesis
Realty Income Corporation (NYSE:NYSE:O) may face more correction ahead if the global macroeconomics worsen, given the stock weaknesses seen thus far. Despite its stellar FQ2’22 performance and raised FY2022 guidance, the O stock had declined by -10.6% after a slight recovery of 3.8% post-earnings call. This could also be attributed to the Fed’s hawkish comments on 26 August, potentially triggering a 75 basis points hike at the upcoming 20 September meeting, assuming a higher than expected US inflation rate for August 2022.
O’s 5Y Total Price Return of 43.8% and 10Y Return of 150.6% do not seem impressive as well, given the average dividend yield of 4.41%. In addition, the company had previously reported a -0.7% YoY decline in revenues, -6.8% decline in cash from operations, and in-line profitability during the last recession in FY2009. The stock had also plunged by -40.2%, between September 2008 and March 2009. Thereby, presenting further headwinds to O’s stock performance ahead, assuming the Fed’s continuous rate hikes through 2023, given its elevated debts. We shall see.
However, we remain impressed by O’s excellent AFFO margins thus far, which are expected to remain relatively stable during the economic downturn ahead, given O’s exemplary:
- rent recapture rate of 105.9% on the re-leased units in H1’22.
- long-term lease agreements with a weighted average of approximately 8.8 years remaining in FQ2’22.
- excellent occupancy rate of 98.9% in FQ2’22.
O Reported Excellent Profit Margins Despite The Perceived Economic Downturn
S&P Capital IQ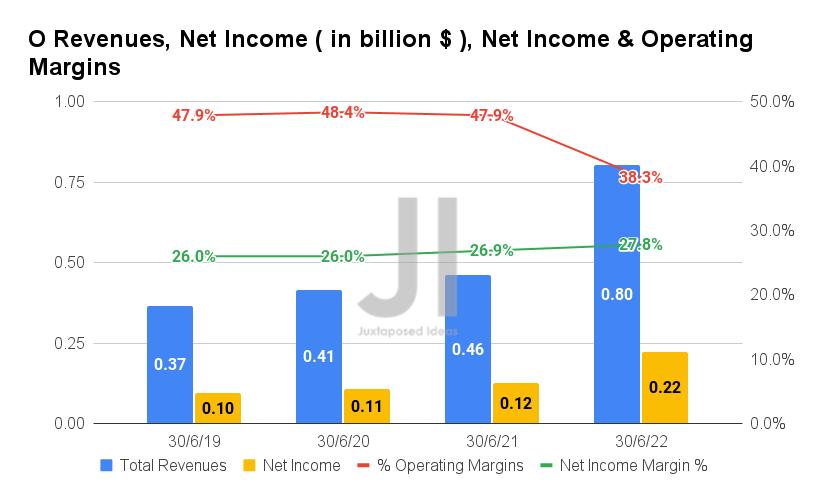
In FQ2’22, O reported revenues of $0.8B and gross margins of 27.8%, representing YoY growth of 73.91% though a decline of -9.6 percentage points YoY, respectively, attributed to its merger with VEREIT, Inc. In contrast, the company reported improved profitability, with net income of $0.22B and net income margin of 27.8%, representing an impressive increase of 83.3% and 0.9 percentage points YoY, respectively.
This exemplary growth is partly spurred by the increased occupancy rate of 98.9% in FQ2’22 compared to 98.6% in FQ1’22. Furthermore, O also reported a 2% YoY improvement in its same-store rental revenues. Thereby, improving its profit margins as well.
S&P Capital IQ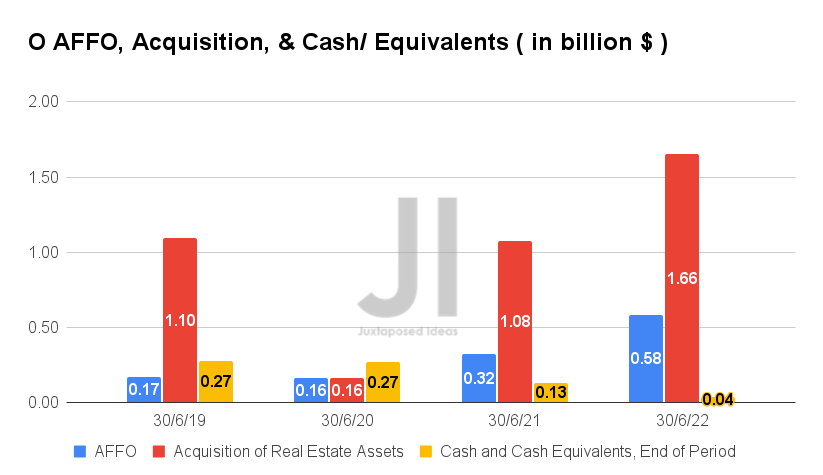
In FQ2’22, O reported exemplary AFFO of $0.58B and margins of 72.5%, representing YoY growth of 81.2% and 3 percentage points, respectively. Otherwise, an increase of 341.1% and 26.6 percentage points from FQ2’19 levels. However, with $3.2B of acquisitions completed in H1’22 and another $2.8B planned by the end of the year, we may see further impacts in O’s cash and equivalents of $0.04B as of FQ2’22, which have been declining YoY as well.
We May See More Debts and Share Dilutions Ahead
S&P Capital IQ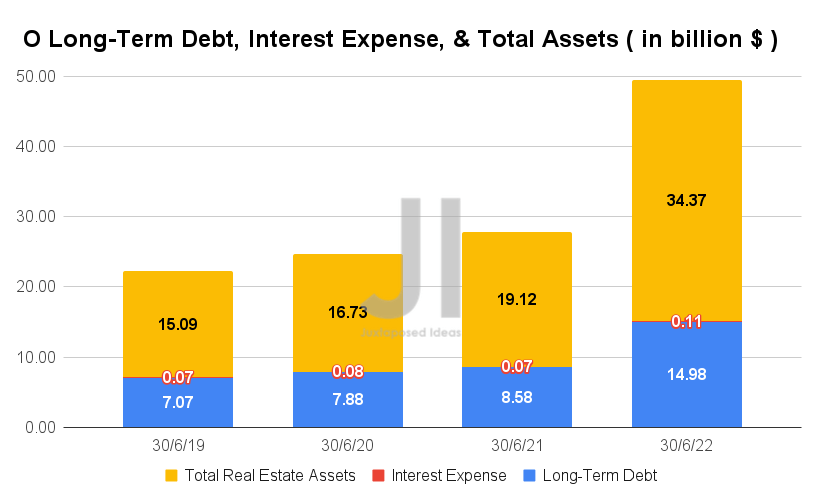
Per the management’s guidance, O would further rely on long-term debt worth $4.35B in multicurrency revolving credit and $3B of overseas paper programs with generally lower interest rates to fund its rapid expansion and higher US interest rates. As a result, the company reported a total of $14.98B in long-term debt and $0.11B in interest expenses as of FQ2’22, representing a massive increase of 74.5% and 57.1% YoY, respectively.
However, it is also impressive that O reported a massive increase of 79.7% in total real estate assets, which will continue to be top and bottom lines accretive over time.
O’s Long-Term Debt Maturity
Seeking Alpha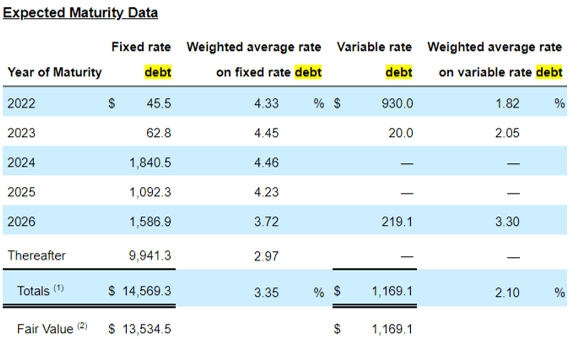
In the meantime, O has a minimal $108.3M debt maturity over the next two years, with $1.84B of principal due in 2024. Nonetheless, we are not overly concerned, since the company reports excellent AFFO of $1.48B in FY2021 and $1.16B by H1’22. Combined with its well-staggered maturities through 2047, O remains well poised for rapid growth and expansion over the next few quarters, assuming similar execution and AFFO.
S&P Capital IQ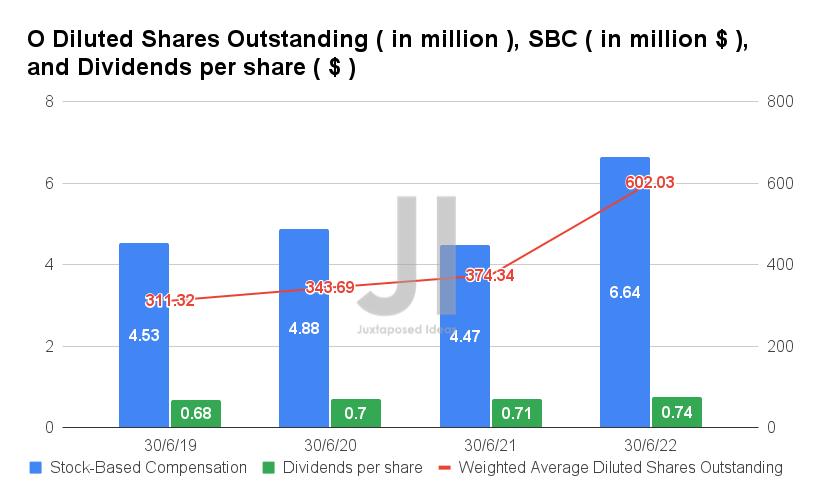
However, given its previous capital raise of $4.51B in late 2021, amongst others, O reported elevated diluted shares outstanding of 602.03M in FQ2’22, representing a massive increase of 60.8% YoY. Its elevated Stock-Based Compensation of $6.64M with a 48.5% YoY increase has also contributed to its share dilution thus far.
In the meantime, O has been steadily increasing its monthly dividends thus far, with $2.92 paid and 4.41% dividend yields over the last twelve months. It indicates an increase of 5.6% YoY from $2.77 in FY2021 and 7.8% from $2.71 in FY2020. Given that the company is currently at a growth-at-all-costs stage with massive acquisition plans and debt leveraging ahead, investors would be well advised to keep a close eye on its share count, since continued dilution may impact its future dividend growth.
Mr. Market Is Quietly Optimistic About O’s Projected Profitability
S&P Capital IQ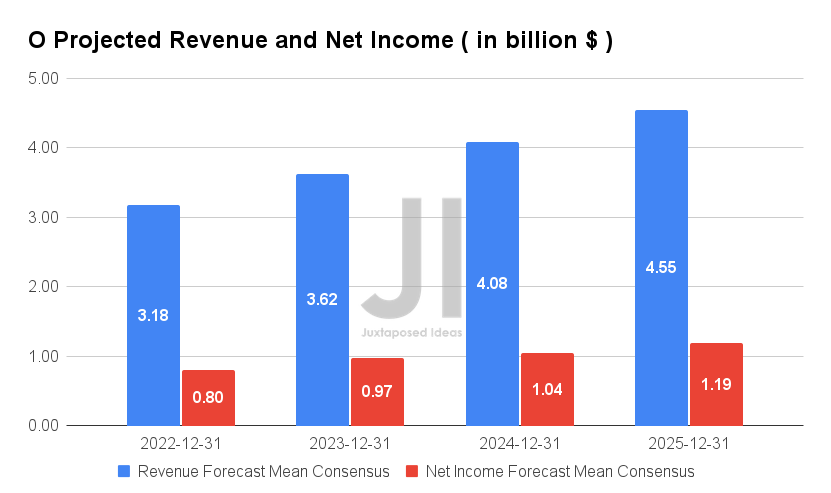
Over the next four years, O is expected to report impressive revenue and net income growth at a CAGR of 21.61% and 35.79%, respectively. This is comparatively accelerated growth than the 2Y pandemic revenue CAGR of 17.98% during the red-hot property market then. It is even more impressive since analysts expect an improvement in its net income margins, from 17.3% in FY2021 to 26.1% by FY2025.
Assuming similarly robust AFFO margins ahead, we may expect to see O report up to $3.29B of AFFO by FY2025. Stellar indeed, since it would trigger a long-term share price appreciation over the next few years.
In the meantime, O is expected to report revenues of $3.18B and net income of $0.8B in FY2022, representing an exemplary increase of 52.8% and 228.5% YoY, respectively. Thereby, pointing to its improved net income margins of 25.1% then, given the management’s recently raised guidance for normalized FFO per share from $3.88-$4.05 to $3.92-$4.05 against consensus estimates of $4.00, and same-store rent growth from 1.5% to 2%.
It is no wonder then that the O stock had slightly recovered by 3.8% post FQ2’22 earnings call. Though, all of those gains have also been erased by now, with another low $60s speculatively on the horizon, given the market’s pessimism ahead.
So, Is O Stock A Buy, Sell, or Hold?
O 5Y EV/Revenue and P/E Valuations
S&P Capital IQ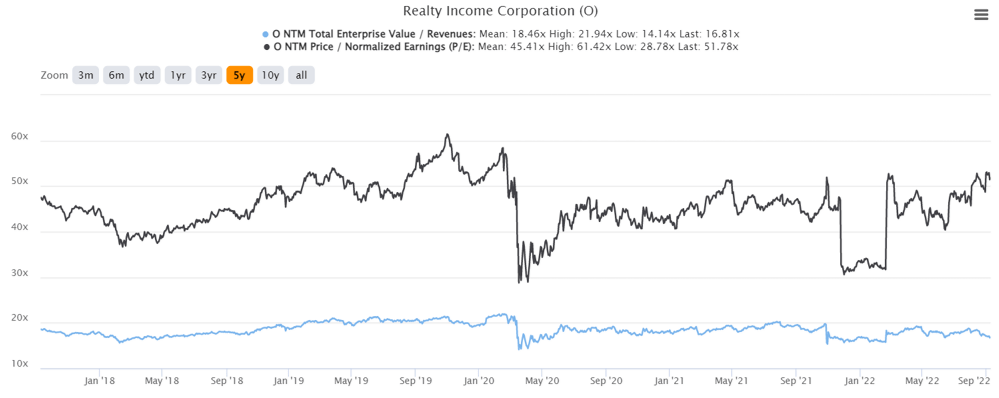
O is currently trading at an EV/NTM Revenue of 16.81x and NTM P/E of 51.78x, lower than its 5Y EV/Revenue mean of 18.46x though higher than its 5Y P/E mean of 45.41x. The stock is also trading at $66.79, down -11.4% from its 52 weeks high of $75.40, nearing its 52 weeks low of $62.29.
O 5Y Stock Price
Seeking Alpha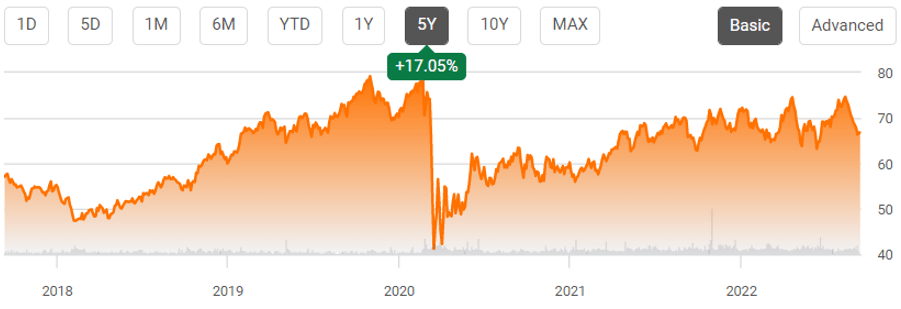
Nonetheless, consensus estimates remain bullish about O’s prospects, given their price target of $76.29 and a 14.22% upside from current prices. Patient investors may potentially wait for another low $60s before adding to their portfolios. The time will come as the Feds seem ready to aggressively hike interest rates through 2023 to battle the rising inflation. In the meantime, it is unlikely that we will ever see the low $50s range anymore, given its stellar profitability, barring another earth-shattering event ahead.
As a result, we rate O stock as a Hold for now, given the potential volatility ahead.
Be the first to comment