

US Dollar, EUR/USD, GBP/USD, USD/CAD Talking Points:
Friday brings an NFP release that could bring some consequence. At the September FOMC rate decision the bank said, very clearly, that they’d be ready to announce a tapering of asset purchases soon provided that employment data did not disappoint. And given the context, in which there was one single NFP report to be released from when Powell said that statement to the next FOMC rate decision in November, this Friday’s NFP is perhaps even more important than usual.
To learn more about Non-farm Payrolls, check out DailyFX Education
If NFP beats the 473k expectation, there could be a continuation of recent USD strength, and this may even take a toll on stocks, which have been in a pretty vulnerable spot ever since that FOMC rate decision. As always, there’s a lot of grey area here, but I think the bias at this point is on a taper announcement so Friday’s report would likely need to be really bad in terms of the headline number, the unemployment rate or perhaps Average Hourly Earnings to compel a reversal.
I’m obviously not the only one thinking this way given USD price action. We just released Q4 forecasts and I issued a bullish forecast for the USD for Q4. After nine months of mean reversion and back-and-forth following last year’s brutal sell-off, the US currency appears poised to further claw back 2020 losses.
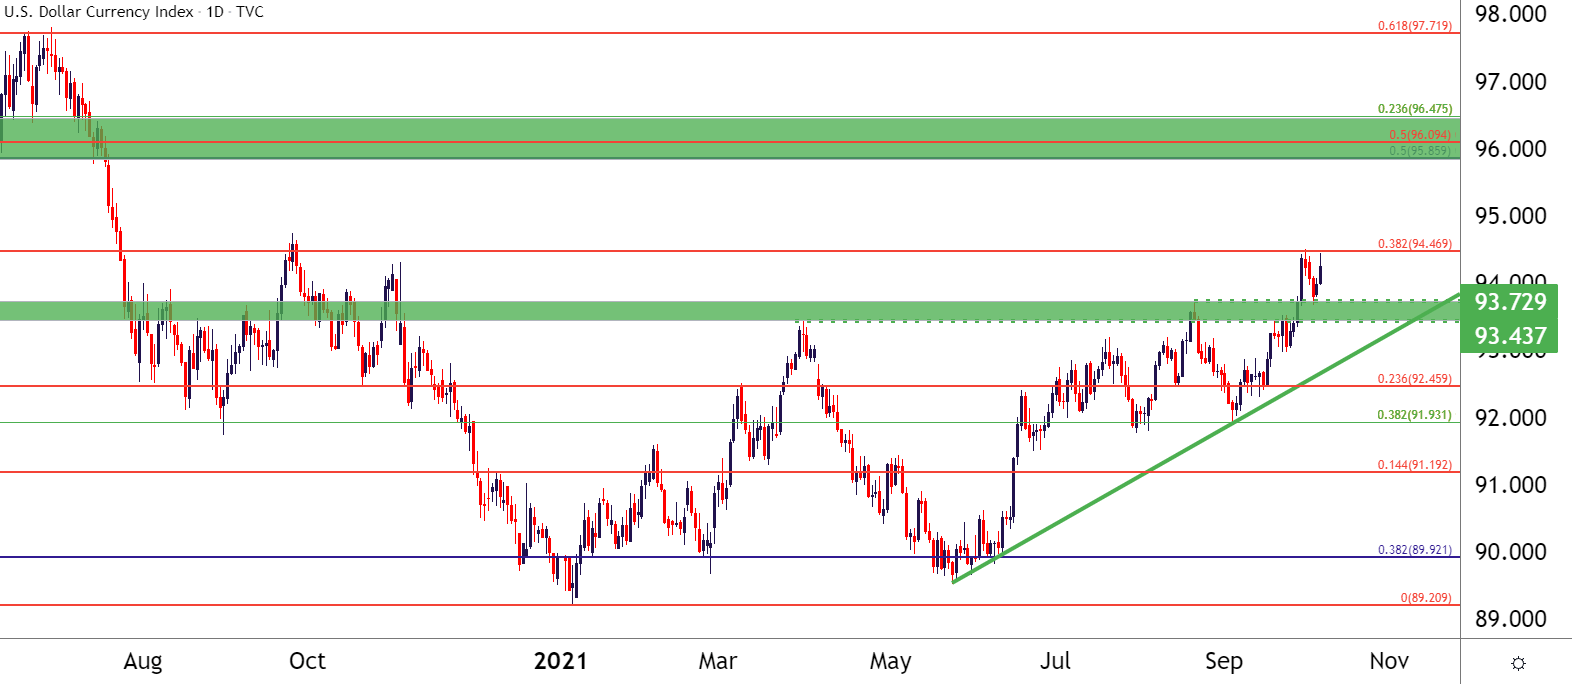
Last week, the USD had set up in an ascending triangle formation – often approached with the aim of bullish breakouts. And that break started to hit last week, ahead of the Q4 open, and prices continued to run until finding resistance at the 38.2% Fibonacci retracement of that sell-off from last year.
To learn more about Fibonacci or ascending triangle formations, check out DailyFX Education
That led to a pullback early this week, with buyers showing up to offer support at prior resistance (from the ascending triangle), and that’s led to another push up towards the highs. This creates a challenging situation for short-term scenarios, as NFP is likely the catalyst that could create the lasting breakout; but I looked into a few scenarios around that in the above webinar.
At this point, the USD retains breakout potential going into NFP. A pullback to support at the prior resistance zone, running from 93.44-93.73 keeps the door open for bullish trend scenarios in the pair.
US Dollar Daily Price Chart
Chart prepared by James Stanley; USD, DXY on Tradingview
EUR/USD Sinks, Key Support Nearby
I had looked at breakdown potential in EUR/USD last week as the Dollar was brewing for a breakout, and that EUR/USD theme hit as the pair has sunk down to fresh yearly lows.
The issue at this point is that price has stalled around that low and with little nearby context to work with, there’s not many nearby points of resistance to use for risk placement. If price can budge up to 1.1600 or perhaps even 1.1664 ahead of NFP, there could be trend scenarios to work with. Outside of that, breakouts may be challenged given the proximity of longer-term support in the 1.1448-1.1500 region.
EUR/USD Weekly Price Chart
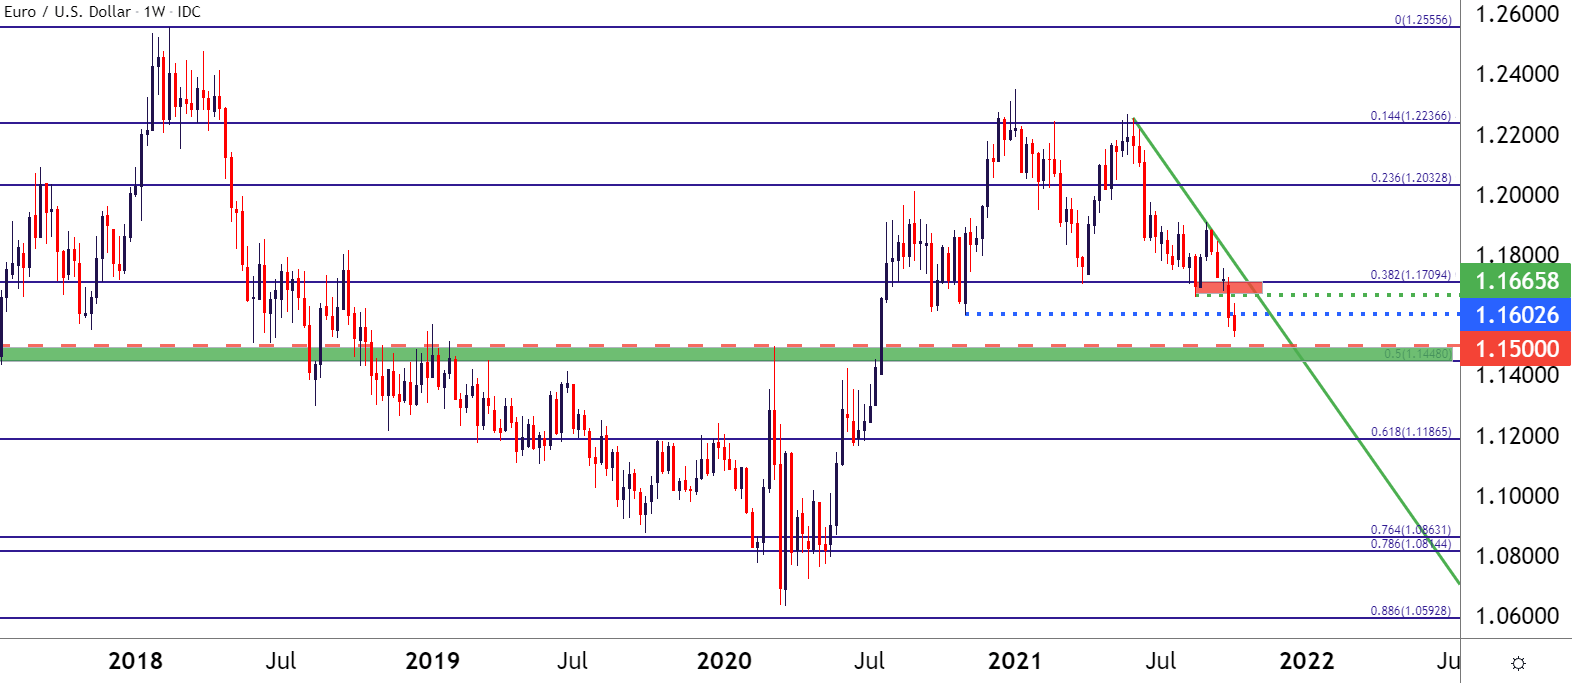
Chart prepared by James Stanley; EURUSD on Tradingview
GBP/USD: Cable Falls From Resistance
I had looked into GBP/USD while highlighting a zone of resistance that had already come back into play. This kept the door open for short-term USD strength scenarios, and overnight the pair put in a reaction of over 100 pips as prices fell back down.
But there’s also some longer-term support potential here, and unlikely EUR/USD above, GBP/USD has already tested this zone. It’s around the 1.3500 handle, and there’s a couple of other price levels very nearby, making for a zone around the psychological level. The interest here is whether the pair can put in a higher-low above last week’s low. A higher-low, basing off of that support running from 1.3483-1.3500 can open the door for longer-term reversals in the pair. For something like this to play out, likely, we’d need some anticipation ahead of NFP combined with a disappointing report, that could bring some USD-weakness back into the mix.
If price action can’t hold above last week’s swing-low, matters could get very bearish, very fast, as the next major support zone on my chart isn’t until the 1.3250 area comes back into play.
GBP/USD Daily Price Chart
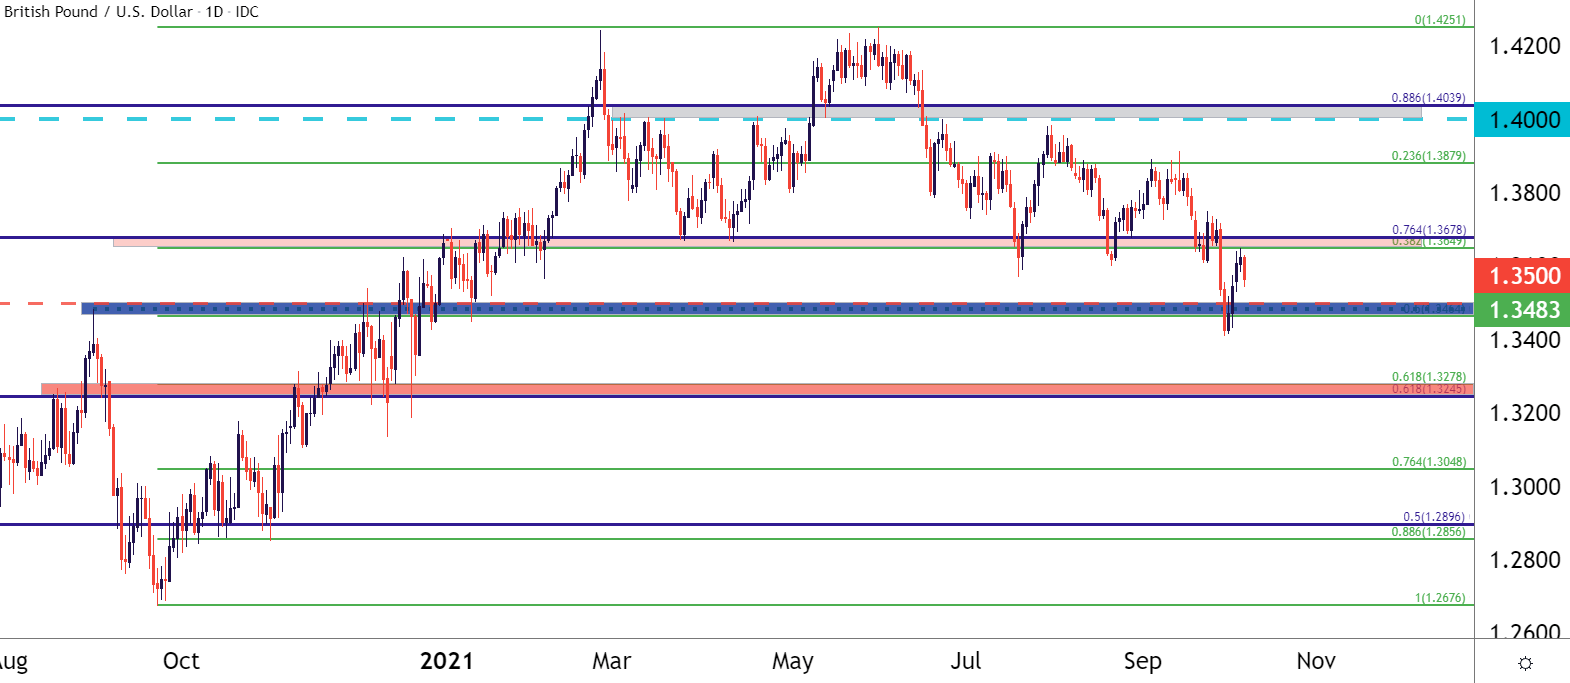
Chart prepared by James Stanley; GBPUSD on Tradingview
USD/CAD Brewing for a Break
Surging oil prices have certainly made their mark in a number of areas, and that impact might not yet be finished. But, it’s also helped USD/CAD to remain fairly subdued amid all of this USD strength, as a strong Canadian Dollar, helped along by strong oil prices, have kept the pair pinned down near support.
Collectively, between these themes of a stronger US Dollar and stronger oil prices, USD/CAD has essentially seen price action congest into a wedge over the past few months, and symmetrical triangles can lead to explosive moves when proper motivation presents itself. The big question is whether that’ll be topside, as pushed by stronger USD themes or underside, pushed by stronger oil themes combined with some relief in the USD, perhaps from a disappointing NFP report or something similar.
USD/CAD Daily Price Chart
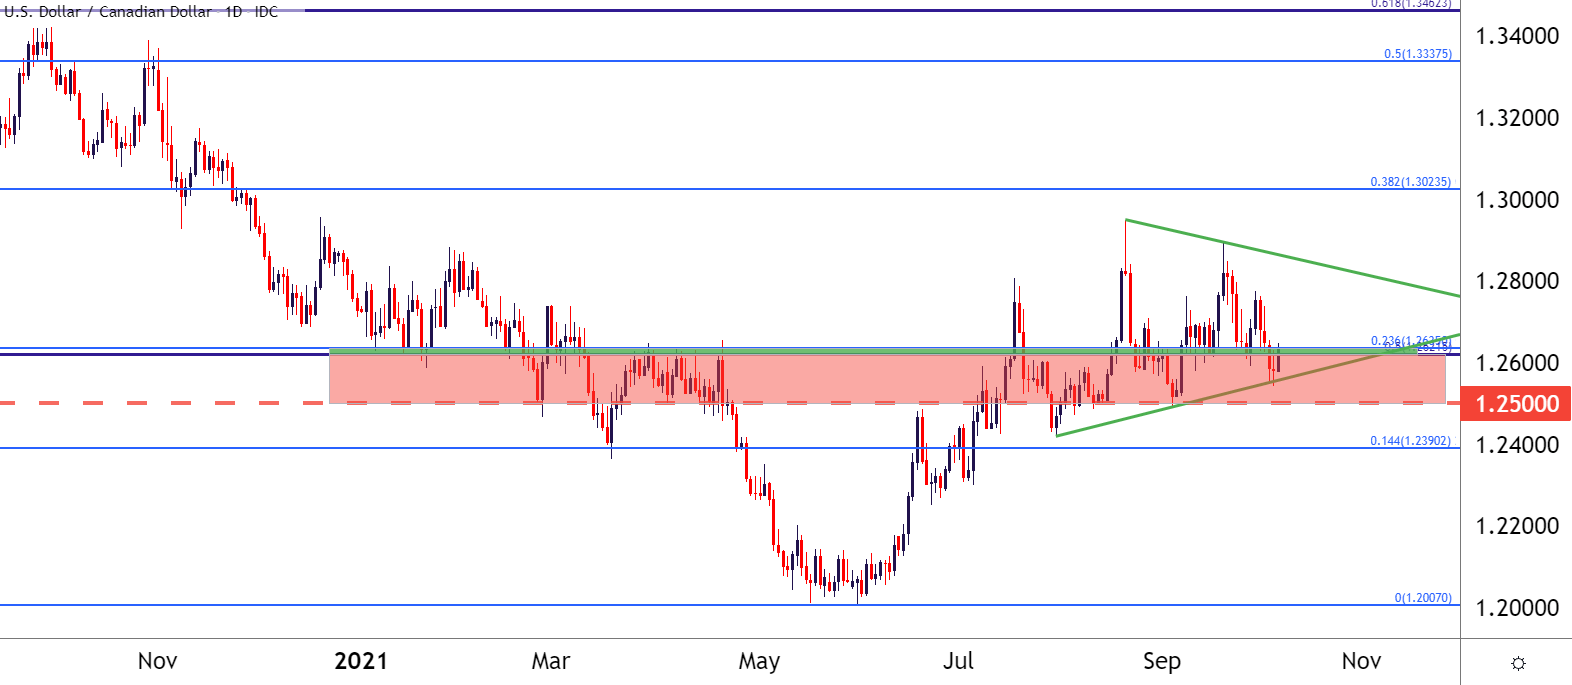
Chart prepared by James Stanley; USDCAD on Tradingview
— Written by James Stanley, Senior Strategist for DailyFX.com
Contact and follow James on Twitter: @JStanleyFX
Be the first to comment