

Maria Vonotna
Thesis
Realty Income Corporation (NYSE:O) is a high-quality net-lease REIT focusing mainly on retail tenants (84%). O also has a secular long-term uptrend, a secure dividend yield, and highly stable AFFO per share visibility. As a result, O’s investors have enjoyed superior risk-adjusted returns over the years, as it notched a 10Y total return CAGR of 10.15%.
The REIT has continued to perform well in the current environment, despite worsening macro headwinds and interest rate hikes. The company’s strong and diversified tenant base continues to proffer investors stability. Furthermore, its robust balance sheet also offers management attractive opportunities to capitalize on the current volatility, as it increased its acquisition volume for FY22 to more than $6B.
Notwithstanding, we gleaned that O’s recent price action has faced significant resistance at the $75 level. However, buying upside has remained robust at its critical support zone of $62. Coupled with a pretty well-balanced valuation, we surmise that investors can continue to bide their time to await a better entry point.
Therefore, we rate O as a Hold for now. However, we will assess its price action closely, as O could be close to its near-term bottom.
Realty Income’s AFFO Growth Cadence Could Slow Through FY23
Our analysis suggests that the market has remained tentative in re-rating O, despite its robust tenant portfolio. Realty Income’s cap rates have increased, mitigating the impact of the underlying rate hikes. Therefore, O has performed reasonably well, remaining in a tight trading range since 2021.
Realty Income AFFO per share change % consensus estimates (S&P Cap IQ)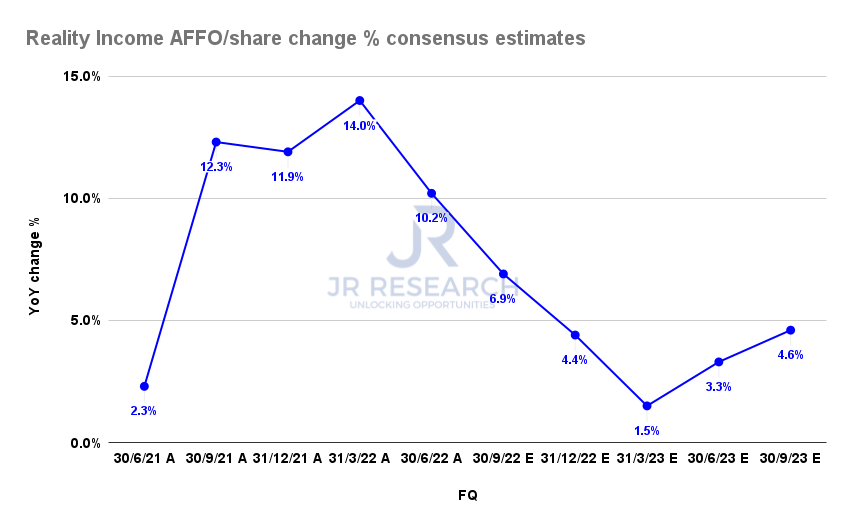
As seen above, the consensus estimates (bullish) indicate that Realty Income’s AFFO per share growth could continue to normalize through FQ1’23 as it laps challenging comps. Also, the contribution from its recent acquisitions is unlikely to be accretive to its AFFO growth in the near term. The company also highlighted that it expects to continue experiencing forex headwinds, as “about 60% of (its) foreign-denominated AFFO is unhedged.”
Moreover, we believe the company has continued to guide prudently, as it expects the rates to impact its spread, which could also affect its near-term AFFO growth cadence.
Dollar index price chart (monthly) (TradingView)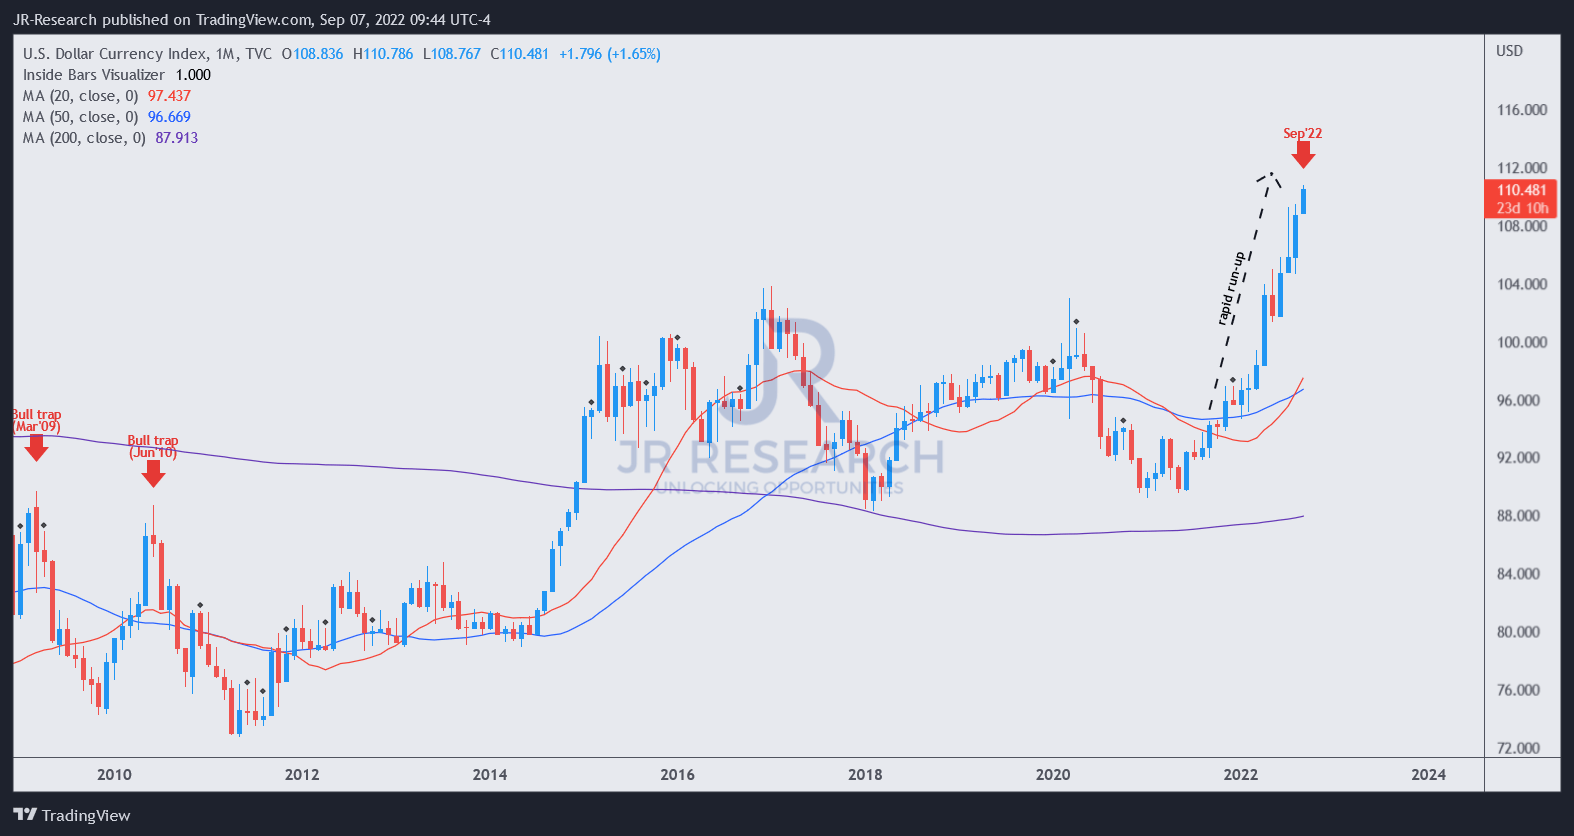
Furthermore, the dollar index has continued to power higher through September, with no signs of stopping yet. Although we are confident its rapid surge is unsustainable and its momentum should reverse, we have yet to see a robust resistance. Hence, we postulate that O could continue to experience near-term downside volatility, given its exposure ex-US.
Realty Income payout ratio % and TTM Dividend yield % consensus estimates (S&P Cap IQ)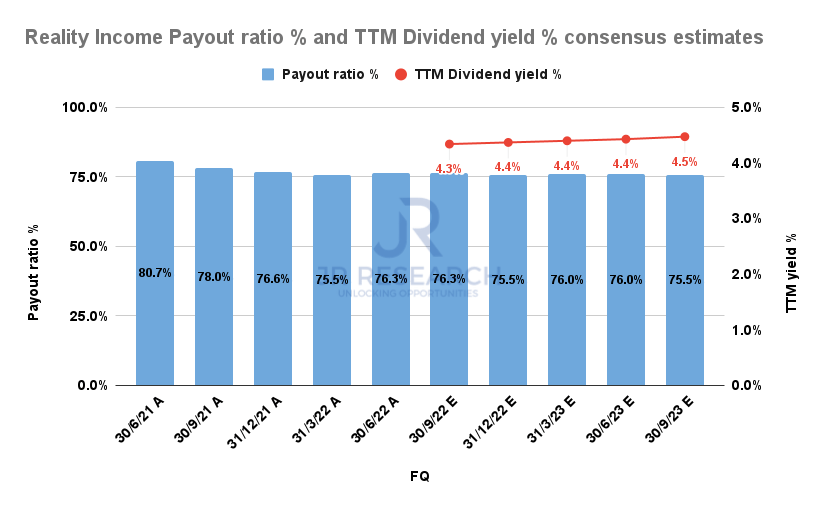
However, income investors should remain assured of the REIT’s ability to deliver its dividends despite the harsh macros, impacting its AFFO per share growth cadence.
Realty Income’s payout ratio is projected to remain within the 75%-76% range through FY23, with its TTM dividend yield within its 10Y mean. Therefore, we surmise that O’s valuation seems pretty well-balanced. However, some caution is still warranted with near-term headwinds from forex and its decelerating AFFO per share growth.
Is O Stock A Buy, Sell, Or Hold?
O price chart (weekly) (TradingView)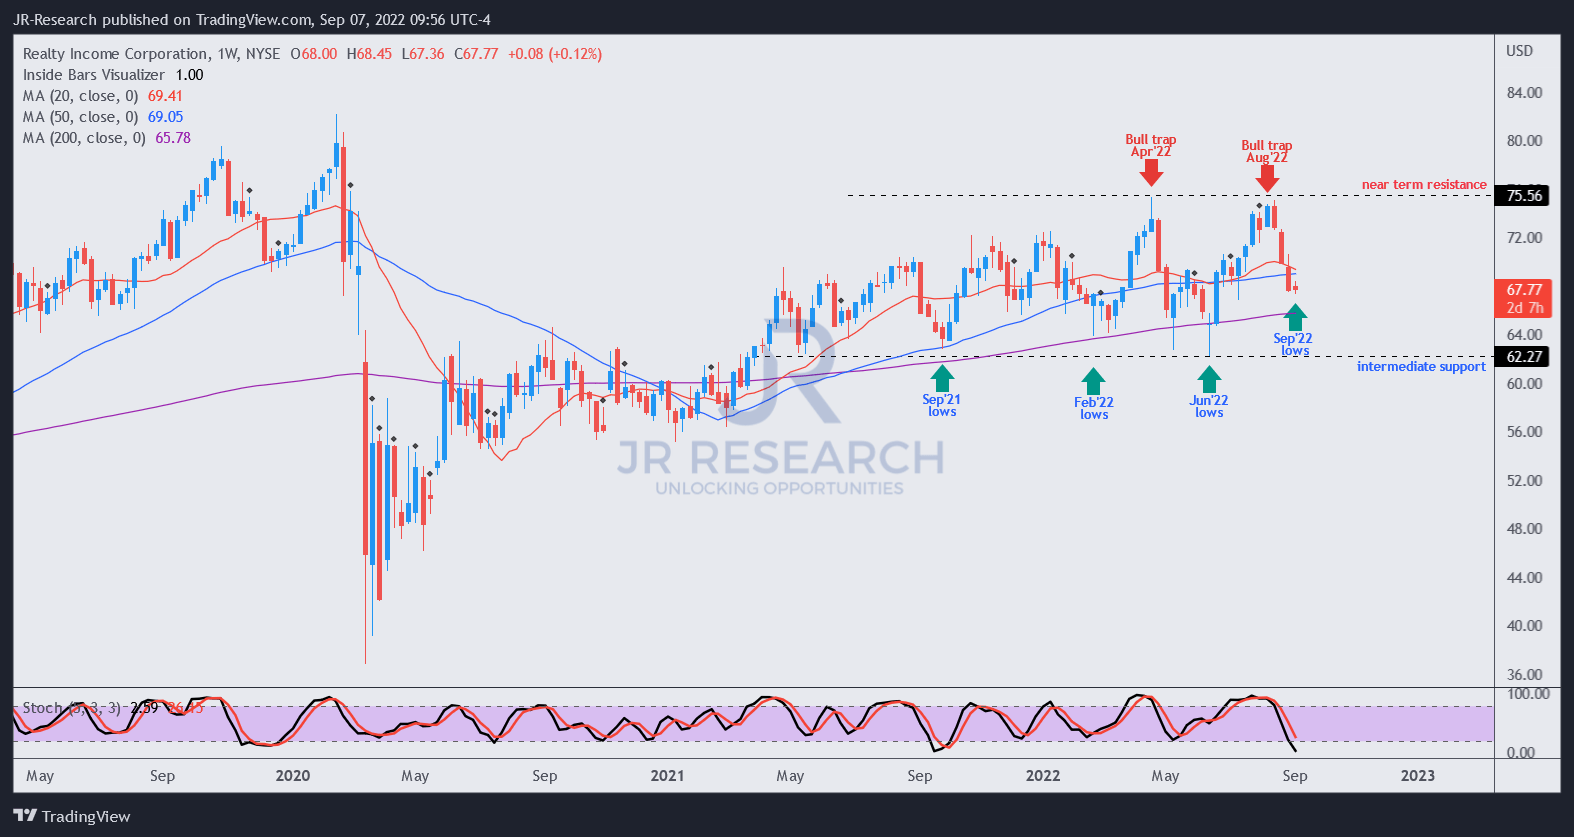
Our price action analysis indicates that O has been in a trading range since the start of 2022. Moreover, its buying upside has faced significant resistance at the $75 level, with two bull traps (indicating the market denied further buying momentum decisively) in April and August.
However, the support zone that has supported its consolidation range since September 2021 at the $62 level seems robust. Therefore, we believe it should offer investors a more reasonable entry point if O falls further and re-tests its $62 support zone successfully.
Notwithstanding, we believe the steep selloff could lead to a potential bottoming process. As a result, investors should parse carefully whether buyers could return to the market to support O’s medium-term bullish bias.
As such, we rate O as a Hold for now. However, we will assess its bottoming process and would consider re-rating it if we observe constructive basing action.
Be the first to comment