

NicholasBPhotography/iStock via Getty Images
Investment Thesis
In January, I began coverage on the little-known Invesco Dynamic Food & Beverage ETF (NYSEARCA:PBJ), predicting it would be a top performer in the category and reaffirming that bullish thesis in April. So far, that’s been the case. PBJ has outperformed the Consumer Staples Select Sector SPDR ETF (XLP) by 5.45% YTD. However, I’d be lying if I said I wasn’t looking for a reason to downgrade. PBJ’s 0.63% expense ratio is too high for most investors, and the ETF’s long-term performance since its June 2005 inception leaves plenty to be desired. Therefore, this article takes a critical look at PBJ’s current portfolio after last month’s reconstitution, and I look forward to presenting its fundamentals.
PBJ Overview
Strategy
PBJ tracks the Dynamic Food & Beverage Intellidex Index, selecting 30 U.S. food and beverage stocks from a more extensive proprietary Index. The parent Index screens for 150 factors in five categories covering:
- price momentum
- earnings momentum
- quality
- management action
- value
Specific factors include a company’s price relative to its 52-week high price, analyst estimate changes, return on assets and equity, buybacks and dividends, and numerous valuation ratios. However, remember that investors don’t always care about fundamentals, and in these years, PBJ tends to underperform. 2009-10 and 2020 are good examples, but as markets normalize, investors inevitably place greater importance on these factors. I think that’s what’s been happening this year for the most part.
Industry Exposures and Top Holdings
PBJ currently invests in 30 stocks across eight GICS industries:
- Packaged Foods & Meats (37.18%)
- Food Distributors (18.43%)
- Food Retail (16.18%)
- Soft Drinks (14.97%)
- Agricultural Products (5.20%)
- Restaurants (2.77%)
- Distillers and Vintners (2.64%)
- Brewers (2.64%)
Except for Restaurants, PBJ exclusively holds Consumer Staples stocks, according to GICS. Its top ten holdings, shown below, total 4.61% and include Archer-Daniels-Midland (ADM), General Mills (GIS), and Kraft Heinz (KHC). Notable exclusions are Procter & Gamble (PG) and Costco Wholesale (COST), whose combined weight in XLP is 25%.
Invesco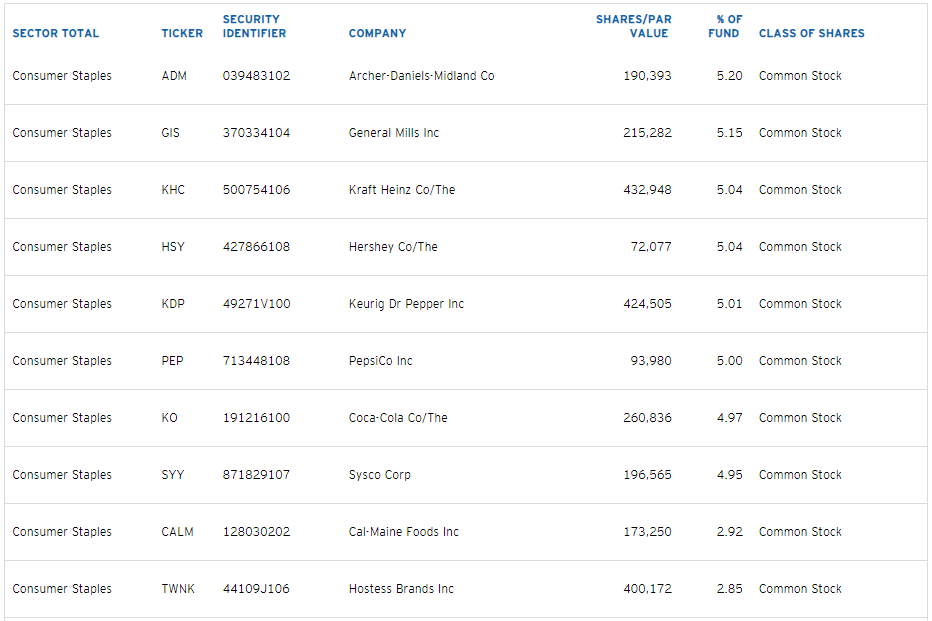
PBJ also includes 16 stocks not in the large-cap XLP, which total 43.57% of the weight. Historically, diversifying your Consumer Staples stocks by size improves returns. The Invesco S&P SmallCap Consumer Staples ETF (PSCC) has outperformed XLP by 1.54% per year since April 2010.
Portfolio Visualizer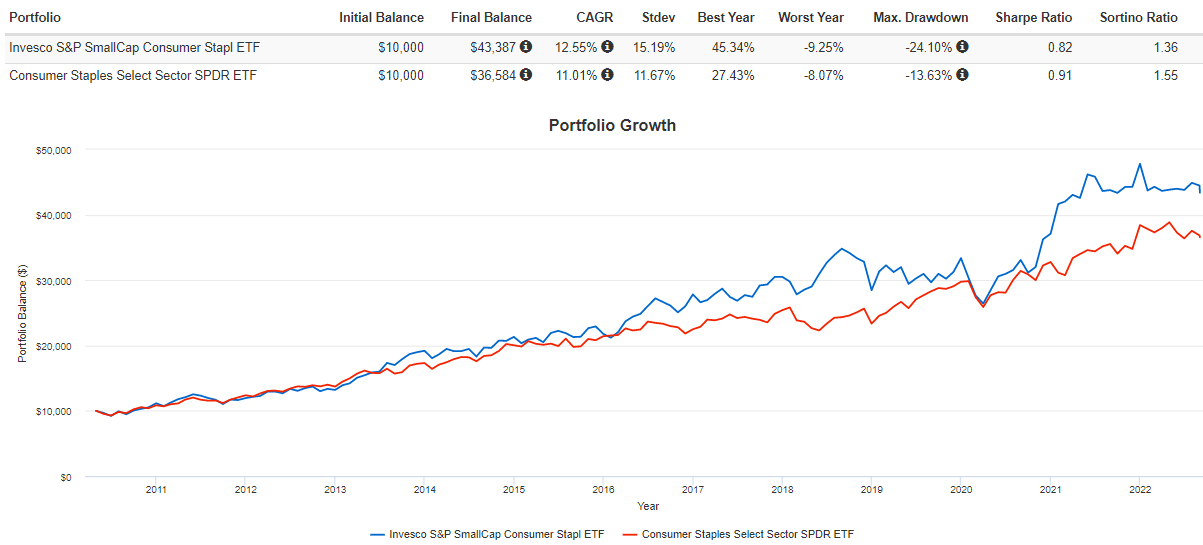
Historical Performance
The following table highlights periodic returns for the 11 Consumer Staples ETFs I track. I’ve sorted them by their six-month trailing returns, showing how PBJ was the best performer.
The Sunday Investor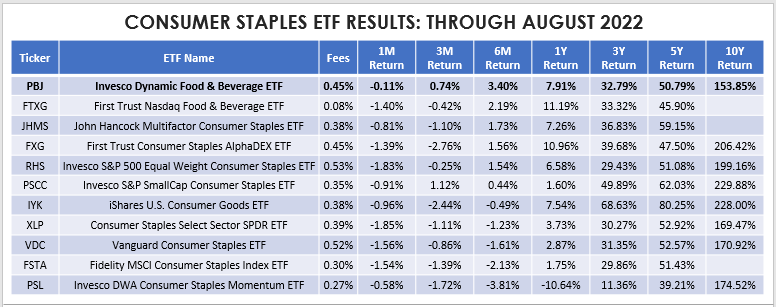
Unfortunately, PBJ is the worst performer out of the seven others with sufficient history. Its 153.85% total return through August 2022 is 76.03% and 15.62% lower than PSCC and XLP, respectively. Indeed, that’s not worth paying 0.63% per year.
The results are even worse when considering risk. While small-cap investors in PSCC have to accept higher volatility to achieve a higher total return, PBJ is more volatile than XLP but with lower returns. This dynamic is summarized nicely by the risk-adjusted return metrics (Sharpe and Sortino Ratios). PBJ’s are the weakest of the three, so it isn’t easy to make a case for PBJ as a buy-and-hold ETF given the alternatives.
Portfolio Visualizer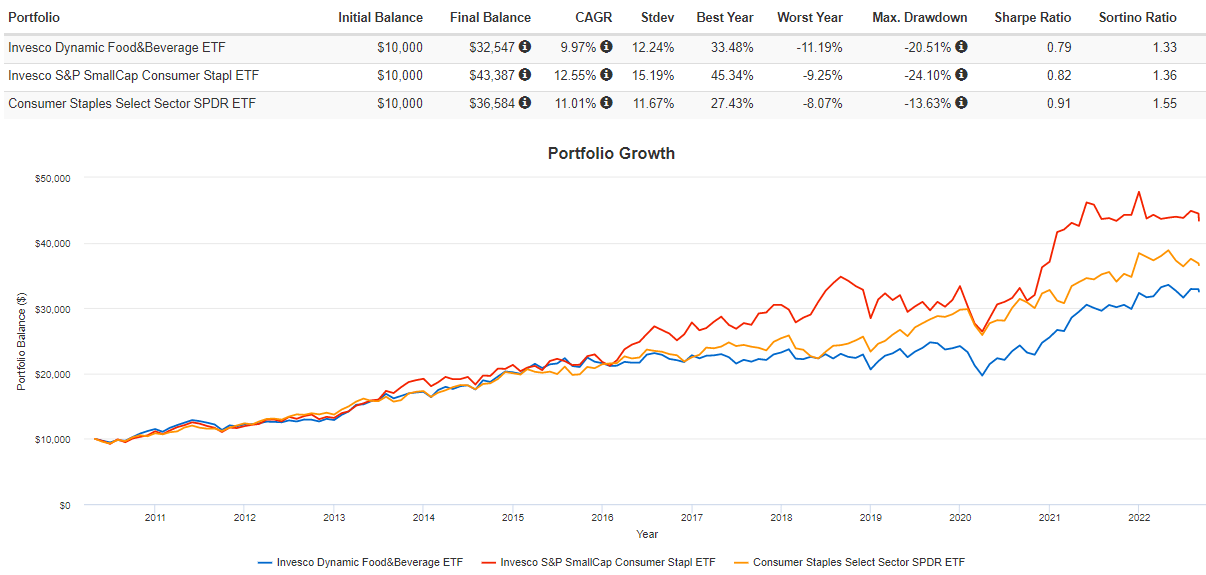
Fundamental Analysis
The first thing I want to do is provide historical returns for PBJ’s current constituents. I feel this step is essential because PBJ typically has a turnover rate exceeding 100%. Even compared to my last review of the ETF in April, I noticed a dozen new names accounting for 37% of the fund.
The Sunday Investor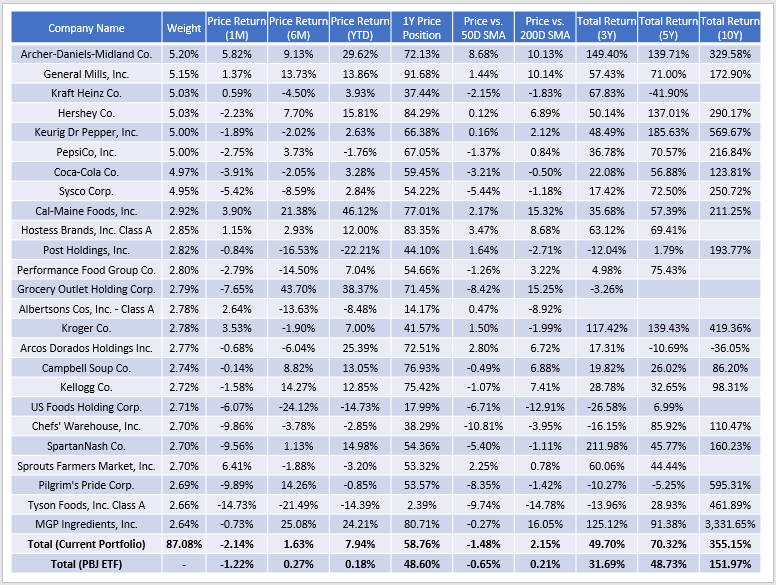
This table includes various price and total return metrics, which we can use to understand the strategy better. In my view, the theme is consistent: PBJ currently holds stocks that performed exceptionally well historically. Look at how well the current portfolio metrics stack up against the metrics the ETF has experienced over the same periods:
- The current portfolio has a weighted-average 7.94% price gain YTD compared to 0.18% for the ETF
- The current portfolio’s constituents are trading at 58.76% between their 52-week high and low prices compared to 48.60% for the ETF
- The current portfolio’s three, five, and ten-year total returns are 18% and 22% better than the ETF.
These metrics suggest the momentum factor is prominent. Over the last five years, top holdings like Archer-Daniels-Midland, Hershey (HSY), and Keurig Dr. Pepper (KDP) were double-baggers. As for other metrics, let’s look at how they compare with XLP and PSCC.
The Sunday Investor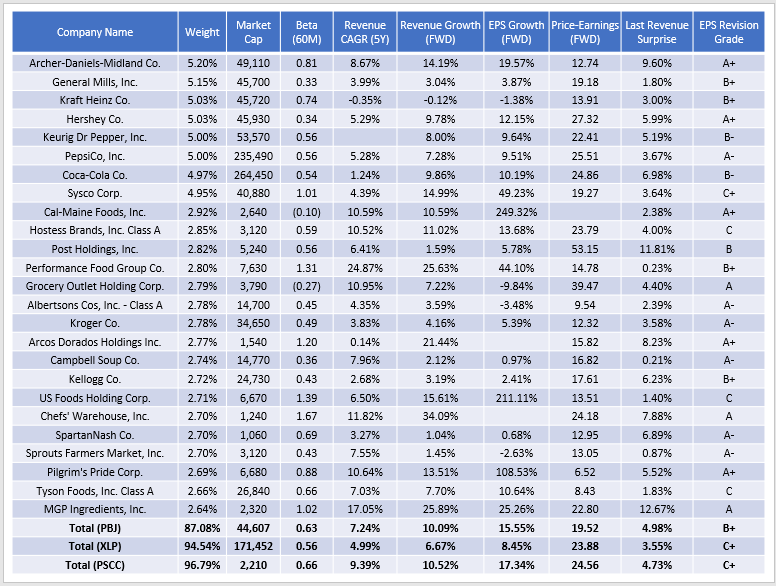
PBJ’s weighted-average market capitalization of $44.6 billion makes it a blend between XLP and PSCC. The same is true for its five-year beta of 0.63, though it’s closer to the small-cap ETF. Still, the sector is known for its defensive protection in bear markets, and all three fit the bill nicely.
PBJ separates itself from XLP when you consider its growth. In the last five years, its constituents have grown sales at an annualized 7.24% rate compared to 4.99% for XLP. Analysts estimate a 10.09% over the next twelve months, which is only slightly behind the 10.52% figure for PSCC. To me, that’s impressive since small-cap stocks are known for their superior growth potential. Finally, PBJ’s estimated EPS growth of 15.55% is nearly double XLP’s. Admittedly, several small caps have excessive and possibly unrealistic estimated growth rates. However, when calculating net metrics for a portfolio, I place 50% caps for growth metrics while valuation ratios are capped at 60, similar to what’s done by providers like Morningstar. It’s necessary to control these outliers, as they can easily skew and misrepresent a portfolio.
These numbers make sense because faster-growing companies should produce the significant returns in the previous table. Furthermore, look at how every one of PBJ’s top 25 constituents achieved a positive revenue surprise last quarter. According to Yardeni Research, the percentage of companies reporting positive sales surprises in the Consumer Staples sector in the previous quarter was only 78.6%, 76.9%, and 81.2% for the small-cap, mid-cap, and large-cap segments. Also, PBJ’s weighted-average Seeking Alpha grade of B+ is stronger than the C+ Grades for XLP and PSCC. PBJ has momentum, but the reasons are clear and not some mispricing for which the market will soon correct.
Investment Recommendation
After considering last month’s reconstitution, I’m reiterating my buy recommendation on PBJ. Its fundamentals are strong, specifically on growth and valuation, and although the portfolio is momentum-based, the momentum should continue. All top holdings had positive sales surprises last quarter, Wall Street analysts largely support them, and have excellent long-term track records. My main issue is the 0.63% expense ratio, but if you can get past that and are willing to keep tabs on this ETF each quarter, I think it’s an excellent short-term trade.
Be the first to comment