

photostockam/iStock via Getty Images
Editor’s note: Seeking Alpha is proud to welcome Eric Archambault as a new contributor. It’s easy to become a Seeking Alpha contributor and earn money for your best investment ideas. Active contributors also get free access to SA Premium. Click here to find out more »
As most investors are aware, the price/earnings ratio (P/E) is a widely used profitability indicator. It is used to quickly assess value and get a sense of whether securities, indexes, and exchange traded funds (ETFs) are priced fairly. It is noteworthy that the P/E of ETFs’ aggregate holdings is usually calculated by omitting losses. Yes, that’s right: Bad news is omitted when valuing ETFs. What could possibly go wrong?
To investigate the limits of using P/Es for a quick and dirty valuation of ETFs, I painstakingly compiled the ETF holdings (number of shares) and triangulated share prices and earnings per share (EPS) from numerous sources for 15 ETFs as of Sept. 23, 2022. This included 10 sector SPDRs, the SPDR S&P 500 ETF (SPY), and four ARK ETFs valued over $1 billion each.
Unsurprisingly, the proportion of profitable companies varies greatly between sectors and across ETFs. While all the companies in the Financial Select Sector SPDR ETF (XLF) and Consumer Staples Select Sector SPDR (XLP) are profitable, 12% of companies in the Communication Services Select Sector SPDR ETF (XLC) and 9% in the Consumer Discretionary Select Sector SPDR (XLY) are not. The proportion of profitable companies in these four ARK ETFs is substantially, and perhaps alarmingly, smaller. Only 61% of companies are profitable at best, and as little as 15% in the case of the ARK Innovation ETF (ARKK).
Because of sizable variations in the number of omitted or included data points, there is a tangible difference between the restrictive P/E (comprising only earnings and price from profitable companies) and the comprehensive ETF. For example, in the XLY and the Industrial Select Sector SPDR (XLI) ETFs, there is a difference of about 20% between the restrictive and the comprehensive P/E. As can be seen in the table below, comparing the profitability of all these ETFs shows the challenge of interpreting P/E scores, especially if these are calculated by rightly including unprofitable companies. A low positive P/E denotes greater profitability (9.2 is better than 30.4), but there is an inversion with negative P/Es (-3.8 is worse than -97.7).
Author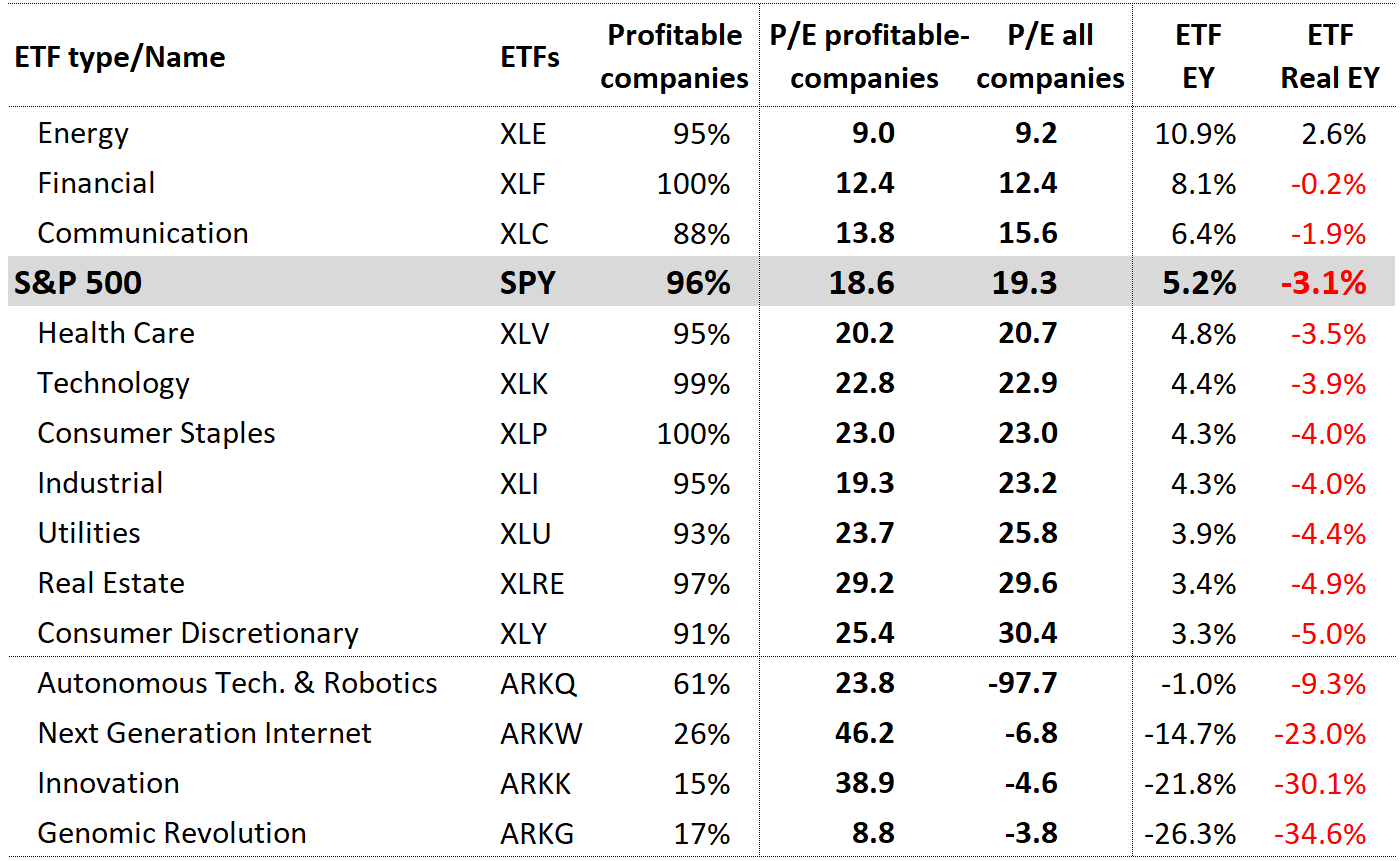
Source: ETF earnings yields calculated by the author using stock tickers and number of shares held from State Street and ARK, in addition to share price and earning per share data from Alpha Vantage, Barchart, Google Finance, Refinitiv, and Yahoo Finance. Numbers are as of market close Sept. 23, 2022.
A mathematically more robust – because of scores that follow a simpler, continuous distribution from the highly profitable to the highly unprofitable – and more intuitive metric is offered by earnings yields (EYs). Instead of dividing price per earning as in the case of the P/E, this metric does the inverse: dividing earnings by price (1 divided by P/E = EY). Expressed as a percentage, EY scores resemble other economic and financial indicators, which is convenient for comparisons. For instance, with the U.S. Customer Price Index (CPI) currently at 8.3%, every ETF examined here appears pricey, especially when one could rely instead on the comfort of treasuries yielding above 4%.
Subtracting the one-year CPI from the trailing 12 months EY shows that out of 15 ETFs examined here, only the Energy Select Sector SPDR (XLE) has a positive real earnings yield (REY). The veteran SPDR S&P 500 ETF currently stands at minus 3.1%, the lowest negative real yield seen in 60 years. Another real earnings yield that testifies to the exceptional character of the period we are in is the real federal funds rate, which hasn’t been this low in more than 60 years.
Author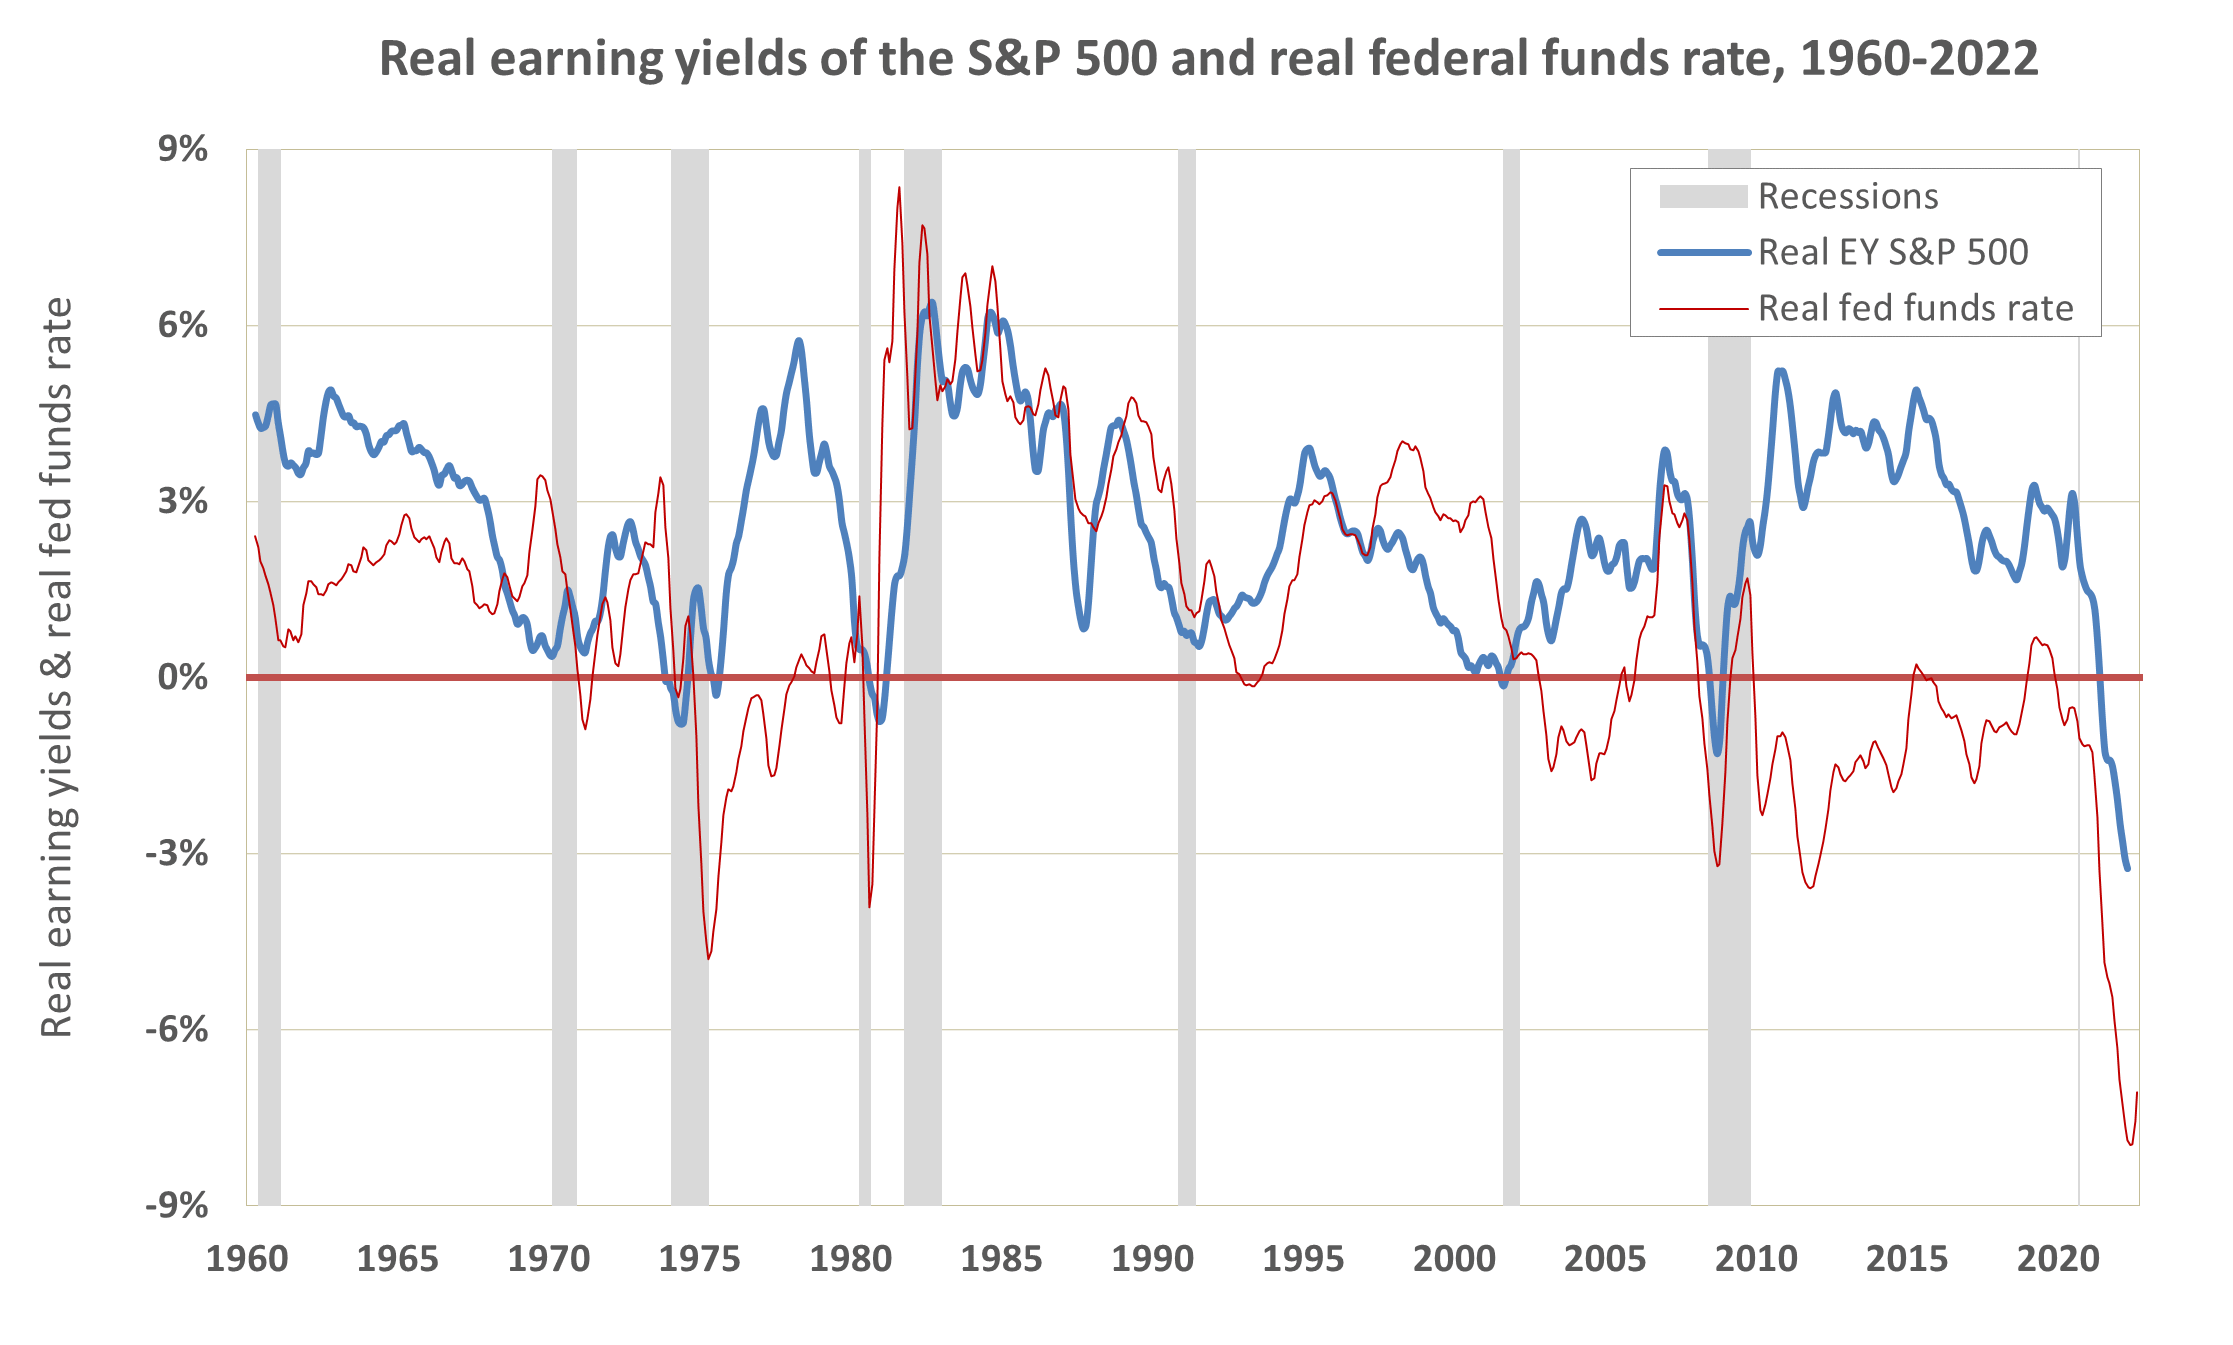
Source: Real S&P 500 calculated by the author using Robert J. Shiller’s stock market data used in “Irrational Exuberance,” Princeton University Press, 2000, 2005, 2015, updated; Federal Reserve Economic Data (FRED), Federal Reserve Bank of St. Louis, Economic Research Division: USREC.
Examining the REY of these ETFs reveals there are few places to hide. Traditionally safer sectors such as that offered by the Utilities Select Sector SPDR (XLU) or the Consumer Staples Select Sector SPDR (XLP) have REYs of -4%. Assuming that earnings don’t plunge and that the CPI does not budge either, the customer discretionary (XLY) and the Real Estate Select Sector SPDR (XLRE) would need to come down in price some 50% for earnings yields to cancel out inflation. If inflation comes down, there would be lower pressure on the downward price of ETFs. However, it is very likely that reducing inflation will be associated with lower spending, and if this happens it will bite into consumer discretionary and real estate firms’ earnings. Whichever way we look at it, considering the historically low yield of the stock market, returning to positive real yields will be associated with a painful downside.
The way that the profitability of ETFs is currently being presented is akin to selling a second-hand car by saying it’s in excellent condition, but omitting from this description its long-gone engine and worn-out transmission. This situation is unacceptable considering that ETFs are worth more than $6 trillion in the U.S. alone. Excluding loss-making companies when calculating earnings is confusing at best. Their omission hides the risks associated with ETFs full of unprofitable companies, a critical piece of information when inflation is high, money is becoming costlier, and economic conditions are likely to worsen. In this context, it would be useful for ETF issuers to declare the percentage of unprofitable companies in their holdings and to provide more robust and transparent metrics based on comprehensive EYs and REYs.
Be the first to comment