

SunChan/E+ via Getty Images
This article was co-produced with Dividend Sensei.
Warren Buffett is a big fan of buying “Wonderful companies at fair prices.”
But what is a wonderful company exactly?
A world-beater blue-chip, an industry leader with superior management, products, and an adaptable and resilient corporate culture qualifies.
One of my favorite things is bringing world-beater blue-chip ideas in bear markets that can deliver life-changing, long-term rich retirement results.
The only thing better is when those world-beater blue chips are hidden gem dividend Super SWANs (sleep well at night) companies you’ve probably never considered.
How can a company be a hidden gem and a world-beater simultaneously? Aren’t all world-beaters giant companies everyone and their mother has heard of?
Raymond James Financial (NYSE:RJF) is a great example of how one of the world’s best hyper-dividend growth Super SWANs can be a company you’ve never heard of or considered for your portfolio.
And as I’ll now show you, there are three reasons why you most definitely should.
Reason One: Raymond James Is A Hidden Gem World-Beater
RJF has been soaring in this Pandemic, closely tracking its historical fair value PE of 14.8.
-
73% EPS growth in 2021
-
6% growth in 2022 (during the 14th worst bear market in history)
-
30% growth in 2023 (recession year)
-
11% growth in 2024
-
1% growth in 2025
How on earth can a financial company, much less an asset manager, defy market gravity in a recessionary bear market? How can an asset manager who collects fees from AUM thrive when stocks and bonds are down double-digits for the first time in history?
What Raymond James Does
Raymond James was founded in St. Petersburg, Florida, in 1962.
“It operates through the following segments: Private Client Group, Capital Markets, Asset Management, RJ Bank, and Others.
The Private Client Group segment deals with financial planning and securities transaction services.
The Capital Markets segment pertains to institutional sales, securities trading, equity research, and investment banking activities.
The Asset Management segment offers investment advisory to individual and institutional portfolios.
The RJ Bank segment includes corporate loans, mortgages, and loan syndications.
The Other segment consists of principal capital and private equity operations.” – FactSet
RJF is a highly diversified financial company with its fingers in every part of the financial system. From securities and loan underwriting, to private equity, to ultra-high-net-worth financial planning and running home offices for billionaires.
RJF is one of the most impressive asset managers most people have never heard of:
- $1.25 trillion in assets under administration
- almost 9,000 advisors in the US, Canada, and the UK
- 138 consecutive quarters of profitability (35 years, every year since 1987)
- including during the Great Recession, Pandemic, Tech crash, and 1990 recessionary bear market
- more than 2X the regulatory capital requirements
- A-rated by Fitch and Moody’s, BBB+ positive outlook by S&P
- 2.5% to 5% 30-year default risk
The balance sheet is a fortress with $23 billion in cash, $3 billion in debt, and $27 billion in liquidity.
-
thus, the reason RJF can opportunistically buy so many companies in this bear market
How strong is this balance sheet? Very strong, as you can see not just from its credit ratings and mountain of cash on the balance sheet but also from its capital ratios.
- Tier 1 capital ratio: 24% = 3X regulatory minimum of 8%
- total capital ratio: 25% = 2.5X regulatory minimum of 10%
- Tier 1 leverage ratio: 11.1% = more than 2X regulatory minimum of 5%
In fact, among its six largest peers, RJF has the best capital ratios, above management’s goal of a tier 1 leverage ratio of 10%.
80% of revenue comes from wealth management, which is much more stable than capital markets, which suffer during recessions. Here’s how RJF makes its revenue:
- 67% private client group
- 19% capital markets
- 9% asset management
- 7% banking
It’s also benefiting from rising rates to earn a higher net interest margin on cash float positions.
-
$77 billion in customer cash accounts earning rising rates for RJF as the Fed hikes.
It’s also an aggressive acquirer of other companies including in recent years:
- Charles Stanley: UK wealth manager with $50 billion in AUM founded in 1792
- TriState Capital: The 5th largest bank in Pittsburgh ($1.1 billion deal), $12.2 billion in deposits
- SumRidge Partners: Fintech specializing in fixed-income trading
“Adding SumRidge and its innovative institutional market-making operation and sophisticated trading technologies to our Fixed Income Capital Markets division is another example of our commitment to serving advisors and clients through industry-leading technology.”
Most of these acquisitions are relatively small-tuck acquisitions that are about 5% of RJF’s size.
-
large enough to move the needle but not so large as to risk the company failing if the deals don’t go well
RJF has an excellent track record of acquiring small specialized boutique financial companies and fintech and successfully integrating it into their overall offering mix.
-
20 acquisitions since 1999
-
averaging nearly one per year
It has acquired companies that are experts in the future of the financial industry and global economy including in fields like:
- artificial intelligence
- augmented reality
- robotics
- zero-day (instant) financial transaction settlement
- blockchain
- cloud computing machine-learning analytics (data lake)
RJF’s combination of supreme product quality and smart M&A has helped it to grow at an industry-leading rate over the last decade:
- revenue growth of 11% CAGR
- assets under administration 17% CAGR
- EPS growth of 16% CAGR
Its dividend yield of 1.1% might not seem impressive, but RJF isn’t a shower; it’s a dividend grower.
- 10 consecutive years of dividend growth
- 32 years without a dividend cut (since it began paying one in 1990)
RJF has been growing its dividend at 13% annually for the last 20 years while delivering market-smashing 17% annual returns.
-
analyst consensus 17% CAGR dividend growth through 2025
50% is a safe payout ratio for this industry, according to rating agencies, and RJF’s payout ratio is a very safe 17% this year and has never gone above 34%, even in the Great Recession.
In the first half of 2022, RJF’s industry-leading growth has continued:
- revenue growth +19%
- EPS growth +14%
- client assets under administration +16%
RJF is a one-stop-shop for wealth management, serving every need for rich clients, from company research to investment banking, funding, or investing in private equity deals.
How successful is RJF?
Its private client business, 67% of revenue and almost 60% of earnings, is the 6th largest wealth manager in America with $700 billion in assets earnings fees for RJF.
RJF is a great company to work for; its advisor retention rate is over 99%.
Private client revenue growth has been 14% annually over the last five years, thanks to a 22% growth in fee-based accounts.
- over the last 10 years, client assets under custody have grown 310% vs. 160% for its peers
- 2X the growth rate of its industry
In the last five years, profits from private clients have been growing by 17%, and 23% in the first half of 2022.
RJF’s profitability is historically in the top 30% of its peers, but in recent years it’s improved even more to truly spectacular proportions.
- free cash flow margins of 68% (top 1% of all companies on earth)
- cash return on invested capital 78%
RJF is overseen by CEO Paul Reilly, that joined the company in 2009 and has been in the top job since 2010.
Its chairman is Thomas James, the son of the company founder, who has been with the company for 40 years.
RJF’s capital allocation priorities are reasonable and prudent:
- organic growth
- M&A driven growth
- dividend growth (20% to 30% EPS payout ratio target vs. 50% industry safety guideline)
- buybacks offsetting stock-based comp
- opportunistic buybacks
RJF’s capital return program is highly shareholder friendly.
- $2.4 billion over the last six years
- buybacks are most aggressive when the stock price is low
- $750 million buybacks in 2019 = approximately 10% of shares
Bottom Line: RJF Is One of The Best Hidden Gem Hyper-Dividend Growth SWANs You’ve Never Heard Of
Reasons To Potentially Buy RJF Today
|
Metric |
Raymond James |
|
Quality |
98% 12/13 Super SWAN (Sleep Well At Night) Asset Manager |
|
Risk Rating |
Medium Risk |
|
DK Master List Quality Ranking (Out Of 500 Companies) |
30 |
|
DK Master List Quality Percentile |
94% |
|
Dividend Growth Streak (Years) |
10 |
|
Dividend Yield |
1.1% |
|
Dividend Safety Score |
100% |
|
Average Recession Dividend Cut Risk |
0.5% |
|
Severe Recession Dividend Cut Risk |
1.00% |
|
S&P Credit Rating |
BBB+ Positive Outlook |
|
30-Year Bankruptcy Risk |
5.00% |
|
LT S&P Risk-Management Global Percentile |
54% Average, Medium-Risk |
|
Fair Value |
$124.76 |
|
Current Price |
$121.59 |
|
Discount To Fair Value |
3% |
|
DK Rating |
Potential Reasonable Buy |
|
PE |
12.3 |
|
Growth Priced In |
7.6% |
|
Historical PE |
14 to 15 |
|
LT Growth Consensus/Management Guidance |
19.6% |
|
PEG Ratio |
0.63 (hyper-growth at a wonderful price) |
|
5-year consensus total return potential |
15% to 20% CAGR |
|
Base Case 5-year consensus return potential |
17% CAGR (4X the S&P 500) |
|
Consensus 12-month total return forecast |
6% |
|
Fundamentally Justified 12-Month Return Potential |
4% |
|
LT Consensus Total Return Potential |
20.7% vs 10.3% S&P |
|
Inflation-Adjusted Consensus LT Return Potential |
18.4% |
|
Consensus 10-Year Inflation-Adjusted Total Return Potential (Ignoring Valuation) |
5.40 |
|
LT Risk-Adjusted Expected Return |
13.77% |
|
LT Risk-And Inflation-Adjusted Return Potential |
11.44% |
|
Conservative Years To Double |
6.30 |
(Source: DK Zen Research Terminal)
RJF represents dividend hyper-growth at a wonderful price, trading at just 12.3X earnings. It’s priced for 7.6% growth but analysts expect closer to 20% in the future (11% to 23% range).
Raymond James 2025 Consensus Total Return Potential
FAST Graphs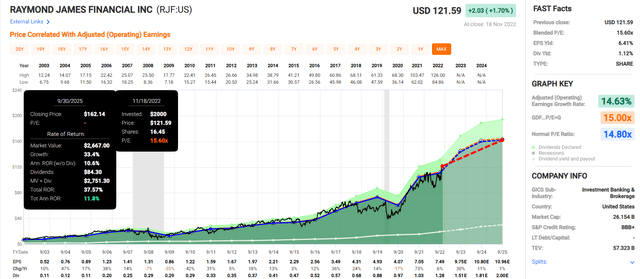
If RJF grows as expected through 2025 and stays at market-determined fair value, analysts expect around 40% total returns or 12% annually.
Raymond James 2029 Consensus Total Return Potential
FAST Graphs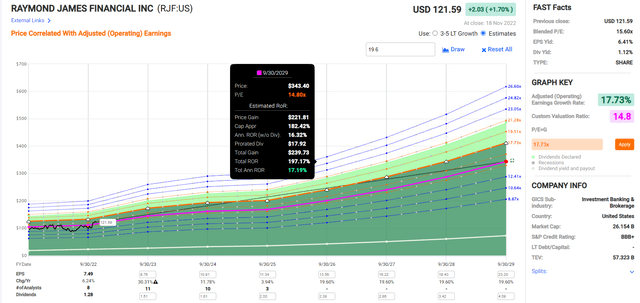
If RJF grows as expected through September 2029 and stays at historical fair value, it could triple, delivering Buffett-like 17% annual returns for the next seven years.
Raymond James Investment Decision Tool
Dividend Kings Dividend Kings
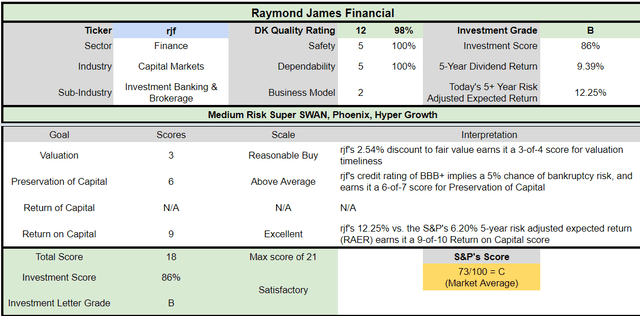
RJF is a potentially satisfactory and reasonable hyper-dividend growth SWAN opportunity for anyone comfortable with its risk profile. Look at how it compares to the S&P 500.
-
3% discount to fair value vs. 3% premium S&P = 6% better valuation
-
1.1% very safe yield vs. 1.8% (but growing 3X as fast)
-
approximately 2X long-term annual return potential
-
about 2X higher risk-adjusted expected returns
Reason Two: Exceptional Long-Term Growth Potential
RJF is currently priced for 7.6% CAGR long-term growth, but here is what analysts actually expect.
|
Metric |
2021 Growth Consensus |
2022 Growth Consensus (bear market) |
2023 Growth Consensus (recession) |
2024 Growth Consensus |
2025 Growth Consensus |
|
Sales |
20% |
12% |
4% |
12% |
7% |
|
Dividend |
5% |
31% |
17% |
18% |
16% |
|
EPS |
73% |
6% |
30% |
11% |
1% |
|
EBIT (operating income) |
37% |
21% |
12% |
10% |
NA |
|
Book Value Per Share |
15% |
13% |
11% |
13% |
8% |
(Source: FAST Graphs, FactSet)
Based on its fundamentals, you can’t even tell that we’re in a bear market and headed for a recession.
Long-Term Growth Outlook
Based on nine out of 13 analysts the long-term growth consensus is 19.6%, an acceleration in growth compared to the last five year’s 14.5% CAGR.
How accurate are analyst forecasts for RJF?
Within a reasonable 20% margin of error for two-year forecasts:
-
RJF misses estimates 8% of the time
-
beats estimates 33% of the time
-
meets expectations 58% of the time
Smoothing for outliers, historical analyst margins of error are 10% to the downside and 20% to the upside.
-
11% to 23% historical/margin-of-error adjusted growth consensus range
Over the last 20 years RJF has grown at between 11% and 20% CAGR and analysts are currently very bullish, expecting growth near the upper end of the historical range.
The average rolling 15-year EPS growth rate since 1988 is 14.5% CAGR, which I consider a reasonable rate to expect in the future.
|
Investment Strategy |
Yield |
LT Consensus Growth |
LT Consensus Total Return Potential |
Long-Term Risk-Adjusted Expected Return |
Long-Term Inflation And Risk-Adjusted Expected Returns |
Years To Double Your Inflation & Risk-Adjusted Wealth |
10-Year Inflation And Risk-Adjusted Expected Return |
|
Raymond James |
1.1% |
19.6% |
20.7% |
14.5% |
12.2% |
5.9 |
3.15 |
|
Raymond James (My Estimate) |
1.1% |
14.5% |
15.6% |
10.9% |
8.6% |
8.4 |
2.28 |
|
Nasdaq |
0.8% |
11.8% |
12.6% |
8.8% |
6.5% |
11.0 |
1.88 |
|
Schwab US Dividend Equity ETF |
3.6% |
8.5% |
12.1% |
8.4% |
6.1% |
11.8 |
1.81 |
|
Dividend Aristocrats |
2.6% |
8.5% |
11.1% |
7.8% |
5.4% |
13.2 |
1.70 |
|
S&P 500 |
1.8% |
8.5% |
10.3% |
7.2% |
4.9% |
14.8 |
1.61 |
(Source: DK Research Terminal, FactSet, Morningstar, Ycharts)
Analysts think RJF could double the market’s long-term returns, and I think around 15% to 16% long-term historical returns are more likely.
-
RJF could run circles around the S&P, aristocrats, SCHD, and even the Nasdaq
Historical Returns Since 1988
Over the last 34 years, RJF delivered a 20% annual Buffett-like return and a 549X return.
RJF is a 213X bagger adjusted for inflation, with more than 16X better real returns than the S&P 500.
RJF’s average 12-month return since 1988 has been a spectacular 24% CAGR.
- average three-year return: 19.4% CAGR
- average five-year return: 18% CAGR
- average seven-year return: 17.4% CAGR
- average 10-year return: 16.9% CAGR
- average 15-year return: 15.7% CAGR vs 8.1% S&P
Basically RJF has been doubling the market’s long-term returns across economic and industry cycles for 34 years and that’s what analysts expect to continue.
Reason Three: A Buffett-Style Wonderful Company At A Fair Price
For 20 years, outside of bear markets and bubbles, millions of investors have paid 14X to 15X earnings for RJF.
-
a 91% statistical probability this range includes historical fair value
|
Metric |
Historical Fair Value Multiples (all-Years) |
2021 |
2022 |
2023 |
2024 |
2025 |
12-Month Forward Fair Value |
|
13-Year Median Yield |
1.25% |
$88.80 |
$108.80 |
$108.80 |
$144.00 |
$166.40 |
|
|
Earnings |
14.80 |
$104.34 |
$119.29 |
$148.74 |
$161.47 |
$167.83 |
|
|
Average |
$95.94 |
$113.80 |
$125.67 |
$152.23 |
$167.11 |
$124.76 |
|
|
Current Price |
$121.59 |
||||||
|
Discount To Fair Value |
-26.73% |
-6.84% |
3.25% |
20.13% |
27.24% |
2.54% |
|
|
Upside To Fair Value (including dividend) |
-21.09% |
-6.40% |
3.36% |
25.20% |
37.44% |
3.73% |
|
|
2022 EPS |
2023 EPS |
2022 Weighted EPS |
2023 Weighted EPS |
12-Month Forward EPS |
Historical Average Fair Value Forward PE |
Current Forward PE |
Current Forward Cash-Adjusted PE |
|
$8.06 |
$10.05 |
$0.62 |
$9.28 |
$9.90 |
12.6 |
12.3 |
NA |
To be extra conservative, we also include the 13-year median yield fair value to estimate that RJF is about 3% undervalued at 12.3X forward earnings.
No long-term investor in history who avoided becoming a forced seller for emotional or financial reasons has ever regretted paying 12.3X forward earnings for RJF.
-
I can say with 80% statistical confidence that this won’t be the first time
|
Rating |
Margin Of Safety For Medium Risk 12/13 Super SWAN Quality Companies |
2022 Fair Value Price |
2023 Fair Value Price |
12-Month Forward Fair Value |
|
Potentially Reasonable Buy |
0% |
$113.80 |
$125.67 |
$124.76 |
|
Potentially Good Buy |
10% |
$102.42 |
$113.11 |
$112.28 |
|
Potentially Strong Buy |
20% |
$91.04 |
$100.54 |
$99.81 |
|
Potentially Very Strong Buy |
30% |
$71.70 |
$87.97 |
$87.33 |
|
Potentially Ultra-Value Buy |
40% |
$68.28 |
$75.40 |
$74.86 |
|
Currently |
$121.59 |
-6.84% |
3.25% |
2.54% |
|
Upside To Fair Value (Including Dividends) |
-5.29% |
4.48% |
3.73% |
For anyone comfortable with its risk profile, RJF is a potentially reasonable buy.
-
a classic Buffett-style “wonderful company at a fair price”
Risk Profile: Why Raymond James Isn’t Right For Everyone
There are no risk-free companies, and no company is right for everyone. You have to be comfortable with the fundamental risk profile.
Risk Profile Summary
“Cyclical factors that can decrease near- to medium-term earnings include a drop in asset prices, normalizing credit costs, and a recession accompanied by a drop in interest rates. With approximately 80% of the company’s revenue coming from its wealth- and asset-management businesses, any downturn in asset prices will have a material effect on revenue and earnings.
Bank loan losses can often unexpectedly spike. Almost all U.S. banks booked exceptionally low losses on their loans until 2020 and the COVID-19 pandemic. With Raymond James’ bank being leveraged to short-term interest rates, the decline in U.S. interest rates to combat the recession and economic stress leading to loan losses caused the banking segment’s profitability to decline sharply.
Raymond James has moderate exposure to environmental, social, and governance risks. The largest social issue for Raymond James and many other investment banks is the ability to attract and retain high-quality talent. Additionally, many investment banks are notorious for their long work hours.
This is factored into our model in a relatively high compensation ratio. Investment banks and wealth-management firms can often have product governance issues stemming from their trading operations. Regulatory fines and litigation expenses are a normal part of the business that we generally incorporate into our valuation model.
Given these risks, our uncertainty rating for Raymond James is high.”
RJF’s Risk Profile Summary
-
economic cyclicality risk: earnings can drop during recessions (42% in the GFC and 17% in the Pandemic)
-
M&A execution risk: acquisitions are core to its growth plan
-
brand risk: scandal risk could harm customer trust
-
loan loss risk during recessions: (it’s growing its banking business)
-
disruption risk: fintech could disrupt traditional asset management (thus RJF’s heavy investments into that space)
-
margin compression risk: RJF competes with 782 major global rivals including titans like Fidelity, BlackRock, and Vanguard
-
talent retention risk in the tightest job market in 50 years (still)
-
currency risk as its international businesses grow (93% of sales from the US currently)
-
interest rate sensitivity risk: if rates go back to zero it could serve as a modest headwind for growth
NY Fed, CNBC, DK S&P 500 Valuation Tool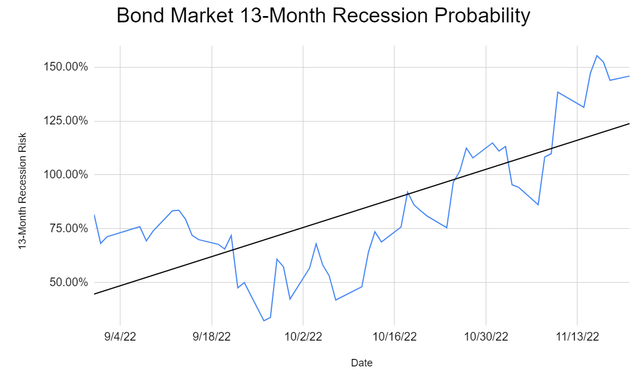
The bond market is 100% confident that we’re getting a recession next year.
How can a 13-month recession risk be over 100%?
-
the bond market is pricing in a 100% risk of recession earlier than 13 months
How early?
18 economic indicators point to a potential recession beginning in four to five months.
-
March to April
-
agreeing with UBS and Goldman Sachs
How do we quantify, monitor, and track such a complex risk profile? By doing what big institutions do.
Long-Term Risk Management Analysis: How Large Institutions Measure Total Risk Management
See the risk section of this video to get an in-depth view (and link to two reports) of how DK and big institutions measure long-term risk management by companies
DK uses S&P Global’s global long-term risk-management ratings for our risk rating.
-
S&P has spent over 20 years perfecting their risk model
-
which is based on over 30 major risk categories, over 130 subcategories, and 1,000 individual metrics
-
50% of metrics are industry specific
-
this risk rating has been included in every credit rating for decades
The DK risk rating is based on the global percentile of how a company’s risk management compares to 8,000 S&P-rated companies covering 90% of the world’s market cap.
RJF Scores 54th Percentile On Global Long-Term Risk Management
S&P’s risk management scores factor in things like:
-
supply chain management
-
crisis management
-
cyber-security
-
privacy protection
-
efficiency
-
R&D efficiency
-
innovation management
-
labor relations
-
talent retention
-
worker training/skills improvement
-
customer relationship management
-
climate strategy adaptation
-
corporate governance
-
brand management
RJF’s Long-Term Risk Management Is The 303rd Best In The Master List (39th Percentile In The Master List)
|
Classification |
S&P LT Risk-Management Global Percentile |
Risk-Management Interpretation |
Risk-Management Rating |
|
BTI, ILMN, SIEGY, SPGI, WM, CI, CSCO, WMB, SAP, CL |
100 |
Exceptional (Top 80 companies in the world) |
Very Low Risk |
|
Strong ESG Stocks |
86 |
Very Good |
Very Low Risk |
|
Foreign Dividend Stocks |
77 |
Good, Bordering On Very Good |
Low Risk |
|
Ultra SWANs |
74 |
Good |
Low Risk |
|
Dividend Aristocrats |
67 |
Above-Average (Bordering On Good) |
Low Risk |
|
Low Volatility Stocks |
65 |
Above-Average |
Low Risk |
|
Master List average |
61 |
Above-Average |
Low Risk |
|
Dividend Kings |
60 |
Above-Average |
Low Risk |
|
Hyper-Growth stocks |
59 |
Average, Bordering On Above-Average |
Medium Risk |
|
Dividend Champions |
55 |
Average |
Medium Risk |
|
Raymond James |
54 |
Average |
Medium Risk |
|
Monthly Dividend Stocks |
41 |
Average |
Medium Risk |
(Source: DK Research Terminal)
RJF’s risk-management consensus is in the bottom 39% of the world’s highest quality companies and similar to that of such other blue chips as
-
NextEra Energy (NEE): Super SWAN dividend aristocrat
-
Dover (DOV): Ultra SWAN dividend king
-
Prudential Financial (PRU): SWAN quality insurance giant
-
Polaris (PII): Ultra SWAN dividend champion
-
Brown-Forman (BF.B): Ultra SWAN dividend aristocrat
The bottom line is that all companies have risks, and RJF is average at managing theirs according to S&P.
How We Monitor RJF’s Risk Profile
-
13 analysts
-
three credit rating agencies
-
16 experts who collectively know this business better than anyone other than management
“When the facts change, I change my mind. What do you do, sir?”
– John Maynard Keynes
There are no sacred cows at iREIT or Dividend Kings. Wherever the fundamentals lead, we always follow. That’s the essence of disciplined financial science, the math behind retiring rich and staying rich in retirement.
Bottom Line: Raymond James Is A Hidden Gem Hyper-Dividend Growth SWAN
Let me be clear: I’m not calling the bottom in RJF (I’m not a market-timer).
Sleep Well At Night doesn’t mean “can’t fall hard or fast in a bear market.”
Fundamentals are all that determine safety and quality, and my recommendations.
-
over 30+ years, 97% of stock returns are a function of pure fundamentals, not luck
-
in the short term; luck is 25X as powerful as fundamentals
-
in the long term, fundamentals are 33X as powerful as luck.
While I can’t predict the market in the short term, here’s what I can tell you about RJF.
-
One of the highest quality, safest, and most dependable hyper-dividend growth stocks on earth.
-
very safe 1.1% yield (growing 17% CAGR through 2025)
-
15% to 20% CAGR long-term total return guidance is better than almost any popular investment strategy.
-
3% historically undervalued, a potentially reasonable buy (Buffett-style “wonderful company at a fair price.”
-
12.3X PE
-
200% consensus return potential over the next six years, 17% CAGR, about 4X more than the S&P 500
-
2X the risk-adjusted expected returns of the S&P 500 over the next five years
Raymond James is one of 2022’s hottest stocks, defying economic and market gravity, unlike almost every other financial.
That’s courtesy of a one-stop-shop platform for wealth clients that offers a great combination of technology, prudent risk management, and great customer service.
And RJF isn’t just a financial that’s soaring in one bear market. This hyper-growth Super SWAN has been delivering 2X the market’s returns and 14% annual dividend growth for over 30 years.
And with global wealth management expected to be a $3.4 trillion industry by 2030, RJF’s $11 billion in sales represents just a drop in a very big growth bucket.
RJF might not yield much today, but its 17% growing dividend can be combined with high-yield blue-chips to turbocharge your retirement income.
That way, you can have your high-yield recession-resistant income cake and eat it too.
And that, my friends, is how you can make your own luck in this bear market and retire in safety and splendor.
Brad Thomas Take: RJF is poised to surpass $10 billion for the first time in the company’s history. Asset management fees are now higher, which should offset brokerage and investment banking. RJF is targeting wealthier clients (like UBS and Morgan Stanley) and this widens the asset manager’s moat.
Yet. Regardless of the “moat,” I’m waiting on a better margin of safety. Shares are trading at $120.37 per share with a P/E of 15.4x. RJF is on my watch list now, but I’m waiting on $95.00 per share, which may be possible in a slowdown, especially in a recession.
FAST Graphs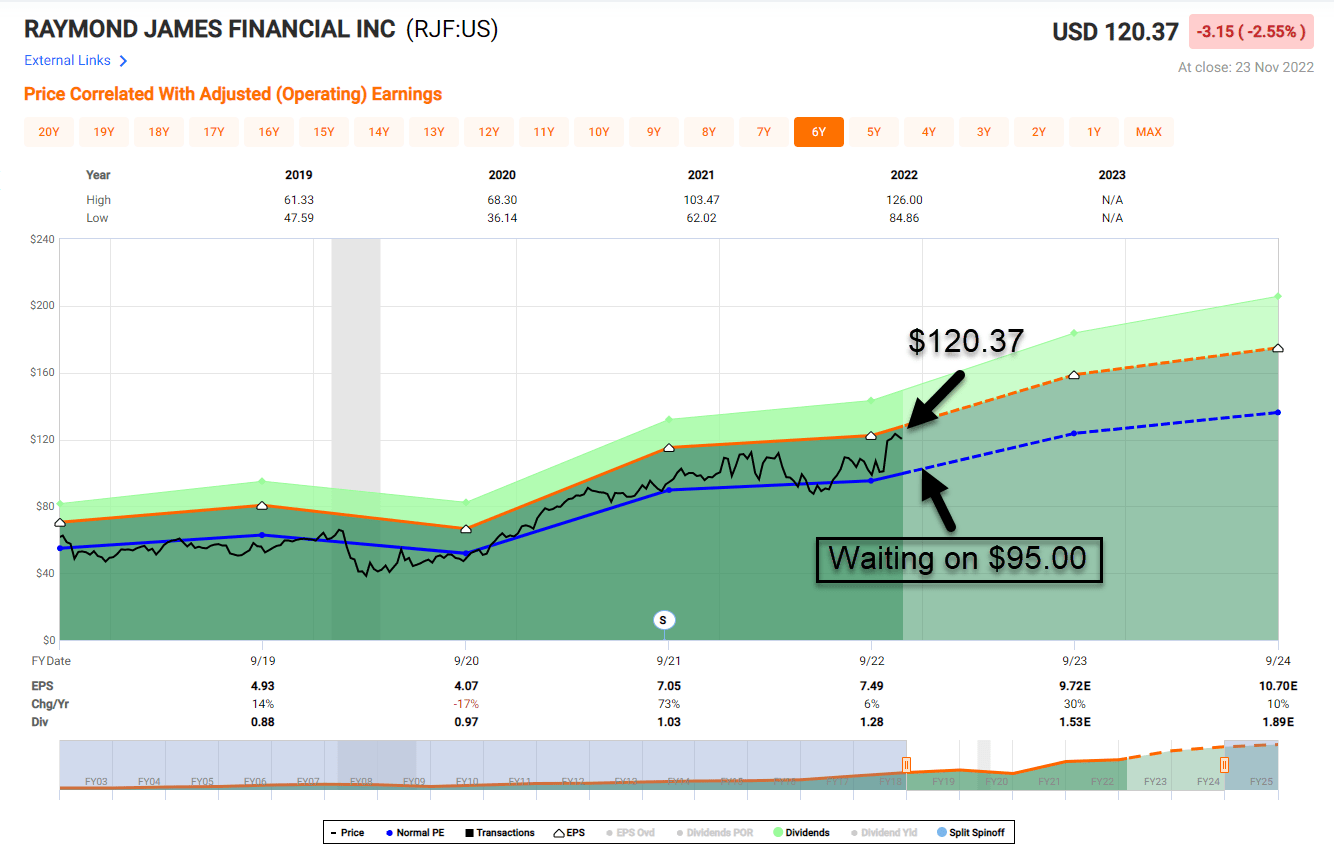
Author’s note: Brad Thomas is a Wall Street writer, which means he’s not always right with his predictions or recommendations. Since that also applies to his grammar, please excuse any typos you may find. Also, this article is free: Written and distributed only to assist in research while providing a forum for second-level thinking.
Be the first to comment