

undefined undefined/iStock via Getty Images
After one of the sharpest YTD surges on record, US consumers have seen a bit of relief at the pump over the last month as gasoline prices, as tracked by AAA, have seen a sharp pullback. The national average price of a gallon of gas currently stands at $4.52, which at any other point in history would have been astronomical, but compared to mid-June when the national average briefly topped $5, current prices seem downright cheap – at least on a relative basis!
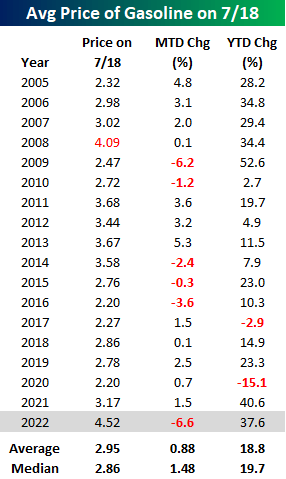
The table below shows prices as of 7/18 each year going back to 2005 and where they stood on both an MTD and YTD basis. At $4.52, the national average has never been higher at this time of year, and the only year it was above $4 per gallon on 7/18 was in 2008. On a YTD basis, the average price is still up 37.6%, which is roughly double the average and median YTD gain at this point in the year, but 2021 (40.6%) and 2009 (52.6%) both saw larger YTD increases. One notable aspect of this year so far is that despite the big increases on a YTD basis, this month’s 6.6% MTD decline actually ranks as the largest MTD decline in prices through 7/18.
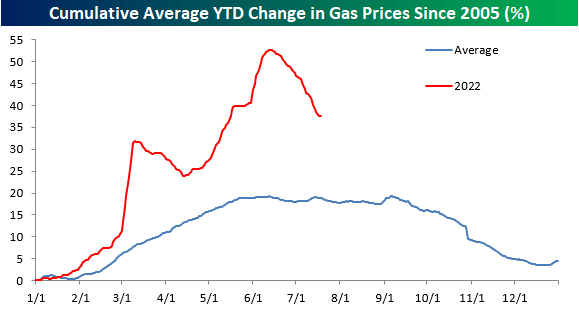
While the moves this year have been much more extreme than normal, average gasoline prices are following their typical seasonal pattern. Historically, prices tend to peak right around Memorial Day or into early June, and this year’s peak in prices was on June 13th. Granted, this year’s peak (50%+) was much larger than the typical YTD increase leading up to the peak, but the magnitude of the decline in percentage terms has also been steeper than normal. In order to get back down to a more normal YTD pattern, we’re going to need to see continued weakness in prices going forward. But from a seasonal perspective (and barring any hurricanes), there is a tailwind for lower prices.
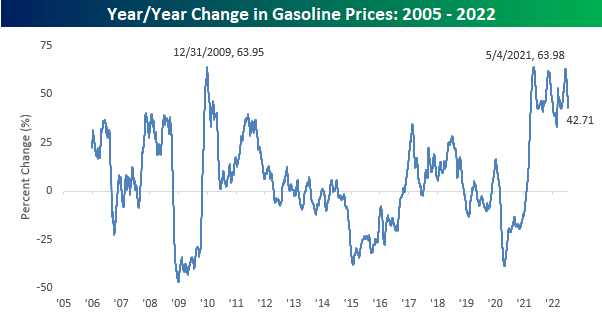
Besides the fact that gas prices hit record levels this year, what has made the period especially painful for consumers is how consistent the increase in prices has been. The chart below shows the y/y change in prices going back to 2005. The current level of 42.71% isn’t necessarily extreme in terms of its magnitude, but what stands out in the chart below is how long the y/y increase has stayed at elevated levels. Back in March 2021, the year-over-year change for gas prices first crossed 30%, and it hasn’t looked back since. When you start lapping 30% y/y increases, it really starts to add up! Let’s hope that this recent dip really starts to have some legs.
Editor’s Note: The summary bullets for this article were chosen by Seeking Alpha editors.
Be the first to comment