

Bill Pugliano/Getty Images News
Thesis
PulteGroup (NYSE:PHM) and the rest of the homebuilding sector have been trading at mouth-watering low P/Es in recent months. Investors clearly don’t think the current pace of home building is sustainable, I agree, but yet despite this, Pulte could still make sense for the long-term minded investor.
The fragmented homebuilding market is prone to cyclicality. The recent fall in the stock market and the increase in interest rates have caused housing sales to slow. In addition, builders have been delivering a large number of units as they raced to meet the perceived heightened pandemic demand. The lower sales and higher inventory have resulted in the monthly housing supply being higher than it has been at any point since the Great Recession. Builders are now pulling back and new housing starts are falling. Profits over the next twelve months can be expected to fall too.
However, over the next decade new household formations should result in continued housing demand. I also expect property prices to continue rising over the long-term. The homebuilding industry has changed since 2008. Companies have moved towards capital light models and carry significantly less debt. Current record profits are unsustainable, however next decade could deliver decent results.
Risks
Cyclical Business
Homebuilding is notoriously cyclical partly due to its fragmented nature. The number of units delivered in 2021 by the three largest builders in the US were D.R. Horton (DHI) (81,965), Lennar (LEN) (59,825) and Pulte (28,894). The past three decades has seen some consolidation. In 1989, the top 10 builders captured 8.7% of new single-family home closings, this had increased to 34.2% last year. Despite the more consolidated industry investors are fearing another downcycle and have bolted for the exits.
The monthly supply of new houses reached 10.9 months in July, the highest it has been since the Financial Crisis. This was as a result of sales dropping by 40% and inventory increasing by 18% since the beginning of the year. The market is clearly deteriorating.
Monthly supply of new houses (FRED)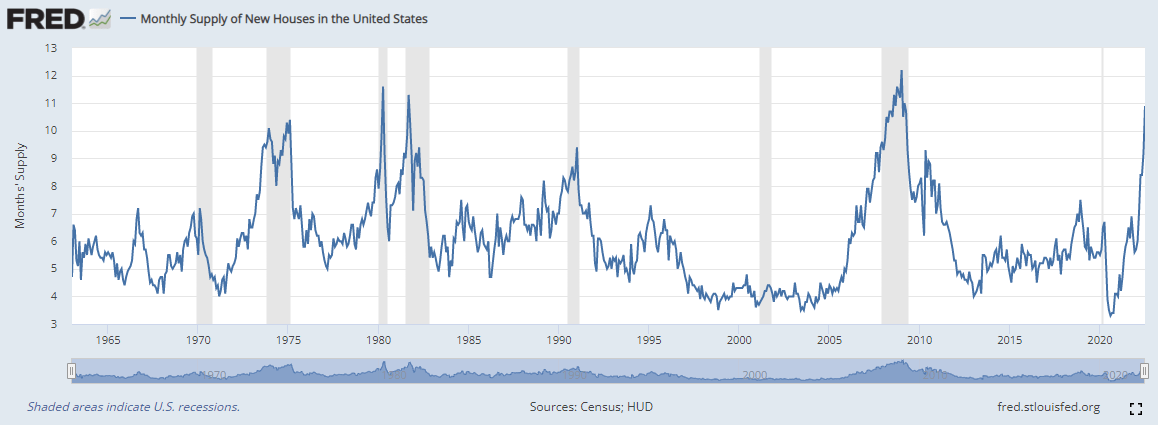
Builders have already started to pull back. New housing starts, one of the housing markets’ big three leading indicators (along with permits and new home sales), have fallen from the April high of 1,805 to 1,575 in August. I believe housing starts need to stabilize before the Pulte stock will. Starts bottomed a full two years ahead of the Pulte share price during the Great Recession.
Pulte’s lack of exposure in the multi-family space is something that has worked against the company. Single-family units made-up 84% of Pulte’s sales last year. However, the multi-family has been the bright spot of the market having fully recovered from the 2008 crash.
Single-family and multi-family completions (FRED)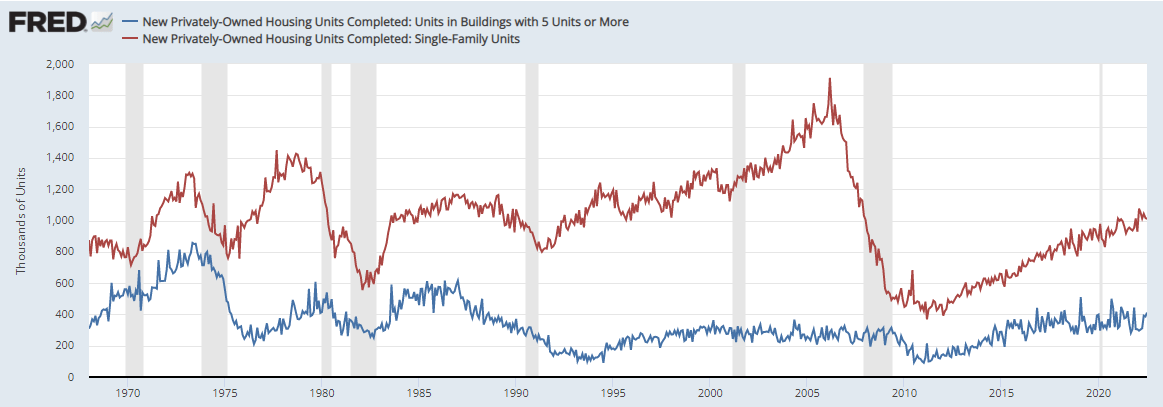
Outlook
Long-term Housing Demand
The long-term the demand for new housing should stay intact. The main determinant of new housing demand is household growth. Household growth is driven by population growth and people per household. The US population has grown at about 2 million per year over the last 50 years. There has been a recent decline due to lower birth rates, lower life expectancy and lower immigration. However, the fall in population growth rate is being offset by smaller households as the number of people per household has fallen from 3.5 to 2.5 since the 1950s.
The number of housing units needed for each extra 100 households has long been thought to be 130. However, in recent years this number has fallen to 100. When I calculate the updated ratio of the housing units completed for each additional household using the methodology outlined in a 2007 paper by the Joint Center for Housing Studies of Harvard University I find the ratio to be closer to 110. My analysis does not account for mobile homes. Given the recent fall in the ratio of completions to new households and my calculations I think it makes sense to take a more conservative view of housing demand going forward.
Household Growth versus Completions (JCHS)
Forecasted household growth numbers are estimated by the Joint Center for Housing Studies, which has been making projections of household growth since the 1980. Their latest projections call for household growth of 12.2 million in the 2018-2028 period and 9.6 million in 2028-2038. Using my ratio of new housing units to new households of 1.1x, I believe the demand for new housing should be 1.28 million per year over the next decade based on the projected household growth rates.
An alternative method to calculate the expected housing demand is to assume one unit will be needed per additional household and then calculate the expected demand from demolitions, second homes and vacant units. This method could potentially be more accurate but also requires a lot more inputs that could in-turn be wrong, and I have not calculated the housing demand using this method.
Increasing House Prices
House prices should continue to increase over the next decade. Since 1962 new US homes have increased in price at a rate of 5.5% per year. The continued increase of house prices at the historical rate would result in Pulte’s average unit selling price to increase to $930,000 in 10 years’ time.
The short-term house prices picture is less rosy. Freddie Mac’s analysis below shows that in prior rising rate environments there were a wide variety of outcomes.
Impact of Rising Rates on Housing (Freddie Mac)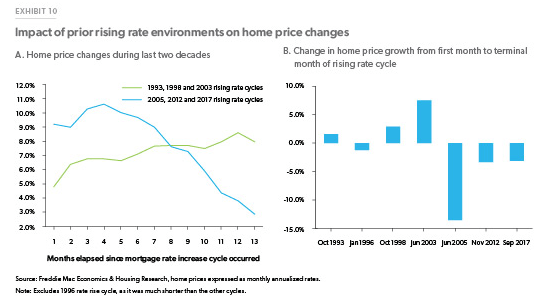
Looking back at history, it is interesting to note that despite high interest rates during the 1970, 1980s and 1990, homebuilding demand was relatively healthy and home prices increased during this period too.
Changing Industry
As we enter what appears to be another down cycle, it is important to look at the differences in homebuilders over the last 15 years. Since 2005 the entire industry has moved towards NVR’s capital light model with the use of land options. Instead of being a land speculation play, many of the builders are now more akin to home manufacturers. Pulte’s percentage of lots controlled via options is 54%. The company recently said that they would like to increase the lots controlled through options to 65-70%.
The other substantial change since 2008 is the amount of leverage that the home builders carry. Prior to the Global Financial Crisis you could find builders with debt to capitalization of 100% or more, whilst today 20%-40% is the norm. Pulte’s debt to capitalization has gone from 36% in 2005 to 21% as per Q2 2022.
As the market slows down, I expect Pulte to work through the inventory of land it currently owns. During the Great Recession, Pulte was able to stay cash flow positive as it worked through inventory, whilst not investing in new land. A remarkable achievement during this is once in a generation housing crisis. Pulte has been one of the most aggressive repurchases of shares and I believe it will continue to use the free cash flow to buyback stocks.
Valuation
If my expected housing demand of 1.3 million units is correct, what does that mean for Pulte’s numbers?
The last time the US recorded 1.3 million housing starts was 2019, which I believe is an equilibrium point for the market. In 2019 Pulte delivered 23,232 units and had net income of $1 billion, on sales of $10.2 billion. Based on the 2019 EPS of $3.66, Pulte is currently trading at a PE of 11x. The stock is not expensive, but not as cheap the trailing PE numbers would suggest.
10-Year Forecast
Looking forward, over the long-term I expect house prices to keep increasing by 5.5% that it has historically. This would increase the Pulte average price per unit to 930,000 in 10 years’ time. Over the next decade I expect the total units completed to stay in line with the 2019 levels.
The long run net income margin is a hard number to estimate over the cycle. Since 2016 the company has averaged a net income margin of 10%, and this represents my bull case. This number does not include a down cycle like we saw in 2008, and a 5% net income margin is my bear case.
One of the benefits of being a cyclical stock that trades at low multiples is the potential EPS growth from share repurchases. Over the last two years the company has bought back more than 10% of shares and since 2016 buybacks have averaged 6%. Given this, my buyback bear and bull cases are 5% and 10% respectively.
My expected 10-year out, 2032 EPS ranges from $8.08 to $27.74. Clearly a wide range of outcomes is possible. My average 2032 EPS estimate is $16.50. I believe the stock should trade on these normalized earnings at a P/E ratio of 10x. This gives me a price target of $165, or 4.2x the current share price.
Forecasts (Author Calculations)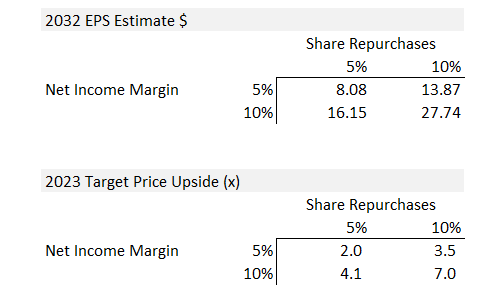
To me, an investment in Pulte doesn’t offer instant gratification, but instead a decent return for the patient, long term investors who can invest through the cycle and definitely not for the faint hearted.
Be the first to comment