

JHVEPhoto
Price Action Thesis
We present our price action analysis on one of the leading insurance and asset managers, Prudential Financial, Inc. (NYSE:PRU) stock. Some investors could be surprised that we can also analyze a solid dividend stock like PRU through its price action lens.
Therefore, we would like to emphasize that investors can use price action to assess any security or asset class, with or without cash flows. Furthermore, price action is forward-looking, providing valuable insights and helping investors in their decision-making.
For PRU, we believe it’s at a critical juncture now. It has lost its bullish bias that supported its advance from its 2020 COVID bottom. Furthermore, two bull traps (significant rejection of buying momentum) in 2022 were instrumental in setting up its buying momentum failure. As a result, the market has been digesting PRU’s massive gains from 2020.
While Prudential’s 5.1% 5Y average dividend yield (per S&P Cap IQ) is a source of appeal for investors, it has underperformed the market significantly over the past five to ten years (based on total return CAGR). Therefore, investors shouldn’t be surprised that it has been tagged with a markedly lower average earnings multiple than the market’s average.
We rate PRU as a Hold for now. Even though it has lost its bullish bias, we believe it’s likely at a near-term bottom. But, we do not encourage investors to buy this dip until we see more constructive price action that can help stanch its bearish bias.
PRU – Watch Out For The Double Top Bull Traps
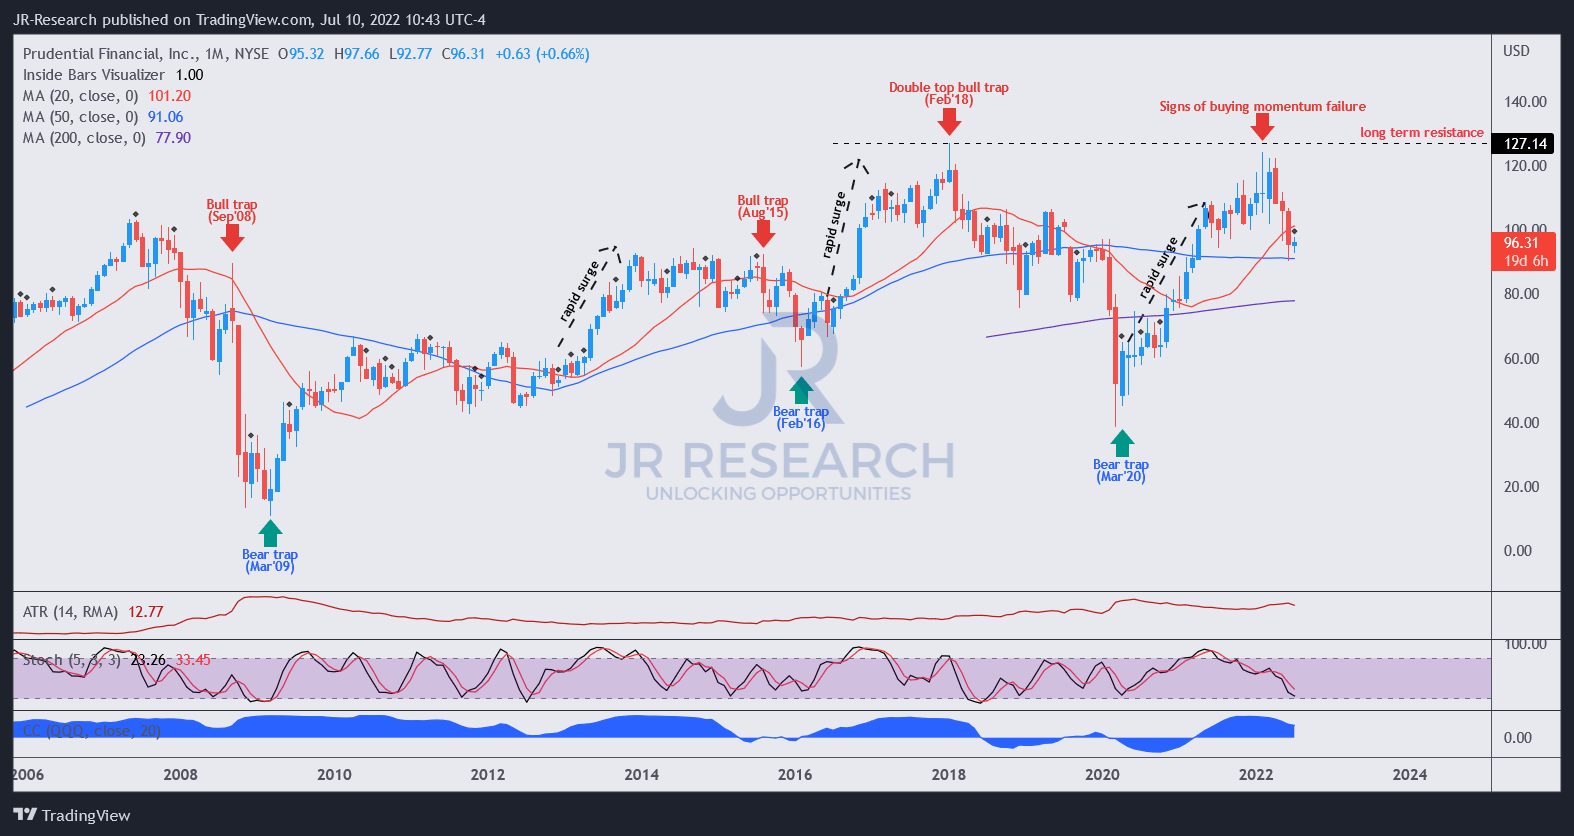
PRU price chart (monthly) (TradingView)
From PRU’s long-term chart, investors can glean that it doesn’t exhibit a robust long-term uptrend. Instead, its long-term trend is emblematic of stocks that often demonstrate earnings cyclicality in their underlying business model.
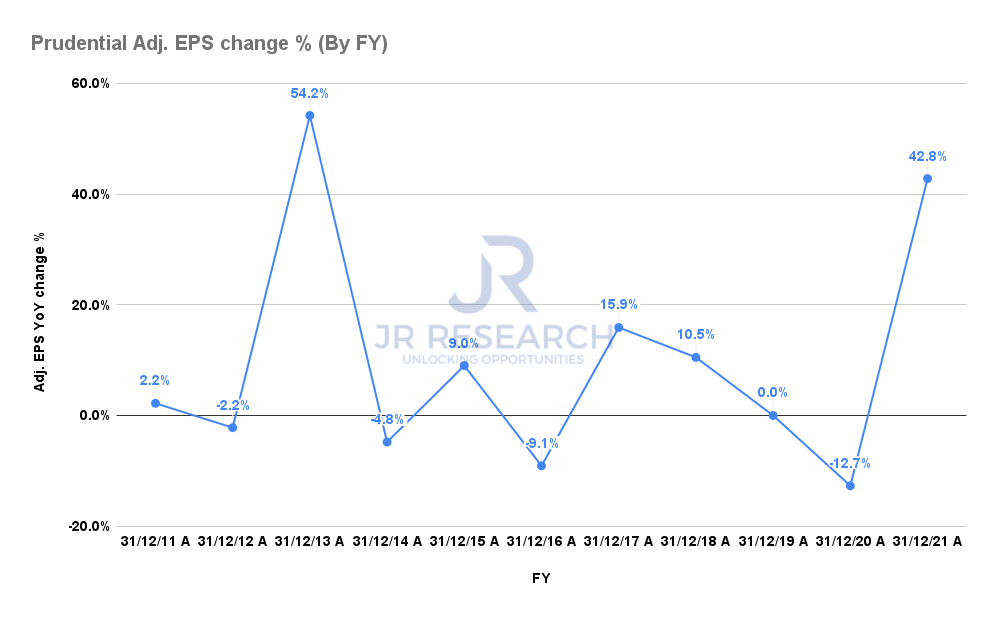
Prudential adjusted EPS change % (By FY) (S&P Cap IQ)
Even though Prudential’s business model is resilient, its earnings growth has been relatively volatile over time. Hence, we believe the market has likely considered its earnings growth volatility in assessing PRU’s appropriate valuations.
PRU’s long-term charts demonstrate a series of bull and bear traps (significant rejection of selling momentum). For instance, the bear traps suggest potential entry points for investors to accumulate together with the market. In contrast, the bull traps suggest investors can use the signals to cut exposure before the market distributes further.
Bull traps often demonstrate consistent price structures, even though no structure is identical. Notably, rapid flush-up price structures preceded PRU’s bull traps in August 2015, February 2018, and, most recently, in February 2022. These flush-up price structures indicate that the market has drawn in buyers rapidly before setting up those bull traps.
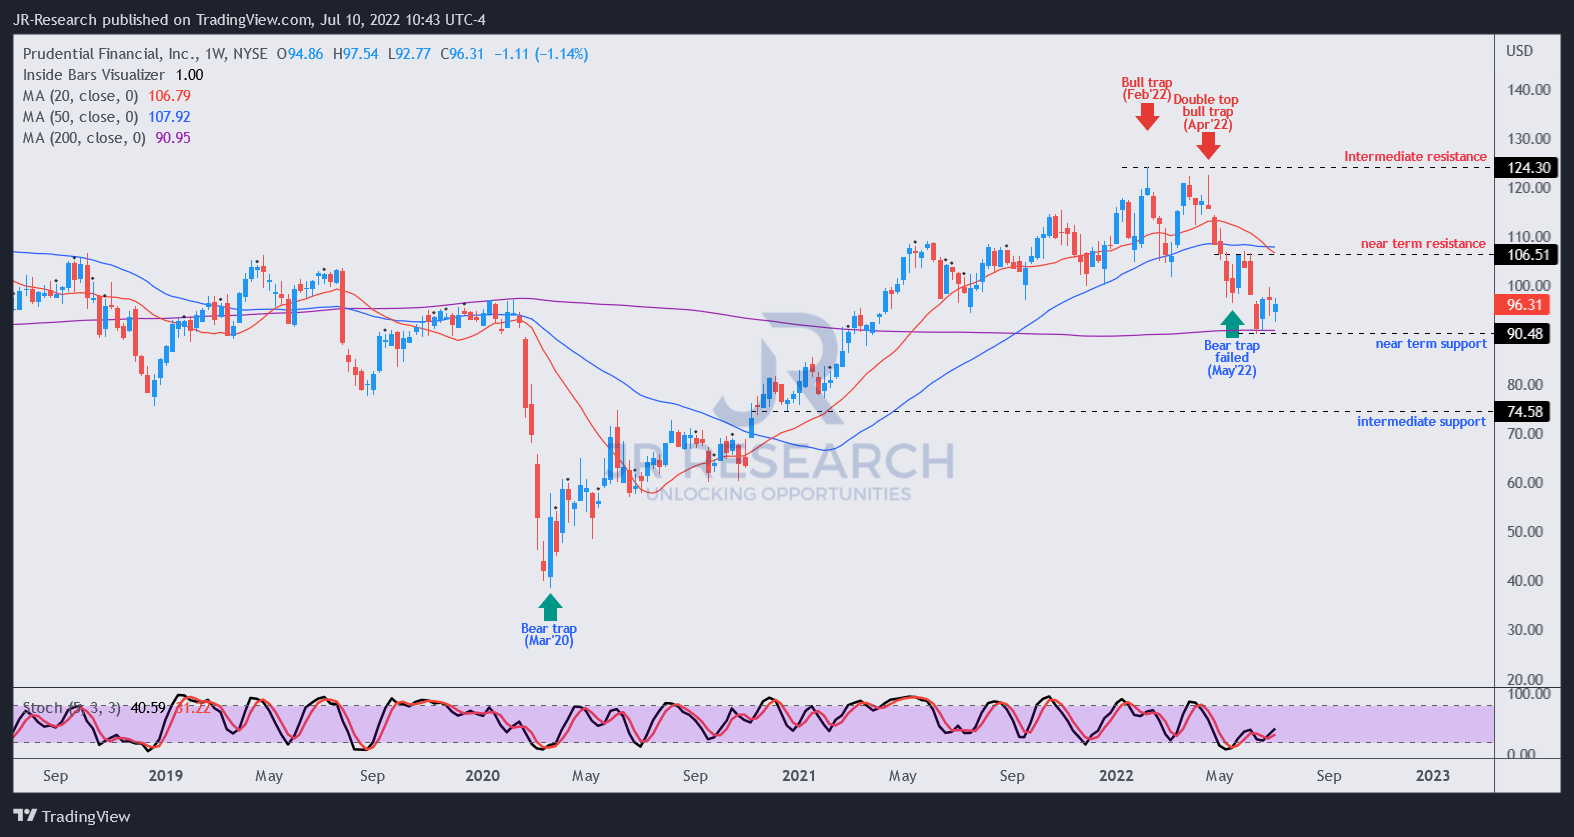
PRU price chart (weekly) (TradingView)
Leaning into PRU’s weekly chart, we can corral its medium-term trend more clearly. Readers can also gather the twin bull traps in February and April 2022. Notably, April’s topping price action was a potent double top price structure, the most potent bull traps in our arsenal.
As a result, we weren’t surprised that the market sent PRU into a rapid liquidation after April’s double top. Furthermore, the selling pressure has also prevented the retaking of its bullish bias.
Notably, PRU has lost its bullish momentum that has undergirded its advance from its March 2020 bear trap (COVID bottom). Therefore, losing its bullish bias was a significant development for PRU and warrants caution.
In addition, bear trap price structures aren’t usually reliable after double tops. Therefore, the initial bear trap seen in May was easily invalidated by selling pressure as the market continued to distribute PRU.
We believe PRU has attempted to form a consolidation over the past four weeks. However, it’s still too early to tell whether it can stanch its current bearish bias. Bottoming signals are much less reliable without a reliable subsequent bear trap (after May’s buying momentum failure).
Notwithstanding, a short-term rally could still follow as PRU’s technicals are well-oversold. However, we do not encourage investors to buy this dip until more constructive price action signals are observed.
Is PRU Stock A Buy, Sell, Or Hold?
We rate PRU as a Hold for now.
PRU has lost its bullish bias as the market continued its distribution phase. Notably, a bear trap in May was invalidated, demonstrating the potency of the market’s bearish momentum.
Therefore, we need PRU to stage a short-term rally (likely, due to oversold technicals) before re-testing its near-term support of $90. If a bear trap price structure evolves from the re-test, the price action would be constructive for a sustained consolidation phase to recover its bullish momentum.
Be the first to comment