


Torsten Asmus/iStock via Getty Images
The topline of Provident Financial Services, Inc. (NYSE: NYSE:PFS) is set to grow strongly this year amid a rising interest-rate environment and economic recovery. On the other hand, provision normalization will likely drag the bottom line. Overall, I’m expecting Provident Financial to report earnings of $1.91 per share in 2022, down 13% year-over-year. Compared to my last report on PFS, I have revised upwards my earnings estimate for 2022 because of an upward revision in the net interest margin and a downward revision in provision expense. The year-end target price suggests a decent upside from the current market price. As a result, I’m maintaining a buy rating on Provident Financial Services.
Low-Single-Digit Loan Growth Likely
Provident Financial’s loan growth missed my expectations in the last quarter of 2021, with the result that the loan portfolio declined by 2% for the full year. During the last conference call, management appeared quite confident about loan growth in 2022. Management was also confident about replenishing its pipeline due to the heightened number of deals going through its deal screen committees. Overall, management believes 5% to 6% loan growth is easily achievable.
In my opinion, management is overly optimistic because historically loan growth has been much lower than the above-mentioned target for 2022. Further, Provident Financial’s operating markets are lagging behind the rest of the country in terms of job market performance. Provident Financial operates in New Jersey, New York, and Pennsylvania, all of which had worse unemployment rates than the national average in March 2022.
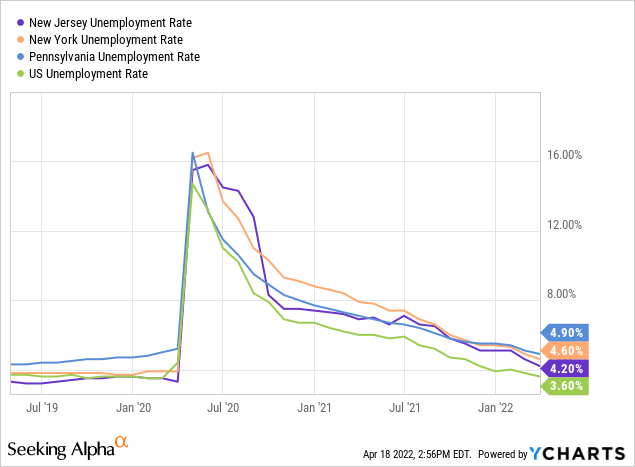
However, economic growth in all three states was quite impressive during the fourth quarter of 2022. According to official sources, New Jersey reported GDP growth of 7.4%, New York reported GDP growth of 4.8%, and Pennsylvania reported GDP growth of 6.4% for the last quarter of 2021.
Considering these factors, I’m expecting the loan portfolio to increase by 3% by the end of 2022 from the end of 2021. Meanwhile, I’m expecting other balance sheet items to grow more or less in line with loans. The following table shows my balance sheet estimates.
| FY17 | FY18 | FY19 | FY20 | FY21 | FY22E | ||
| Financial Position | |||||||
| Net Loans | 7,266 | 7,195 | 7,277 | 9,721 | 9,501 | 9,789 | |
| Growth of Net Loans | 4.7% | (1.0)% | 1.1% | 33.6% | (2.3)% | 3.0% | |
| Other Earning Assets | 1,567 | 1,600 | 1,487 | 1,745 | 2,736 | 2,819 | |
| Deposits | 6,714 | 6,830 | 7,103 | 9,838 | 11,234 | 11,575 | |
| Borrowings and Sub-Debt | 1,743 | 1,442 | 1,125 | 1,210 | 671 | 692 | |
| Common equity | 1,299 | 1,359 | 1,414 | 1,620 | 1,697 | 1,770 | |
| Book Value Per Share ($) | 20.1 | 20.9 | 21.8 | 21.1 | 22.2 | 23.1 | |
| Tangible BVPS ($) | 13.6 | 14.5 | 15.1 | 15.0 | 16.1 | 17.1 | |
|
Source: SEC Filings, Author’s Estimates (In USD million unless otherwise specified) |
|||||||
Sticky Deposit Costs to Help the Margin Expand in a Rising Interest-Rate Environment
Provident Financial’s net interest income is moderately sensitive to interest-rate changes. This sensitivity is largely attributable to sticky deposit costs. As mentioned in the conference call, the weighted average deposit beta is only 23%. This means that a 100-basis points increase in interest rates can lift the average deposit cost by only 23 basis points.
Management’s interest-rate sensitivity analysis shows that a 200-basis points increase in interest rates can boost the net interest income by 4.1% over twelve months. The following table from the 10-K filing gives the results of the interest rate sensitivity analysis.
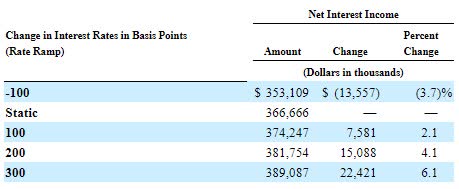
2021 10-K Filing
The above analysis is based on the December 2021 balance sheet. I believe Provident Financial has the opportunity to improve its balance sheet positioning further this year. Provident Financial almost doubled its short-term investments last year, which gives the company liquidity to quickly adapt to rate changes.
Considering these factors, I’m expecting the net interest margin to increase by 12 basis points in 2022. In my last report on Provident Financial, I estimated the margin to remain mostly unchanged this year. I have revised upwards my margin expectation because of economic releases that now favor a more hawkish monetary policy stance.
Better than Expected Credit Performance Calls for Estimate Revision
Provident Financial’s credit performance surprised me in the fourth quarter of 2021. Overall, for the full year of 2021, Provident Financial’s portfolio performed much better than I anticipated with the result that the company reported a net provision reversal of $24 million for 2021, versus my expectation of $10 million given in my last report on PFS.
Due to the better-than-expected performance, I have decided to revise downwards my net provision expense estimate for 2022. Previously I was expecting a net provision expense of $32 million for this year, while now I’m expecting a net provision expense of only $20 million. The updated provision expense estimate represents 0.20% of average loans in 2022. In comparison, the provision-expense-to-total-loan ratio also averaged 0.20% from 2017 to 2019.
Revising Upward My Earnings Estimate for 2022
Due to the upward revision of the margin estimate and the downward revision of the provision expense estimate, I have revised upwards my earnings estimate for 2022. I’m expecting Provident Financial to report earnings of $1.91 per share this year, versus my previous estimate of $1.70 per share.
Earnings for 2022 will likely dip by 13% year-over-year as the provision expense will trend towards a more normal level this year after a year of heightened provision reversals. The following table shows my income statement estimates.
| FY17 | FY18 | FY19 | FY20 | FY21 | FY22E | ||
| Income Statement | |||||||
| Net interest income | 278 | 301 | 298 | 313 | 366 | 391 | |
| Provision for loan losses | 6 | 24 | 13 | 30 | (24) | 20 | |
| Non-interest income | 56 | 59 | 64 | 72 | 87 | 85 | |
| Non-interest expense | 188 | 192 | 202 | 228 | 250 | 261 | |
| Net income – Common Sh. | 94 | 118 | 113 | 97 | 168 | 146 | |
| EPS – Diluted ($) | 1.45 | 1.82 | 1.74 | 1.39 | 2.19 | 1.91 | |
|
Source: SEC Filings, Earnings Releases, Author’s Estimates (In USD million unless otherwise specified) |
|||||||
Actual earnings may differ materially from estimates because of the risks and uncertainties related to the COVID-19 pandemic and the timing and magnitude of interest rate hikes.
Maintaining a Buy Rating Due to an Impressive Total Expected Return
Provident Financial is offering a dividend yield of 4.3% at the current quarterly dividend rate of $0.24 per share. The earnings and dividend estimates suggest a payout ratio of 50% for 2022, which is close to the five-year average of 56%. Therefore, the earnings outlook presents no threat to the dividend payout.
I’m using the historical price-to-tangible book (“P/TB”) and price-to-earnings (“P/E”) multiples to value Provident Financial. The stock has traded at an average P/TB ratio of 1.48 in the past, as shown below.
| FY18 | FY19 | FY20 | FY21 | Average | ||
| T. Book Value per Share ($) | 14.5 | 15.1 | 15.0 | 16.1 | ||
| Average Market Price ($) | 25.9 | 25.1 | 15.6 | 22.8 | ||
| Historical P/TB | 1.79x | 1.66x | 1.04x | 1.42x | 1.48x | |
| Source: Company Financials, Yahoo Finance, Author’s Estimates | ||||||
Multiplying the average P/TB multiple with the forecast tangible book value per share of $17.10 gives a target price of $25.20 for the end of 2022. This price target implies a 13.6% upside from the April 14 closing price. The following table shows the sensitivity of the target price to the P/TB ratio.
| P/TB Multiple | 1.28x | 1.38x | 1.48x | 1.58x | 1.68x |
| TBVPS – Dec 2022 ($) | 17.1 | 17.1 | 17.1 | 17.1 | 17.1 |
| Target Price ($) | 21.8 | 23.5 | 25.2 | 26.9 | 28.6 |
| Market Price ($) | 22.2 | 22.2 | 22.2 | 22.2 | 22.2 |
| Upside/(Downside) | (1.8)% | 5.9% | 13.6% | 21.3% | 29.0% |
| Source: Author’s Estimates |
The stock has traded at an average P/E ratio of around 12.6x in the past, as shown below.
| FY18 | FY19 | FY20 | FY21 | Average | ||
| Earnings per Share ($) | 1.82 | 1.74 | 1.39 | 2.19 | ||
| Average Market Price ($) | 25.9 | 25.1 | 15.6 | 22.8 | ||
| Historical P/E | 14.3x | 14.4x | 11.2x | 10.4x | 12.6x | |
| Source: Company Financials, Yahoo Finance, Author’s Estimates | ||||||
Multiplying the average P/E multiple with the forecast earnings per share of $1.91 gives a target price of $24.00 for the end of 2022. This price target implies an 8.1% upside from the April 14 closing price. The following table shows the sensitivity of the target price to the P/E ratio.
| P/E Multiple | 10.6x | 11.6x | 12.6x | 13.6x | 14.6x |
| EPS – 2022 ($) | 1.91 | 1.91 | 1.91 | 1.91 | 1.91 |
| Target Price ($) | 20.2 | 22.1 | 24.0 | 25.9 | 27.8 |
| Market Price ($) | 22.2 | 22.2 | 22.2 | 22.2 | 22.2 |
| Upside/(Downside) | (9.1)% | (0.5)% | 8.1% | 16.7% | 25.3% |
| Source: Author’s Estimates |
Equally weighting the target prices from the two valuation methods gives a combined target price of $24.60, which implies a 10.9% upside from the current market price. Adding the forward dividend yield gives a total expected return of 15.2%. Hence, I’m maintaining a buy rating on Provident Financial Services.
Be the first to comment