

8vFanI
Looking to benefit from rising rates? Business development companies offer retail investors high-yield exposure to private companies. Many BDCs benefit from rising rates, as they lend money at floating rates, but pay interest at mostly fixed rates.
Company Profile:
Houston-based Main Street Capital Corporation (NYSE:MAIN) is an internally-managed BDC which specializes in equity capital to lower middle market – LMM – companies, with revenue between $10-$150M, and EBITDA between $3-$20M. It was founded in 2007, and is one of the largest BDCs, with a $2.96B market cap, and over $6B in assets under management.
MAIN site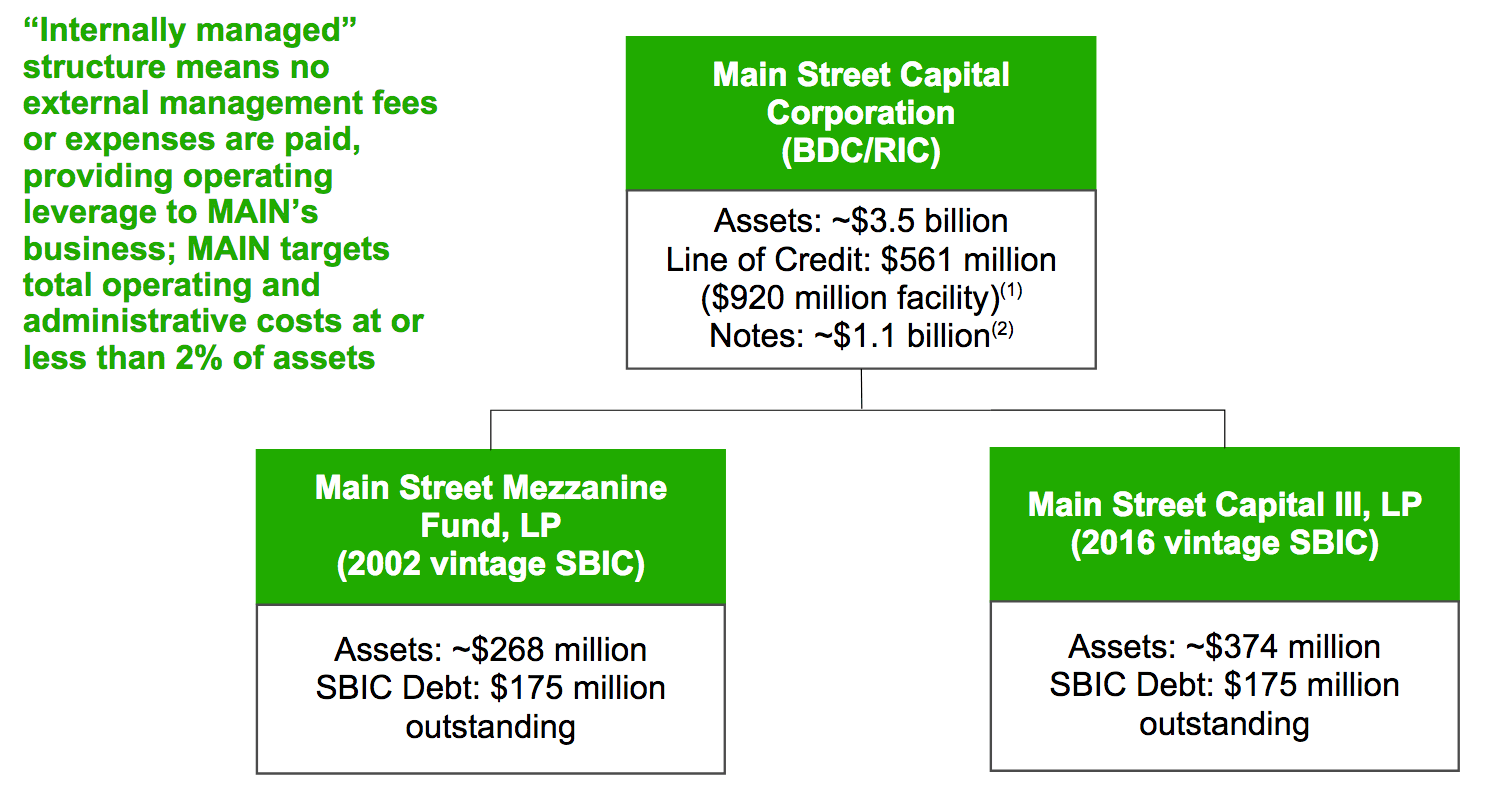
MAIN’s total investment portfolio at fair value consists of ~48% Lower Middle Market, 37% Private Loan, 9% Middle Market, and 6% Other Portfolio investments.
MAIN holds 195 Lower Middle Market, Private Loan and Middle Market portfolio companies, with an average investment size of $18.1M. Its largest individual portfolio company represents 3.3% of MAIN’s total investment income and 3.2% of the total portfolio’s fair value (most investments are less than 1%). The portfolio’s weighted-average effective yield is 10.6% as of 9/30/22, up from 9.3% in Q4 2021.
MAIN’s investments are evenly split between Leveraged & Management Buyouts, at 44%, and Recap/Refinancings, at 43%, distantly followed by Acquisitions, at 9%, Growth Capital, 4%:
MAIN site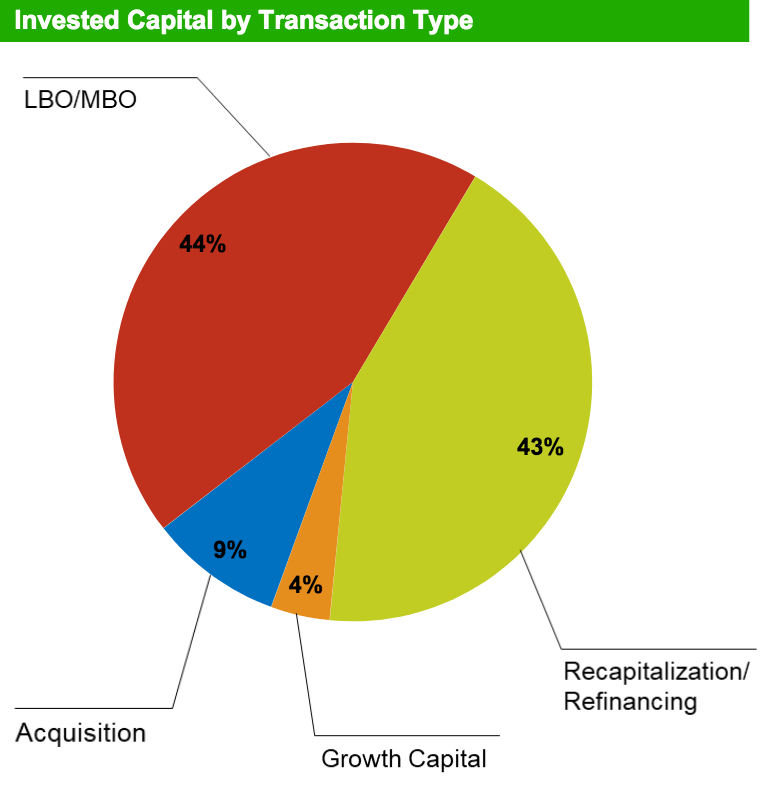
As of 9/30/22, MAIN had 11 non-accrual investments, vs. 9 at 12/31/21, which represented 0.8% of the total investment portfolio at fair value and 3.7% at cost.
Lower Middle Market Portfolio:
MAIN’s LMM holdings are in 75 portfolio companies, worth $1.9B in fair value. 99% of these debt investments have 1st lien positions, while 58% of them earn fixed-rate interest. There’s an ~ 780 basis point net cash interest margin vs “matched” fixed interest rate on SBIC debentures. This debt yields 11.8%.
Equity Investments: MAIN has equity in 100% of its LMM portfolio companies representing a 41% average ownership position, which affords an opportunity for fair value appreciation, which, in turn, supports Net Asset Value/share growth for MAIN, in addition to capital gains and cash dividend income. 68% of these LMM companies with direct equity investment are currently paying dividends to MAIN, up from 59% in Q4 ’21.
MAIN targets companies with revenue between $10M – $150M and EBITDA between $3M – $20M. The average investment size is $25.5M. These companies have an average Senior leverage of 2.8X EBITDA through MAIN’s debt position, with total leverage of 2.9X EBITDA. The LMM portfolio is spread across many industries, with Internet Software & Services, Machinery, Commercial Services, & Supplies, Construction & Engineering, Professional Services, and Diversified Consumer Services, comprising 34% of its holdings:
MAIN site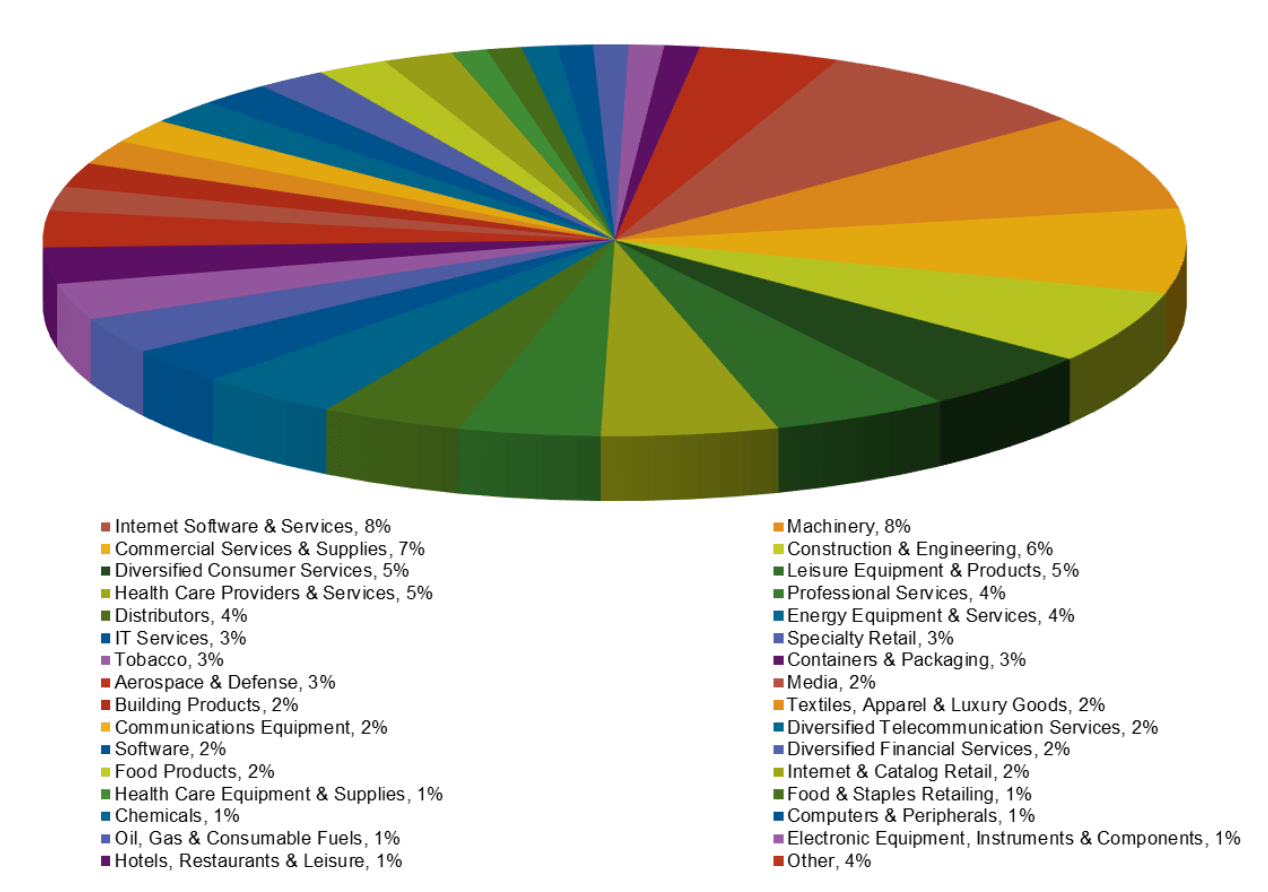
Private Loan Investment Portfolio:
This portfolio consists of 87 investments, with a $1.5B valuation, representing 37% of MAIN’s total investment portfolio at fair value. The average investment size is $17.5M, (less than 1% of the total portfolio).
99% of MAIN’s Private Loan portfolio is secured debt, with 99% being 1st Lien debt. 98% of these loans bear interest at floating rates, with a 550 basis point net cash interest margin vs. the “matched” floating rate on the MAIN’s credit facility.
Middle Market Investment Portfolio: This portfolio has 33 investments, worth $354M, representing 9% of MAIN’s total portfolio at fair value. The average investment size is $12.7M, under 1% of the total portfolio. 99% of this Middle Market portfolio is secured debt, with 99% being 1st Lien. 94% of these debt investments bear interest at floating rates, with an overall average of 9.6% as of 9/30/22, vs. 7.5% as of 12/31/21. There’s a 525 basis point net cash interest margin vs “matched” floating rate on the MAIN credit facility.
Rising Rates:
MAIN benefits from rising interest rates – 73% of its outstanding debt obligations have fixed interest rates, limiting the increase in interest expense, while 76% of MAIN’s debt investments bear interest at floating rates, the majority of which contain contractual minimum index rates, or “interest rate floors.”
Management estimates that Net Investment Income, NII, rises $.23/share for every 100 basis point interest rate rise:
MAIN site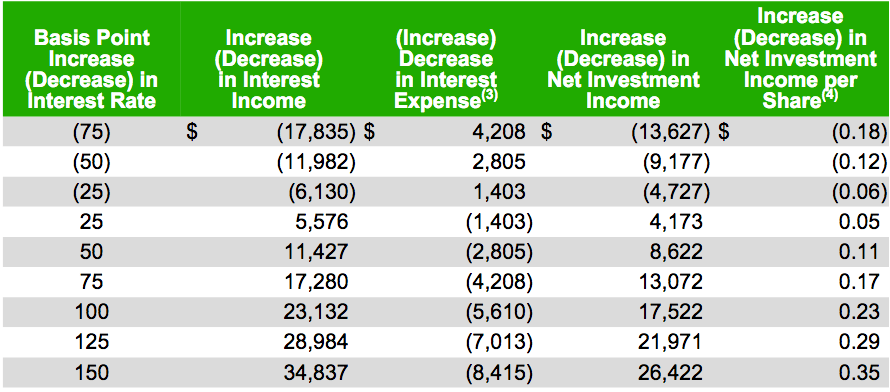
Earnings:
Q3 ’22 earnings were strong, with total Investment income up 28%; Net Investment income rising 27%, NII/Share up 17%, and DNII/Share up 16%.
There was a $24.6M increase in interest income, primarily due to higher average levels of investment portfolio debt investments and an increase in interest rates on floating rate investment portfolio debt investments.
Management completed $111.5M in total LMM portfolio investments, which resulted in a net increase of $84.5M in the LMM portfolio. They also completed $233.8M in total private loan portfolio investments, for a net increase of $174.3 million in total private loan portfolio investments.
MAIN site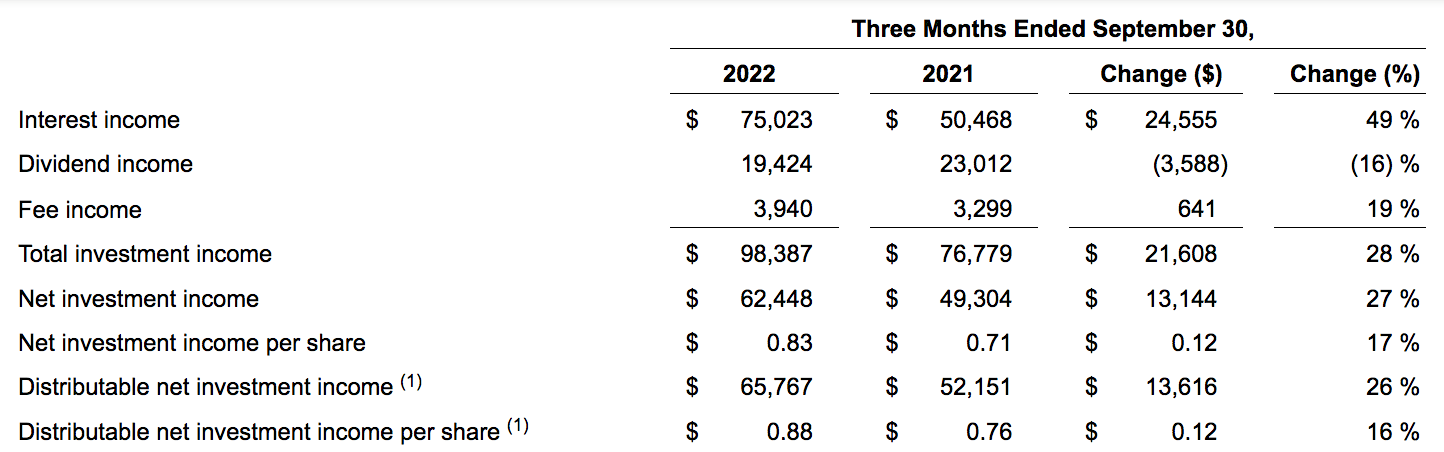
Q1-3 2022: MAIN had a very strong year in 2021, as the economy reopened from COVID-challenged 2020. But Q1-3 2022 was also strong, with double-digit growth in total, net and distributable net investment income. The share count was diluted by 8.7%, but NAV/share still rose nearly 7%.
Hidden Dividend Stocks Plus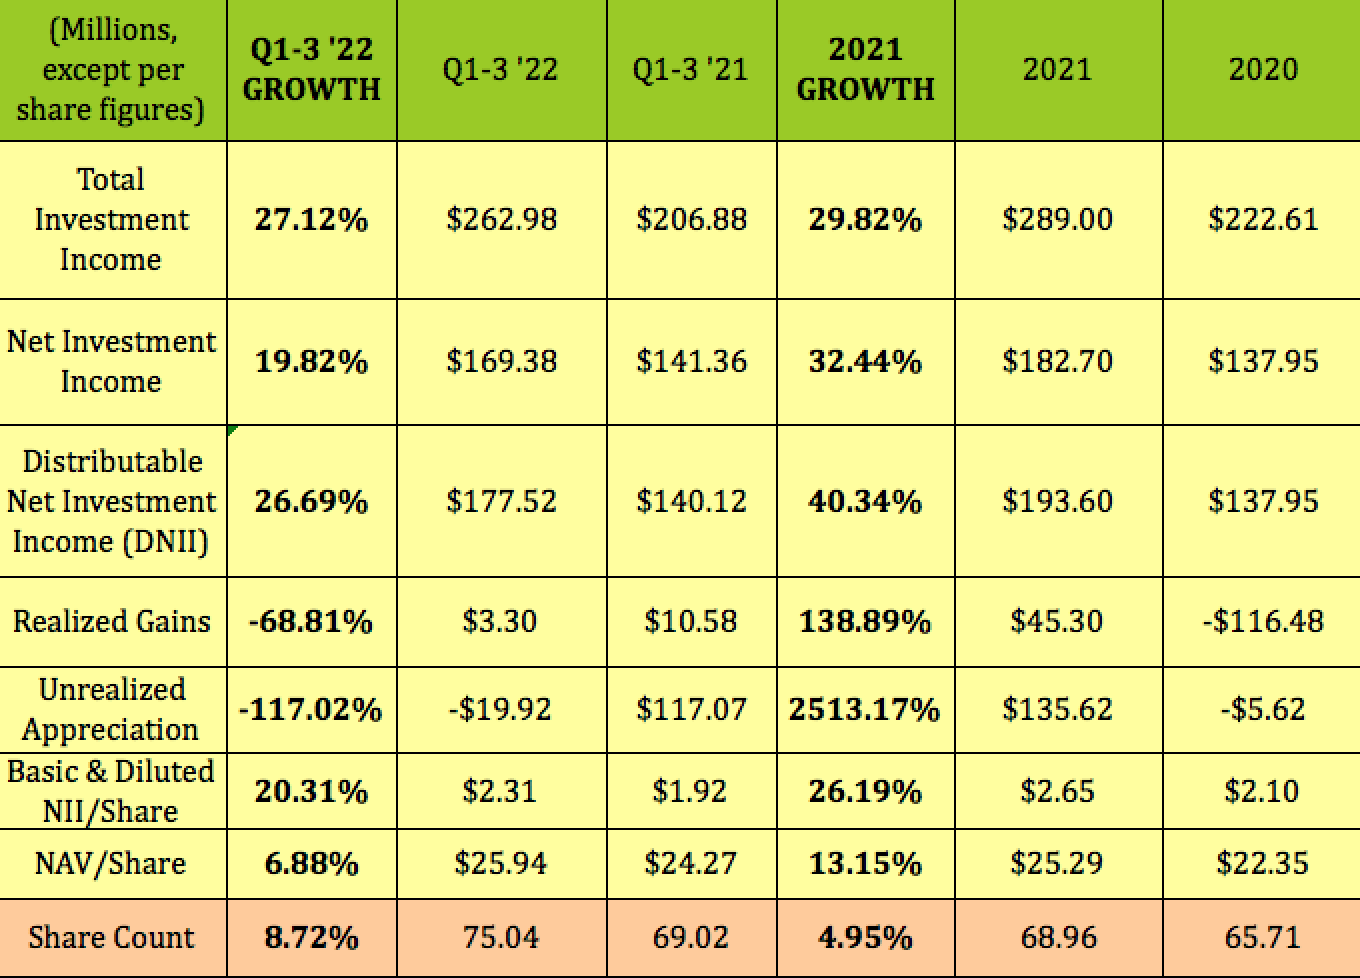
That growth wasn’t a fluke – management has steadily grown the portfolio and delivered DNII/share since MAIN’s 2007 IPO:
MAIN site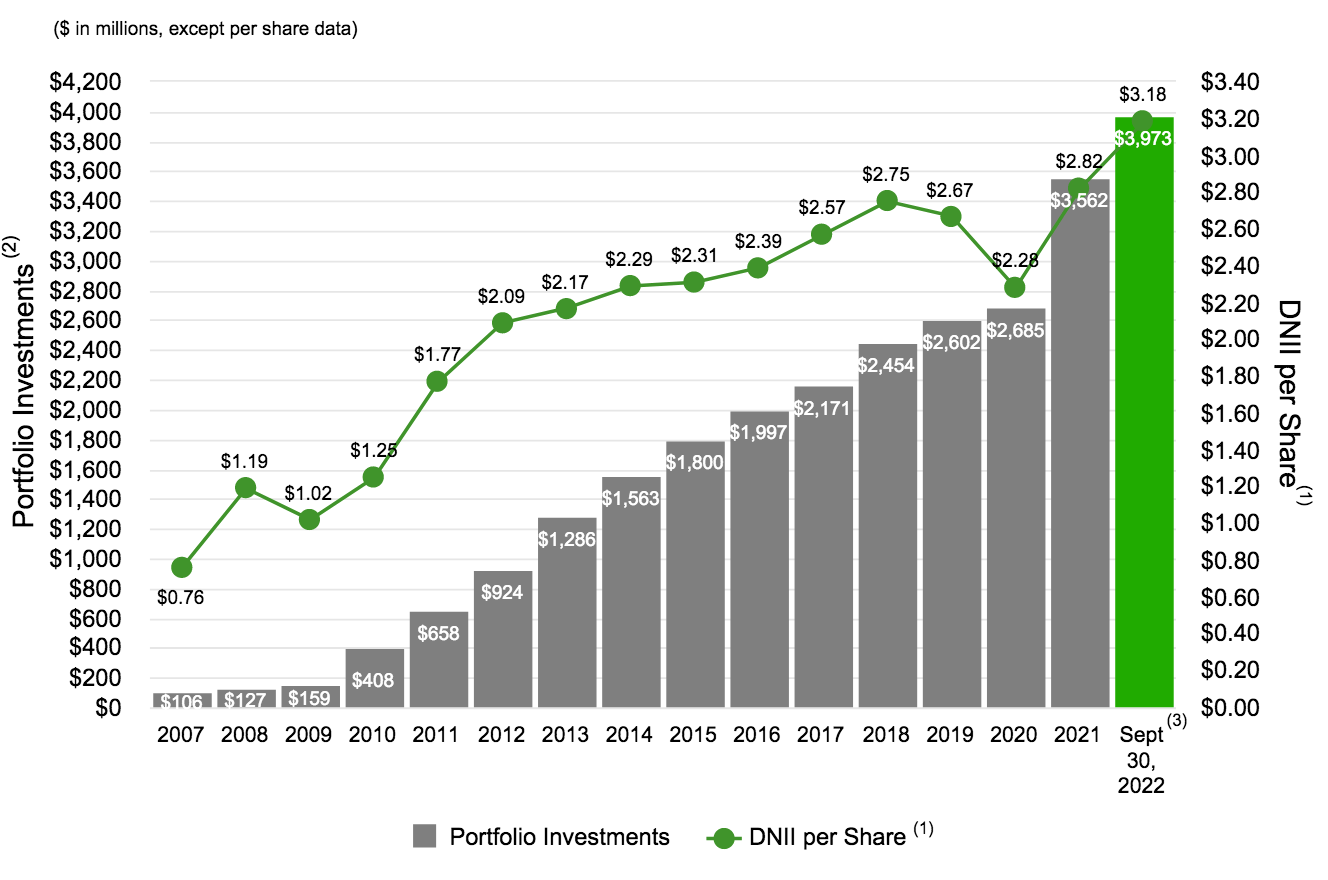
Part of MAIN’s advantage is that it’s internally managed, and therefore doesn’t have management fees and expenses to an outside manager.
MAIN has a low Operating Expenses to Assets Ratio, which was 1.5% on an annualized basis for Q3 ’22, and 1.4% for the trailing twelve-month period ended September 30, 2022.
Dividends:
MAIN declared the monthly $.225 dividends and scheduled for Q1 2023 back on 11/1/22 – helpful for planning one’s cash flow. At its 1/11/23 $38.22 closing price, MAIN yields 7.06%. It goes ex-dividend next on 2/7/23, with a 2/15/23 pay date:
Hidden Dividend Stocks Plus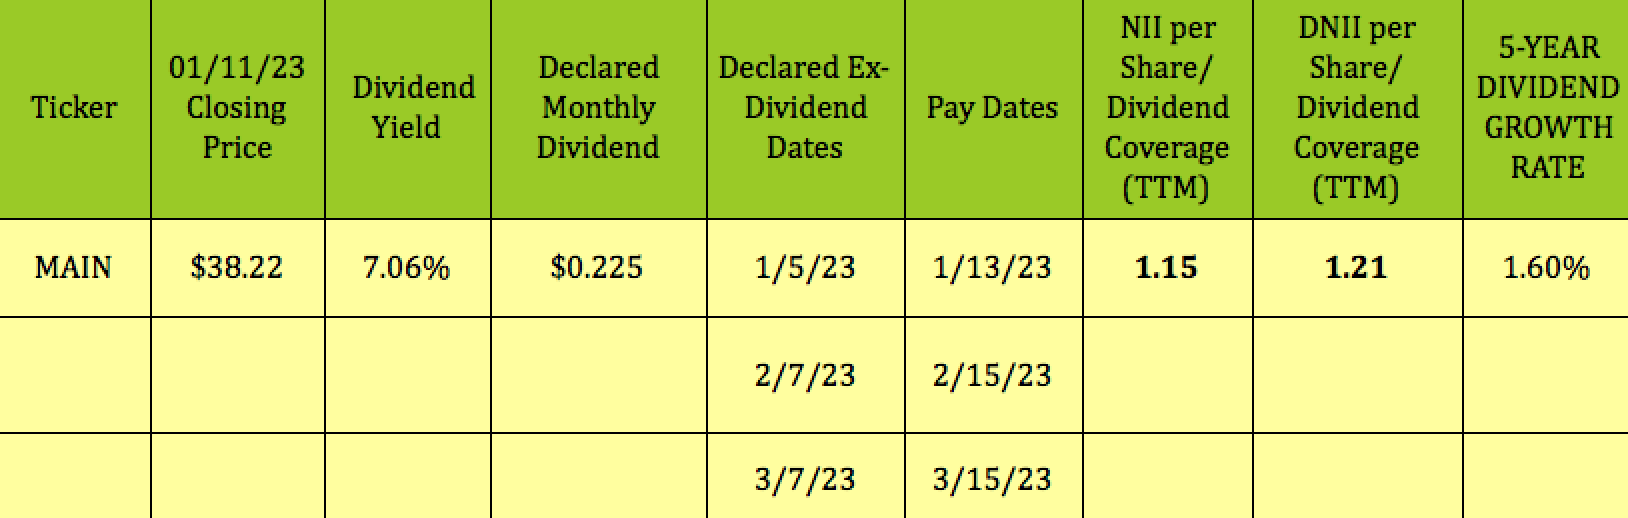
We looked at dividend coverage two ways:
On an NII/share basis, MAIN had very strong Q3 ’22 coverage of 1.23X, and a solid trailing factor of 1.15X. It had a very high DNII/share dividend coverage of 1.3X in Q3 ’22, and a strong 1.21X trailing DNII coverage factor.
Hidden Dividend Stocks Plus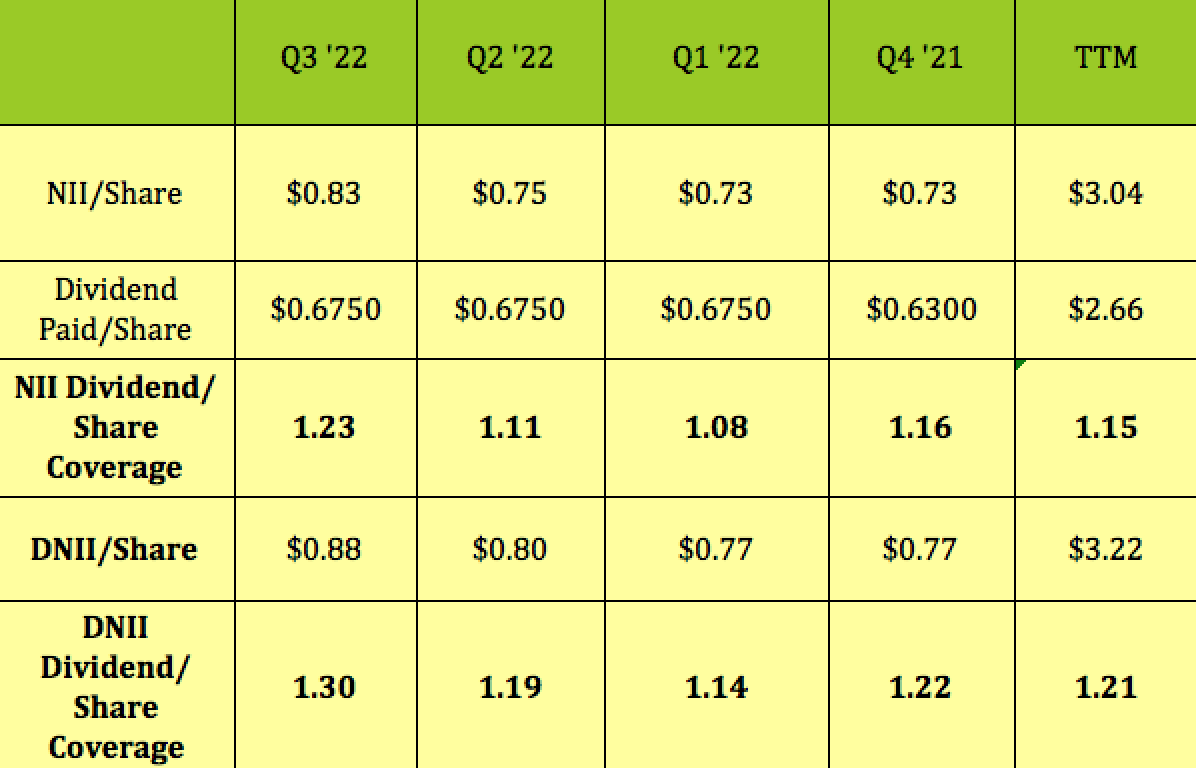
While MAIN’s five-year dividend growth average is 1.60%, that’s strong for the BDC industry, where some companies have had negative dividend growth rates.
Management has grown the annual dividends from over $1.30 in 2007 to over $2.50 in 2022. In addition, MAIN has paid out $4.49 in supplemental dividends since its 2007 IPO.
MAIN site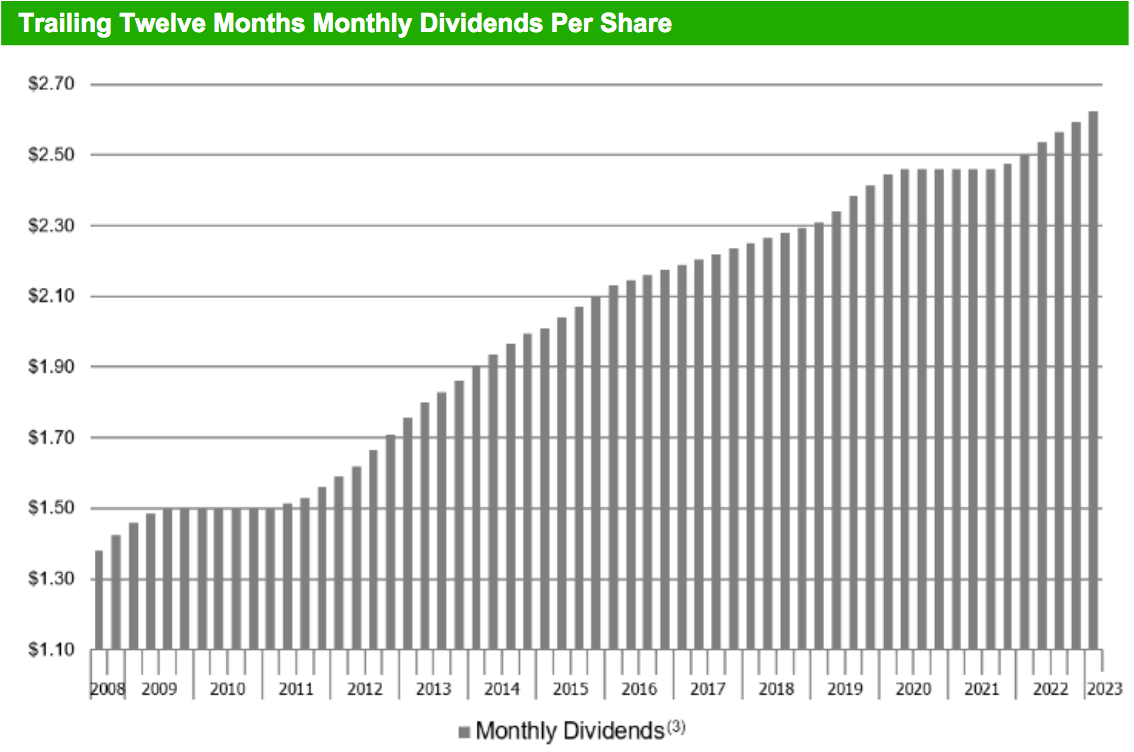
Taxes:
27% of the 2021 distributions, (in green), were capital gain and qualified dividends, up from just 8% in 2020, with 73% characterized as ordinary income dividends.
MAIN site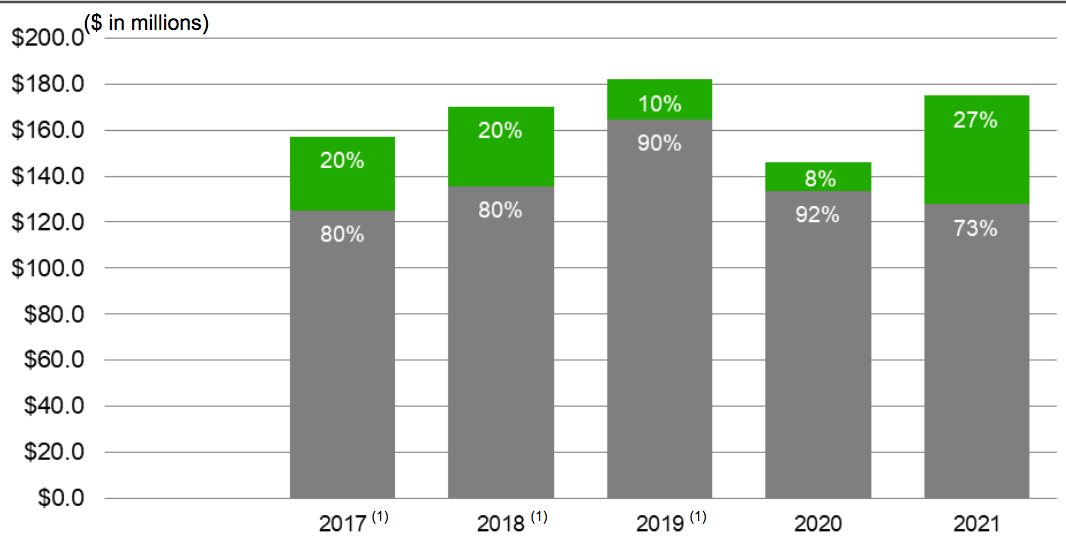
Profitability and Leverage:
MAIN’s management tends to run lower debt leverage than the BDC industry average. This remained true in Q3 ’22, with Debt/NAV at 1.03X, and the BDC average at 1.2X. MAIN’s Interest coverage remained higher than average, at 4.35X, as did its ROA, ROE, and EBIT Margin:
Hidden Dividend Stocks Plus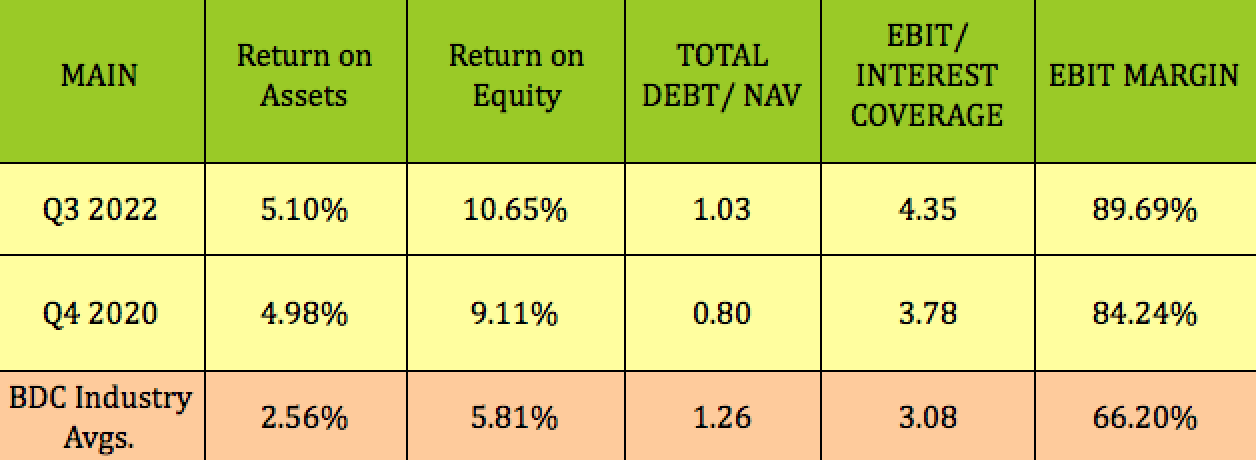
Debt and Liquidity:
As of Sept. 30, 2022, MAIN had aggregate liquidity of $420.2M, including $61.2M in cash and cash equivalents, and $359.0M of unused capacity under its Credit Facility.
In Q3 ’22, management amended MAIN’s revolving credit facility, to increase the total commitments from $855.0M to $920.0M, and extend the maturity date to August 2027.
MAIN received an investment grade credit and corporate rating of BBB-, with a stable outlook from Fitch Ratings in July 2022, which is in addition to the rating of BBB- with a stable outlook that it maintains from S&P Global Ratings.
MAIN has minimal maturities due in 2023, with $450M in Notes and ~$64M in SBIC debentures due in 2024. There’s nothing due in 2025, with $500M due in 2026.
MAIN site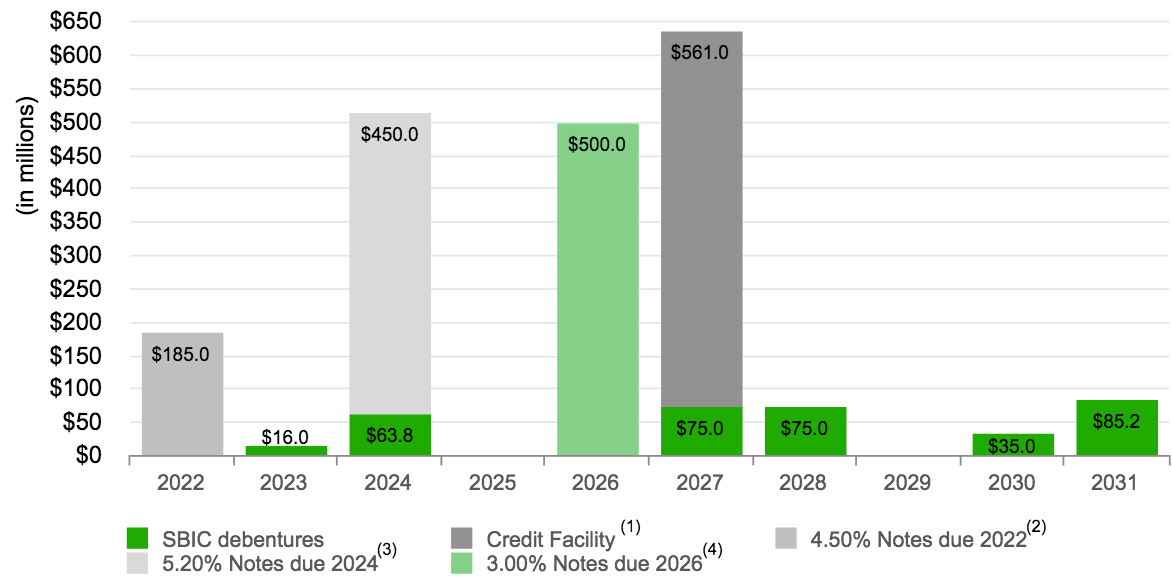
Performance:
After struggling for most of 2022, like other Financials, the BDC industry has caught a bid over the past trading quarter and month. MAIN has outperformed its industry and the S&P 500 over the past month, quarter, and year; and also outperformed it on a total return basis over the past year.
So far in 2023, MAIN has kept pace with the S&P.
Hidden Dividend Stocks Plus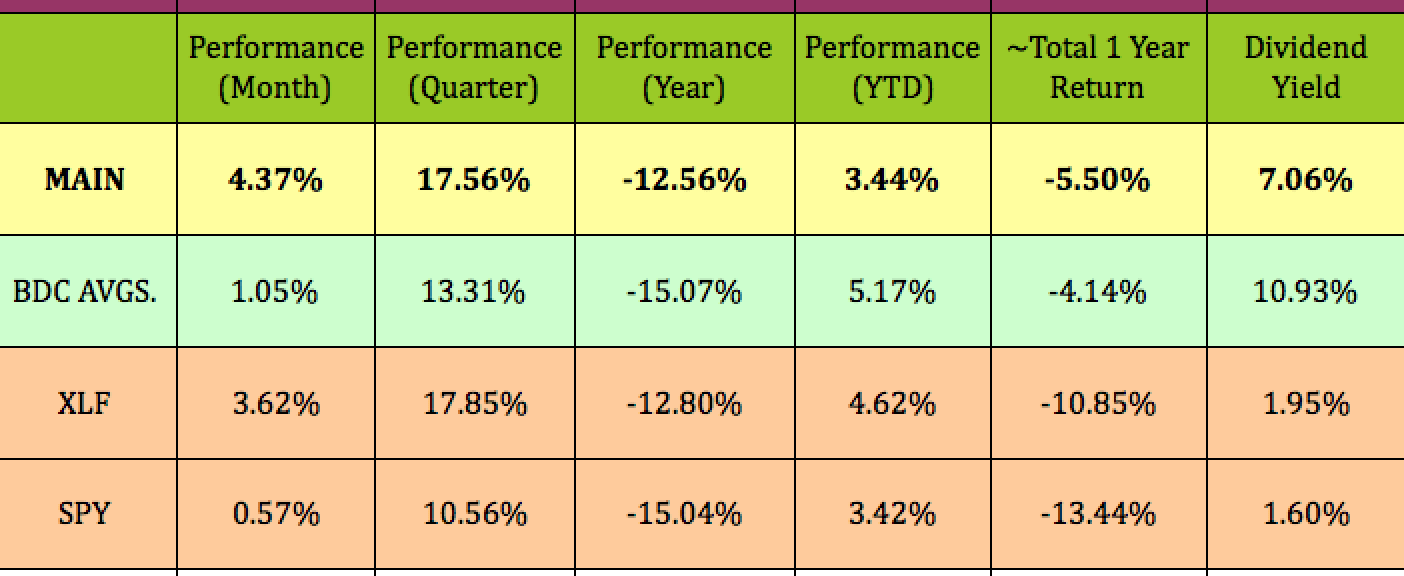
Looking back long term, MAIN has outperformed its BDC peers, the S&P, the Russell 2000, and the KBW index since its 2007 IPO:
MAIN site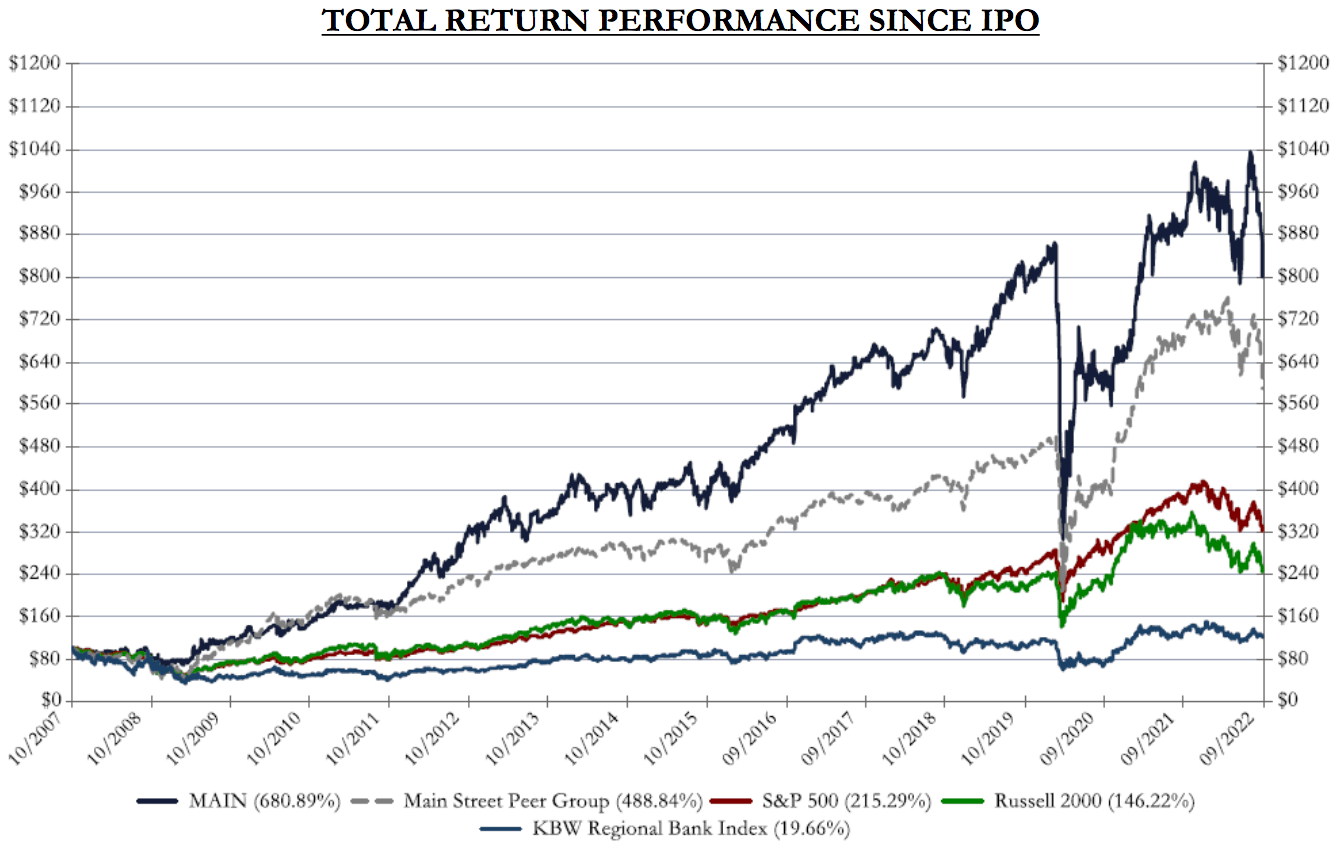
Analyst Targets:
There were two new analyst ratings in December ’22: Buy from B. Riley with a $42.00 target, and Neutral from UBS, with a $40.00 target.
At its 1/11/23 $38.22 closing price, MAIN was 2% below the $39.00 lowest price target, and ~7% below the $41.17 average price target.
Hidden Dividend Stocks Plus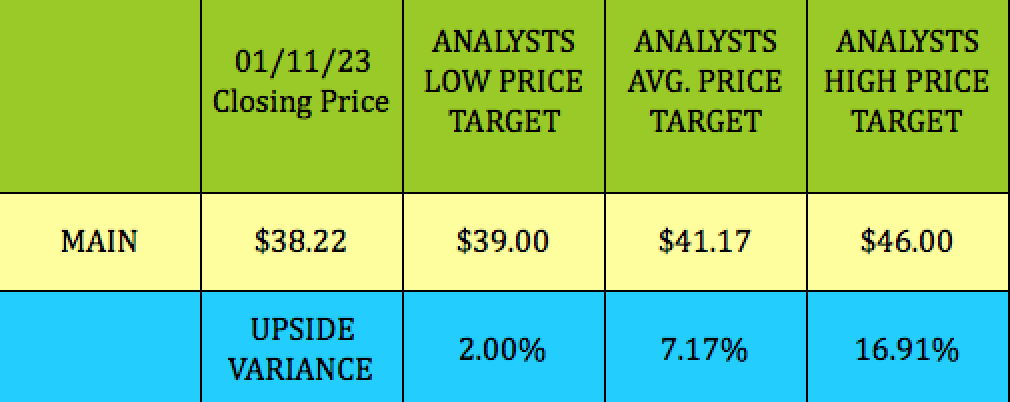
Valuations:
OK, enough with all this good news – here’s the problem. MAIN usually trades at a substantial premium to its NAV/share. That’s certainly the case currently – it’s trading at a ~47% premium to NAV, vs. the BDC industry’s average -4% valuation.
However, you should look at its earnings multiple also, Price/NII, which, at 12.57X, is much more in line with the 12.42X BDC industry average. MAIN’s 7% dividend yield is far below the 10.9% industry average, which is also a testament to how highly the market values MAIN:
Hidden Dividend Stocks Plus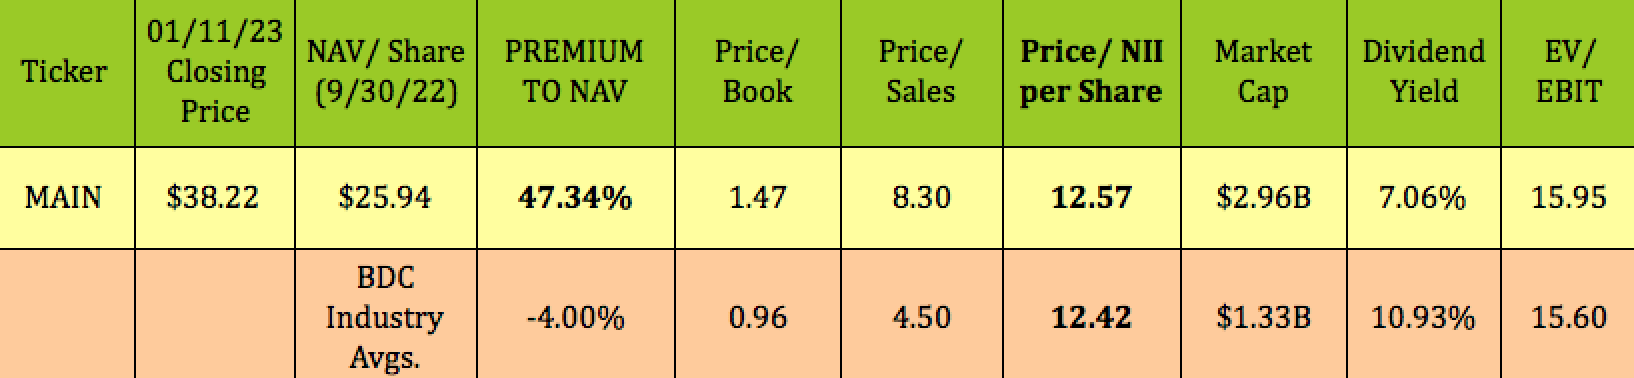
Parting Thoughts:
In 2021, MAIN’s P/NAV was valued as high as over 1.8X. In 2022, it only reached as low as ~1.25X in the fall. It’s ~15% below its 52-week high of $45.40, and 22% over its 52-week low of ~$31.55.
MAIN is a solid company and should be on your watch list. We advise waiting for the next market meltdown or hysteria-driven event when you may be able to jump aboard at lower valuations.
All tables furnished by Hidden Dividend Stocks Plus, unless otherwise noted.
Be the first to comment