

Igor Kutyaev
China stocks have taken a drubbing over the last year. The world’s second-biggest economy has endured a lot of headwinds from Covid lockdowns to a very restrictive government authority. Just recently, though, its central bank cut its policy rate in an accommodative move amid dismal economic data. Alibaba (BABA) has been slashed in half since August 2021 while other tech and consumer-related names are also down sharply. The KraneShares CSI China Internet ETF (KWEB) has been a favorite among short sellers since early last year. One of its top holdings has an important earnings date next week.
One-Year Ex-US Stock Market Performance Heat Map: Big Red In China
Finviz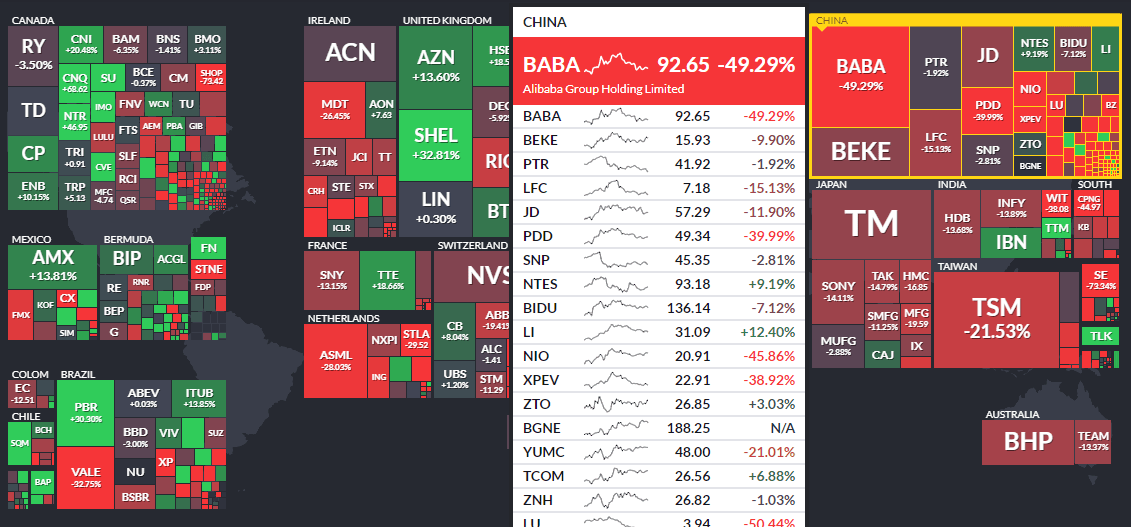
According to Bank of America Global Research, Pinduoduo Inc. (NASDAQ:PDD) is one of China’s top e-commerce platforms that provides buyers with a broad selection of cost-effective merchandise and a dynamic social shopping experience. Buyers can make team purchases on either PDD’s platform directly or through social channels, such as Wexin and QQ. Leveraging social networks is an effective and efficient instrument to attract users and improve user engagement, and PDD accomplished 76 billion total orders with 869 million active buyers in 2021.
The Shanghai-based $64 billion market cap Internet & Direct Marketing Retail industry company within the Consumer Discretionary sector trades at a lofty price-to-earnings ratio of 33.9 and does not pay a dividend, according to The Wall Street Journal.
BofA analysts expect PDD’s earnings to grow at a high rate through 2024 after a big pandemic-related decline in 2020. Free cash flow is also seen as building notably. As a result, the P/E ratio is not particularly high considering the EPS growth rate. Still, its EV/EBITDA multiple is elevated at the moment.
Pinduoduo Earnings, Free Cash Flow, Valuation Forecasts
BofA Global Research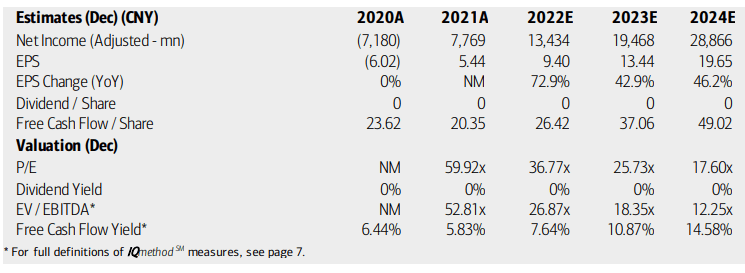
Pinduoduo’s corporate event calendar by Wall Street Horizon shows an unconfirmed earnings date for Q2 results on Friday, August 26, BMO. The I/B/E/S consensus earnings estimate is CNY2.76 of profits, which would be a 27% advance from the same quarter a year ago. Strong e-commerce sales and some subsidies are seen as boons for PDD.
PDD Corporate Event Calendar: Q2 Results On Tap
Wall Street Horizon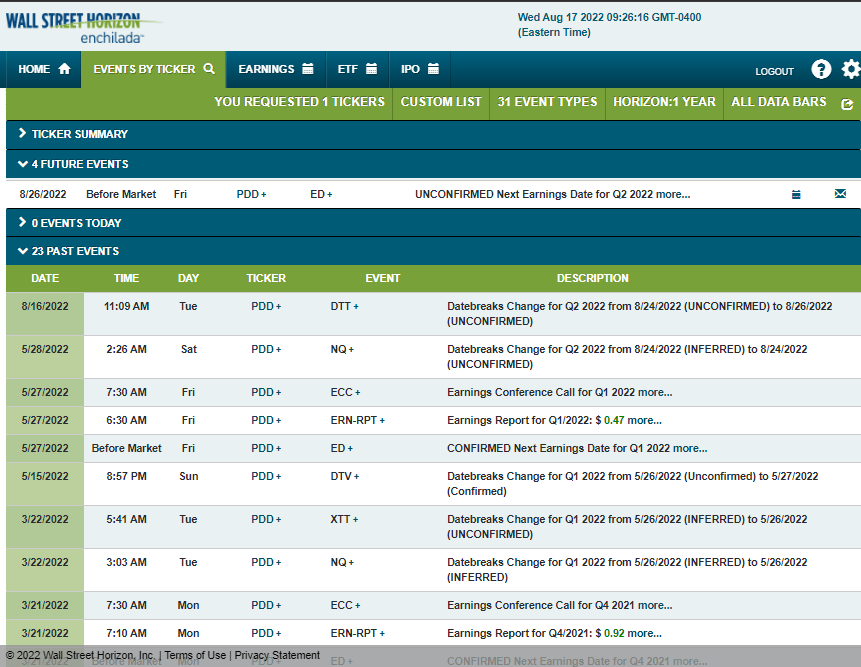
Traders expect an 8.1% earnings-related stock price move following next week’s Q2 report using the at-the-money straddle on the nearest-expiring options, according to data from Options Research & Technology Services. PDD has beaten earnings expectations in three of its past four quarterly reports.
PDD Earnings Preview: A Beat Rate History and an 8% Expected Stock Price Swing
ORATS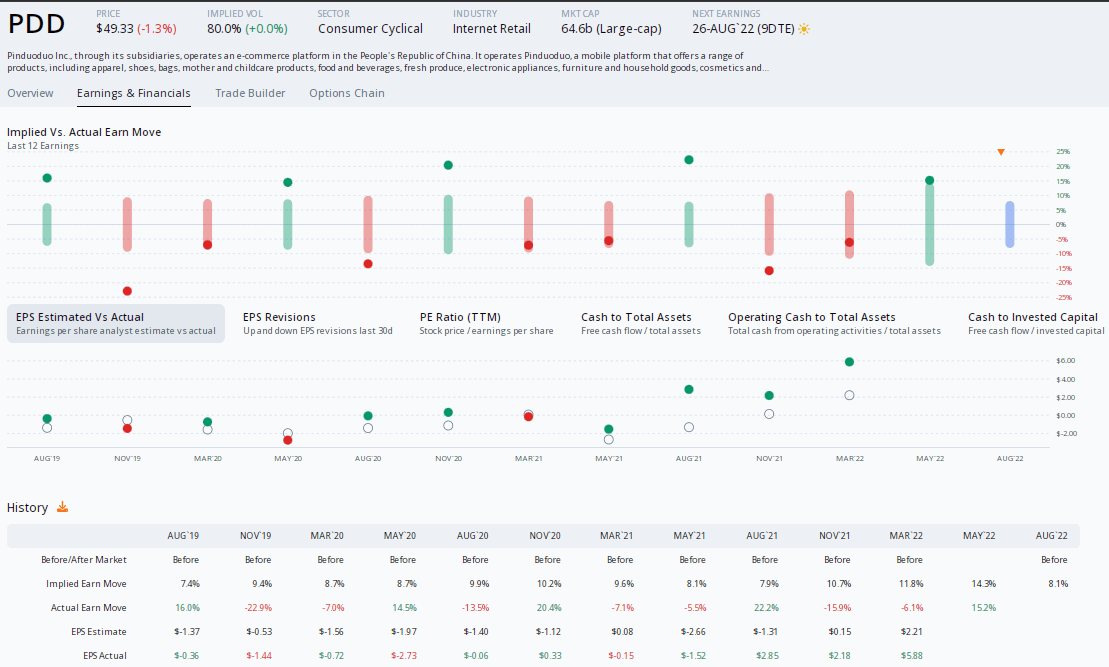
The Technical Take
Pinduoduo shares have important support in the mid-$40s. That was a pivotal high in November 2019 and a support point in May 2020. More recently, that area found buyers around the turn of the year, but then the stock broke down, and the mid-$40s was resistance during PDD’s Q2 rebound. Being long here with a stop below $44 makes sense.
Resistance is seen near $70. So, while I see significant upside potential, profits should be booked around its June-July highs. Also take note of the volume spike we saw this past March—that tells me there was solid capitulation selling. Volume has eased in that time even as the stock re-tested the lows in May. Perhaps that was a solid washout.
PDD Shares Hover Near Support After A March Washout, $70 Resistance
Stockcharts.com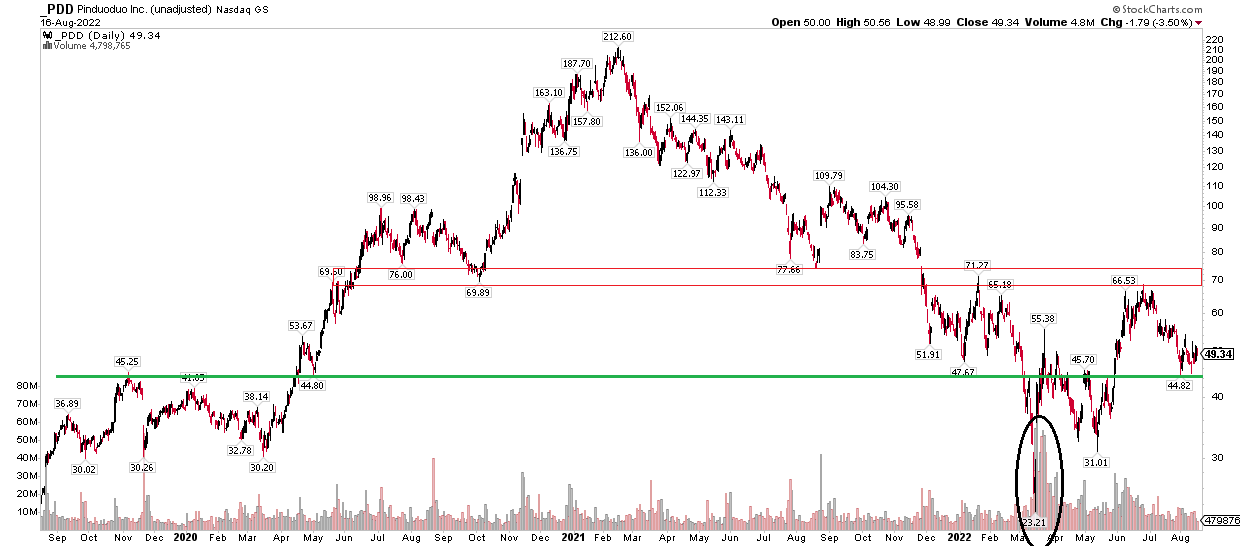
The Bottom Line
PDD shares look attractive here ahead of earnings. The stock is above important support and the chart suggests about $20 of possible upside. Fundamentally, the company’s robust growth rate more than offsets a seemingly high P/E ratio.
Be the first to comment