

Eoneren
Intro
We wrote about Hollysys Automation Technologies Ltd. (NASDAQ:HOLI) back in early 2021 when we liked what we saw concerning the company’s fundamentals and technicals. As the long-term chart illustrates below, shares briefly traded close to the $10 area back in early 2020 before registering a long-term buy signal through the popular MACD technical indicator. Because of how many shares were oversold at that time, we began to trade the stock in 2020 from the long side before finally liquidating our long exposure in Hollysys when shares lost their 10-month moving average in the following year.
From a technical standpoint at present, with shares stagnating over the past few months and the monthly MACD locked in a neutral position, Hollysys seems to be at a crossroads concerning its near-term trend. In saying this, any bullish move here in the near term should bring trend followers into play on the long side, so the next few weeks of trading in this stock will be interesting.
HOLI´s Trend Remains Bullish long-Term (StockCharts.com)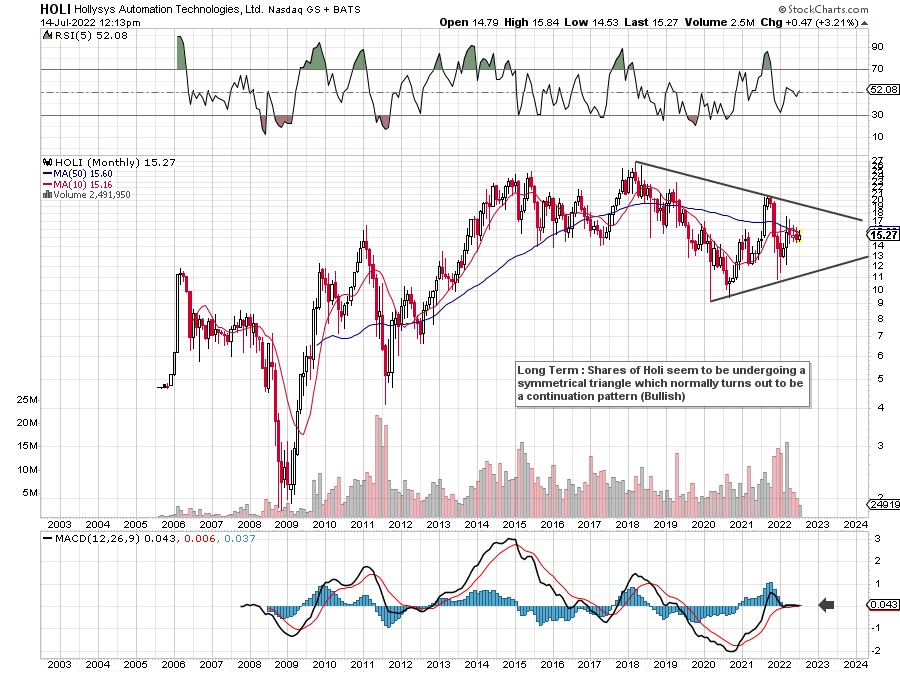
What we are saying above regarding shares of HOLI currently at a crossroads can also be seen on the daily chart. We state this because volume trends have been very encouraging recently, but shares remain in a fight not to lose their 200-day moving average. Suffice it to say, shares must regain this crucial support level to ensure a bearish descending triangle does not play out to the downside.
Daily Chart Of HOLI (StockCharts.com)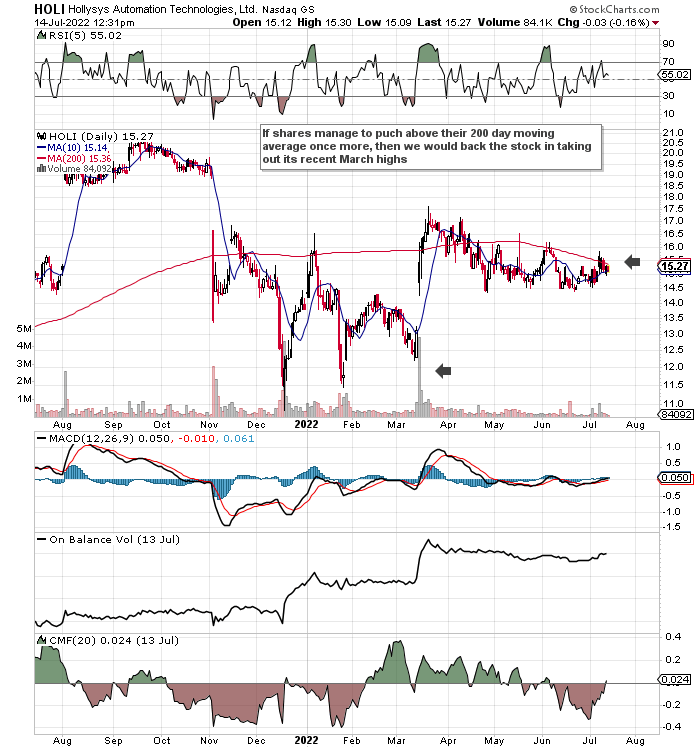
Suffice it to say, given the downside potential which is still clearly evident on the monthly chart, we are only interested in trading HOLI once shares regain their 200-day moving average once more. Long-term, this stock is going higher, but we would rather not be on the other side of the trade temporarily and thus suffer an opportunity cost over a given time period which could turn out to be many months.
On the contrary, long-term investors who do not mind collecting the dividend while we wait for a significant up-move just need to keep focused on the following. Many investors focus on cash-flow metrics in a stock but sometimes make the mistake of not focusing on the potential for sustained cash-flow generation over the long term. With respect to Hollysys (being a profitable company for many years now), it is all about how its earnings get converted into cash over the long haul.
Well in the company’s most recent reported quarter, Hollysys’ cash balance and short-term investments came in well over $700 million. Given the company’s present market cap of $948 million, this $700+ million number is the real calling card in Hollysys for the following reasons.
Profitability Trends
How does a cash balance usually get whittled down in a stock which results in cash exiting a company? This usually comes from a negative earnings trend where not enough cash is being generated to pay for operations, pay dividends or pay debts, etc. if needs be. Hollysys though is expected to announce 29% bottom-line growth ($2.09 per share) on revenues of $586 million (8% growth rate) in the fiscal year that ends in June 2022. Furthermore, shareholder equity ($1.227 billion) continues to grow and Hollysys has no debt to speak of on its balance sheet. Suffice it to say, as long as Hollysys can report sufficient sales to keep earnings and cash-flow numbers buoyant, then the balance sheet should keep on getting stronger from strategic investments in each of the company’s segments.
Valuation
This takes care of the profitability argument from an earnings standpoint, but what if we are wrong? What if Hollysys does not live up to its billing with respect to what is expected from the stock going forward? Well, in essence, there are two drivers of long-term earnings growth which are Hollysys’ assets and also its sales. At present, Hollysys trades with a book multiple of 0.77 and a sales multiple of 1.36 which are both easily 50%+ beneath the stock’s respective 5-year averages for these multiples. These multiples would obviously be significantly lower if shares indeed did test the lower trend-line in the long-term chart depicted above.
Now, as we touched on earlier, Hollysys’ assets as well as its sales are growing so if the stock remains rangebound or even declines from its present levels, the company’s assets and sales are going to become cheaper and cheaper over time. Remember, in the short run, a stock market is a voting machine, but in the long run, it is a weighing machine. Hollysys fits this description well with respect to its valuation, balance sheet, and profitability trends at present.
Conclusion
Therefore, to sum up, we will be watching Hollysys carefully over the next few weeks to see if shares can punch above their 200-day moving average once more. Long-term, shares are going higher, but we want to time an entry in here as best we can. We look forward to continued coverage.
Be the first to comment