

bazilfoto/iStock via Getty Images
This dividend exchange-traded fund (“ETF”) article series aims at evaluating products regarding the relative past performance of their strategies and quality of their current portfolios. As holdings and their weights change over time, reviews may be updated when necessary.
PID strategy and portfolio
The Invesco International Dividend Achievers ETF (NASDAQ:PID) has been tracking the NASDAQ International Dividend Achievers Index since 09/15/2005. As of writing, it has 47 holdings, a 12-month distribution yield of 3.65% and a total expense ratio of 0.53%.
As described in the prospectus by Invesco, the underlying index selects companies that:
- Are listed in the U.S., and in some cases on the LSE in London.
- Are incorporated outside the U.S. and countries of beneficial interest.
- Have increased their annual dividends each of the last five years.
- Have an average daily dollar trading volume of at least $1 million.
- Have not entered an agreement or proceeding resulting in ineligibility.
The weighting methodology is based on the 12-month dividend yield, with a maximum weight of 4% per constituent. The index is reconstituted once a year in March and rebalanced quarterly. A constituent may be excluded at any time if it becomes ineligible. In this case, it is not replaced until the next reconstitution. I pass on the details that guarantee index integrity in case of corporate events (stock split, M/A, spin-off…).
Canada is the heaviest country by far, with about 56% of asset value. The UK is a pale second at 11%. Other countries are below 5%. This concentration is a consequence of the New York or London listing requirement. It is a strong limitation compared to other international dividend growth funds like Vanguard International Dividend Appreciation ETF (VIGI) (reviewed here). The next chart plots the top 10 countries, for an aggregate weight of 93%.
PID countries (chart: author: data: Invesco)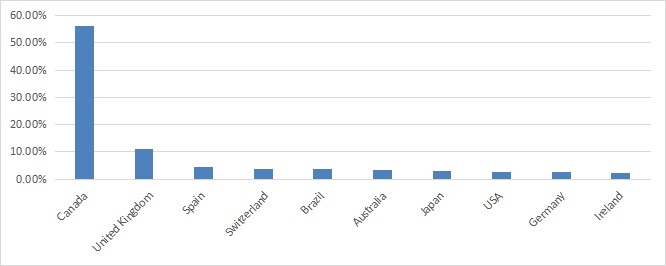
The top 2 sectors are utilities (20.5%) and financials (16.8%). Other sectors are below 11%.
PID sectors (chart: author: data: Invesco)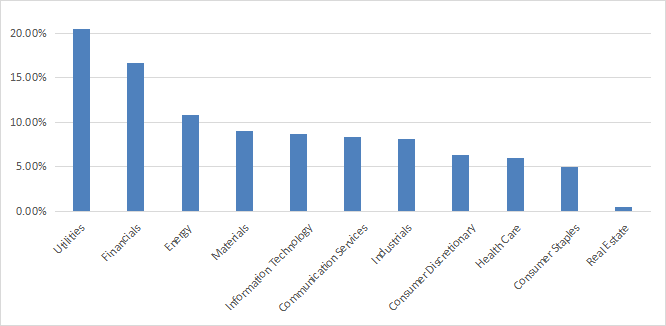
The top 10 holdings, listed below with yields and other ratios, represent 37% of asset value. The heaviest one weighs less than 5%, therefore risks related to individual stocks are moderate.
|
Ticker |
Name |
Weight % |
EPS growth % TTM |
P/E TTM |
P/E fwd |
Yield % |
|
Atlantica Sustainable Infrastructure plc |
4.42 |
-153.63 |
N/A |
76.56 |
5.56 |
|
|
Enbridge Inc. |
3.99 |
-18.34 |
21.34 |
17.96 |
6.42 |
|
|
BCE Inc. |
3.94 |
6.61 |
19.24 |
18.13 |
5.87 |
|
|
Restaurant Brands International Inc. |
3.93 |
19.69 |
22.18 |
19.22 |
3.69 |
|
|
Algonquin Power & Utilities Corp. |
3.80 |
-74.94 |
48.53 |
18.42 |
5.33 |
|
|
Banco Santander (Brasil) S.A. |
3.61 |
N/A |
N/A |
6.99 |
8.68 |
|
|
TC Energy Corp. |
3.41 |
60.27 |
18.59 |
14.67 |
5.82 |
|
|
National Grid plc |
3.39 |
42.96 |
14.30 |
15.62 |
5.18 |
|
|
Rio Tinto |
3.37 |
-4.77 |
5.00 |
5.74 |
13.59 |
|
|
Canadian Imperial Bank of Commerce |
3.27 |
6.46 |
8.49 |
8.15 |
5.42 |
Past performance compared to its closest competitors
The next table compares the fund’s performance and risk metrics with two international ex-US dividend growth funds: the WisdomTree Global ex-U.S. Quality Dividend Growth ETF (DNL) and the Vanguard International Dividend Appreciation ETF, since the latter’s inception in February 2016. PID is a winner by a short margin in annualized return (36 bps ahead of DNL), but it shows a significantly higher risk, measured in maximum drawdown and volatility (standard deviation of monthly returns).
|
Since VIGI Inception |
Total Return |
Annual.Return |
Drawdown |
Sharpe Ratio |
Volatility |
|
PID |
59.20% |
7.42% |
-43.36% |
0.43 |
17.98% |
|
VIGI |
50.06% |
6.44% |
-29.73% |
0.44 |
13.76% |
|
DNL |
55.77% |
7.06% |
-31.64% |
0.45 |
15.80% |
Data calculated with Portfolio123
PID is also the winner year-to-date (see next chart).
PID vs. competitors YTD (Portfolio123)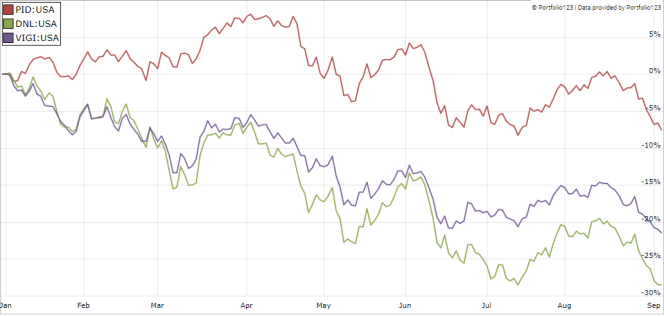
PID vs. international high-yield ETFs
The next chart compares PID with four high-yield global ETFs year-to-date: the First Trust Dow Jones Global Select Dividend ETF (FGD), the SPDR S&P Global Dividend ETF (WDIV), the Global X SuperDividend ETF (SDIV) and the Schwab International Dividend Equity ETF (SCHY). PID leads the pack once again.
PID vs. high-yield funds YTD (Portfolio123)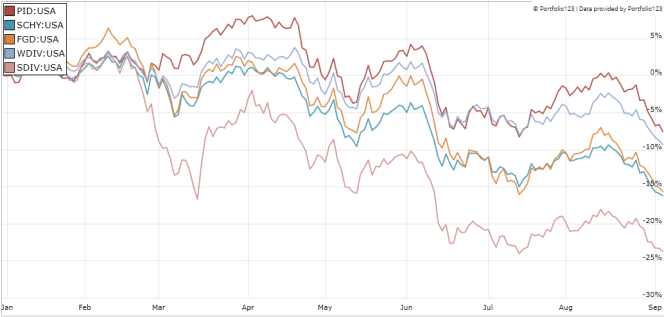
SDIV has the highest yield and the worst performance, showing once again the risks of high-yield funds. I have pointed out in several ETF reviews that securities with yields above 6% suffer from capital decay on average (there are rare exceptions).
Takeaway
PID holds 47 international dividend-growth stocks. Over half of asset value is invested in Canadian companies. Utilities and financials are the heaviest sectors. PID has beaten its international dividend growth competitors DLN and VIGI since 2016 and in 2022 to date. However, volatility and drawdown point to a higher risk. PID also beats high-yield funds this year. For transparency, a dividend-oriented part of my equity investments is split between a passive ETF allocation and my actively managed Stability portfolio (14 stocks), disclosed and updated in Quantitative Risk & Value.
Be the first to comment