

SolStock
Investment Summary
Investors have heavily rewarded AMN Healthcare Services, Inc (NYSE:AMN) following the June bounce in equities and shares now trade a shade off 52-week closing highs. With investors turning to bottom-line fundamentals and seeking exposure to quality/resiliency, no longer can portfolio managers/investors expect the beta-driven returns of the past decade. Instead, company-specific [versus market-specific] growth drivers are paramount, as is the case for AMN. Here I brush over AMN’s latest numbers and then dive deeper into the company’s growth-engine to demonstrate a high degree of profitability and earnings upside on offer. Net-net we rate AMN a buy on a $133 price objective.
Exhibit 1. AMN 12-month price evolution
Data: Refinitiv Eikon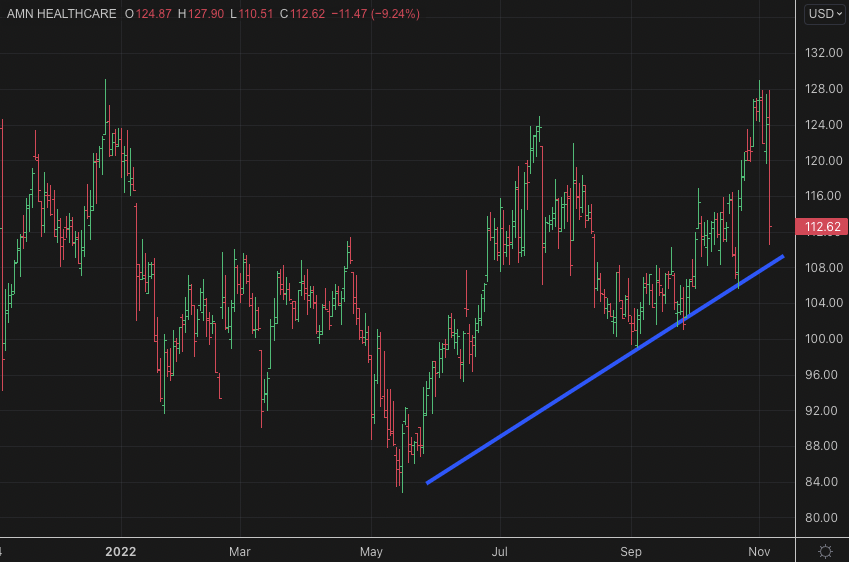
AMN Q3 numbers exhibit strong top-bottom line growth
Third quarter earnings came in relatively strong for AMN. It scored double-digit YoY growth and upsides versus consensus at the top and bottom lines. Quarterly revenue of $1.138 billion (“Bn”) came in at a 30% YoY growth schedule, however, turnover did decline by 20% from Q2 FY22. This was due to an expected 25% wind-back in average bill rates booked in AMN’s nurse and allied solutions (“NAH”) division. These rates peaked in the first quarter of 2022. Alas, even though the NAH segment was still strong with a 32% YoY gain to $828 million (“mm”) [$19.1/share], looking to Q4 FY22, management guide to further 29% YoY decline in NAH revenue due to this flattening in average bill rates.
The travel nurse division also grew 31% YoY and management note that demand for travel nursing “remains well above pre-pandemic levels with strength across all specialties” in the earnings call. Meanwhile, the physician and leadership solutions segment saw 16% YoY growth to $175mm [$4.04/share] and outpaced guidance. Both the Locum Tenens and Interim Leadership business’s turnover increased by 19% and 9% YoY respectively. Technology and workforce solutions (“TWS”) revenue clipped $135mm [$3.12/share], a 35% YoY growth schedule that outpaced guidance by 500bps. Of this, VMS revenue growth stood out at 80% to $60mm [$1.41/share] – however this also contracted sequentially from $75mm in the prior quarter. Growth in the TWS segment was underscored by a $12Bn TTM expenditure into the MSP and VMS segments, with VMS alone now serving more than 500 clients, per the Q3 earnings call.
Moving down the P&L, Q3 gross margin compressed by ~100bps YoY to 33.8%, whereas GAAP earnings pulled into $92mm or $2.10 per share, a growth of 36% YoY. The company reported non-GAAP earnings of $2.57 per share which was a 48% YoY growth. Looking ahead, management have baked in several headwinds to Q4 revenue guidance, now forecasting a 21-23% YoY contraction in turnover to $1.05-$1.08Bn. This estimate factors in a 768bps labour disruption headwind from the year prior, and a 25% lower average bill rate in the NAH segment. We are aligned with management’s numbers and are projecting $1.06Bn in Q4 revenue for the company and see it pulling this down to $1.80 in GAAP EPS, a 25.6% YoY decrease. In addition, we’ve forecasted EPS of $9.77 in FY22, with this winding back to $7.29 in FY23. All HB Insights AMN quarterly and annual forecasts into FY24 are seen in the table below.
AMN quarterly forward estimates exhibit earnings upside that’s matched by robust strength in profitability, as discussed below.
Data: HB Insights Estimates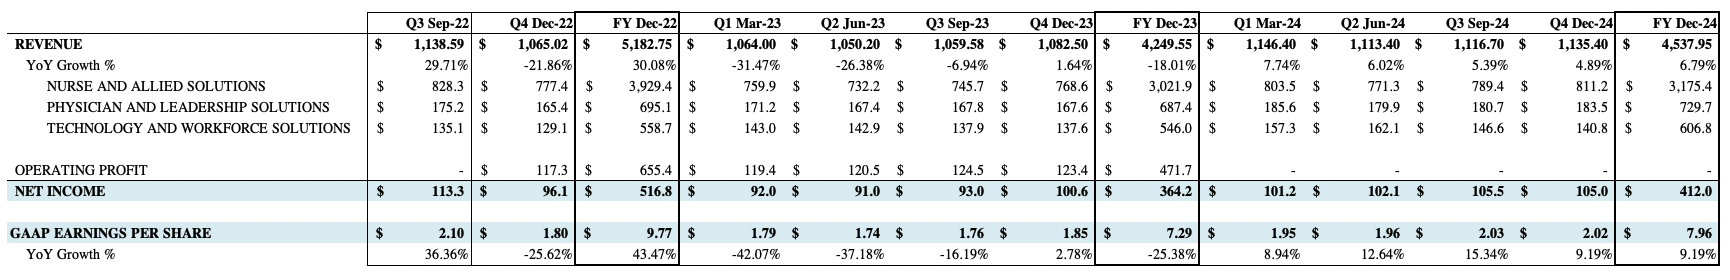
AMN deeper view of fundamentals
To put AMN’s latest numbers into context, a deeper dive into management’s value-add over time is required. As seen in Exhibit 2, AMN has demonstrated a substantial uplift in TTM return on invested capital (“ROIC”) since lows of c.700bps in Q4 FY20. Up until this point, FCF remained in a cyclical uptrend from FY15-FY20 as well. This created a bifurcation to earnings yield and ROIC as the latter two continued to trend downward. Ultimately, the increasing FCF coupled with declining ROIC and earnings yield suggests management’s capital budgeting strategy could have been inefficient from FY15-Q3 FY20.
From this point however, there’s been a notable upshift in all three of these measures. Visibility on future cash flows is enhanced by the fact AMN has witnessed a gain in TTM ROIC coupled with its cyclical FCF flows. It suggests to me that capital has been invested efficiently and wisely, and there’s been a subsequent return on these investments that’s pulled through below the bottom line to FCF. Key difference this time is that cash/capital is being reinvested at a double-digit return, well above the cost of capital.
Exhibit 2. From FY20, return on investments and earnings yield have each curled upward along with cyclical uptrend in FCF.
Note: All figures in $mm or [%] (Data: HB Insights, AMN SEC Filings)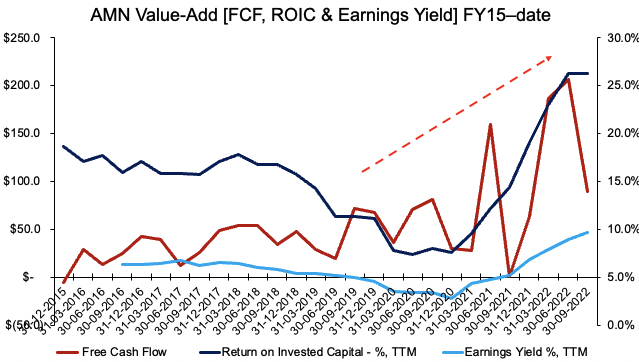
Breaking ROIC down into its sub-components, as seen in the table below, shows the lift in ROIC is caused by a spike in invested capital turnover, versus increased NOPAT margin. In fact, NOPAT margin has tightened by 100bps since Q3 FY20 whereas invested capital turnover’s clicked up by 0.1x, with quarterly ROIC up 100bps in this time. This indicates that management have been more active in AMN’s capital budgeting cycle and have been investing more regularly to drive return on capital.
Exhibit 3. Return on invested capital breakdown into sub-components indicates upside driven by increased turnover over investments made by management
Data: HB Insights, AMN SEC Filings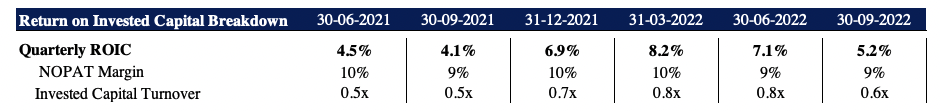
As a result of this performance, I’ve noted that management have generated substantial growth in economic value added (“EVA”) as seen in the chart below. Management’s EVA has increased 1.6 turns since Q2 FY22 to $414mm in Q3 FY22, spurred on by an increased in invested capital turnover [discussed above] and widening spread between ROIC to WACC. As such, AMN’s ROIC comfortably outpaces its WACC hurdle in each of the periods examined to date. With this assessment, my estimation is that management have begun to turn up focus on capital budgeting versus priority on top-line growth. This measures up well in the current economic climate.
Exhibit 4. EVA breakdown illustrating management’s value-add over the past 12-months to date
Data: HB Insights
Meanwhile AMN’s TTM ROE also surged up from FY20 lows to ~41% in the previous quarter. With AMN trading at 4.5x book value, the investor ROE is still 9.11% when paying that multiple. As seen in Exhibit 5, the reversal in ROE occurred in tandem with EPS upside that’s seen the company’s bottom-line growth push to more than $2 in quarterly EPS in Q3 FY22.
Breaking down ROE further and we see the change in return has been pushed by changes in earnings and asset turnover, versus any effect from leverage. As a result, ROE growth to date has been clean and relatively organic in my estimation.
Exhibit 5.
Data: HB Insights, AMN SEC Filings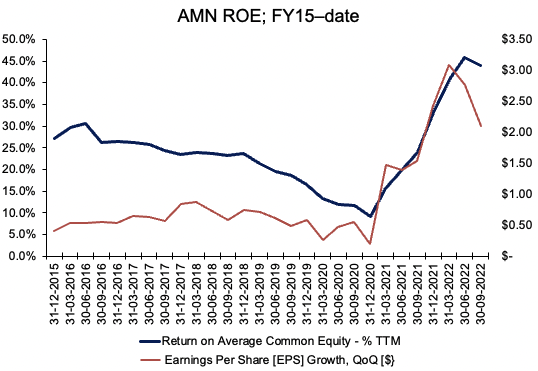
Exhibit 6. ROE Breakdown illustrates that growth in ROE stems from changes in earnings and asset turnover, versus impact from leverage
Data: HB Insights Estimates, AMN SEC Filings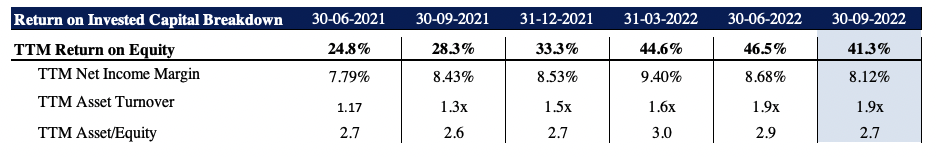
Valuation and conclusion
Valuing AMN really depends on how the investor intends to look at the company’s earnings, in addition to its profitability [already discussed above]. If comparing its FY21 GAAP EPS actual of $6.81 to our EPS forecast of $9.77, this would suggest AMN is worth $161.50 and has 43.5% return potential, as seen in Exhibit 7.
However, the upside is negligible when considering the TTM EPS of $10.39, where growth is far flatter than annual the figures. In this case, it suggests AMN is worth $105.90 – or ~690bps downside at the time of writing. Question is, what’s the best set of data to use and why? Observing the arithmetic mean of the two outcomes implies the AMN share price is worth $133.70, around 19% upside at the time of writing. This is a figure I’m happy with as normalization/averages reflect a good range of outcomes.
Exhibit 7. FY21 EPS vs. FY22 EPS Est.
Data: HB Insights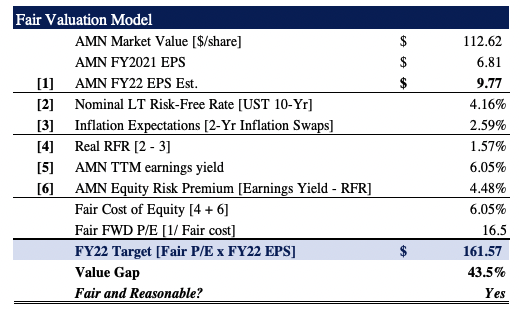
Exhibit 8. TTM GAAP EPS vs. FY22 GAAP EPS Est.
Data: HB Insights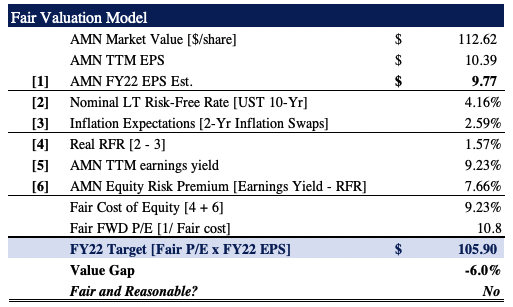
In that vein, it would appear there is both earnings upside and potential appreciation for the AMN share price looking ahead, should this growth materialize.
Net-net, there’s enough evidence available to suggest there’s compelling value to unlock in the AMN share price. With company fundamentals supportive of multiple expansion, I’m comfortable at pricing the stock at $133, and look forward to further earnings upside ahead. I rate AMN a buy on this valuation, and would be seeking around 19-20% investment return at that price objective.
Be the first to comment