

8vFanI/iStock via Getty Images
Have you checked out the Business Development Company industry recently? Known as BDCs, these firms lend money to privately held companies, which also have co-sponsors, such as VCs and hedge funds.
We’ve covered several BDCs in our weekend articles recently, and this week we’re covering PennantPark Floating Rate Capital (NYSE:PFLT), a BDC under the Pennant Park Investment Advisors Group platform.
Profile:
PFLT seeks to make secondary direct, debt, equity, and loan investments. It focuses on companies that are owned by established middle-market private equity sponsors with a track record of supporting their portfolio companies.
The fund seeks to invest through floating rate loans in private or thinly traded or small market-cap, public middle-market companies. It primarily invests in the United States and to a limited extent non-U.S. companies. The fund typically invests between $2 million and $20 million. It also has PSSL, a Senior Secured Loan Fund.
PFLT’s $1.19B portfolio consisted of $1.03B of 1st lien secured debt, 87%, (including $170.3M in PSSL), $1.0M of 2nd lien secured debt, and $159.6M of preferred and common equity (including $55.4 million in PSSL), as of March 31, 2022. It also had 13% in Subordinated Debt, and Preferred & Common Equity.
As of 3/31/22, PSSL’s portfolio totaled $705M, and consisted of 87 companies with an average investment size of $8.1M, and had a weighted average yield on debt investments of 7.4%.
PFLT’s debt portfolio consists of 100% variable-rate investments
PFLT site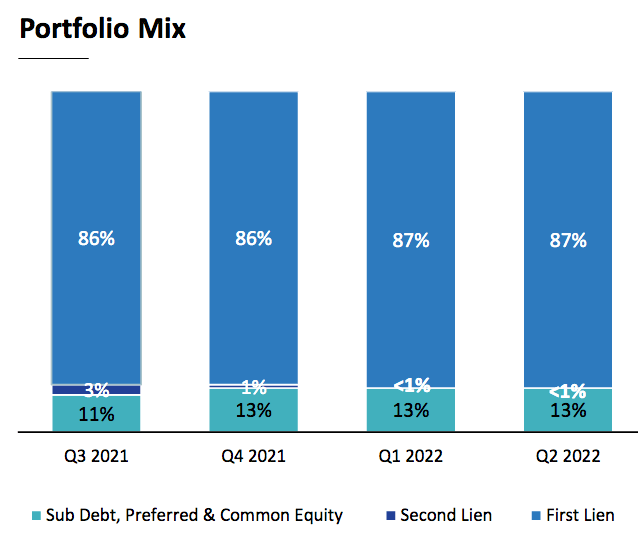
The overall portfolio consisted of 119 companies with an average investment size of $10.0M and had a weighted average yield on debt investments of 7.5%.
PFLT site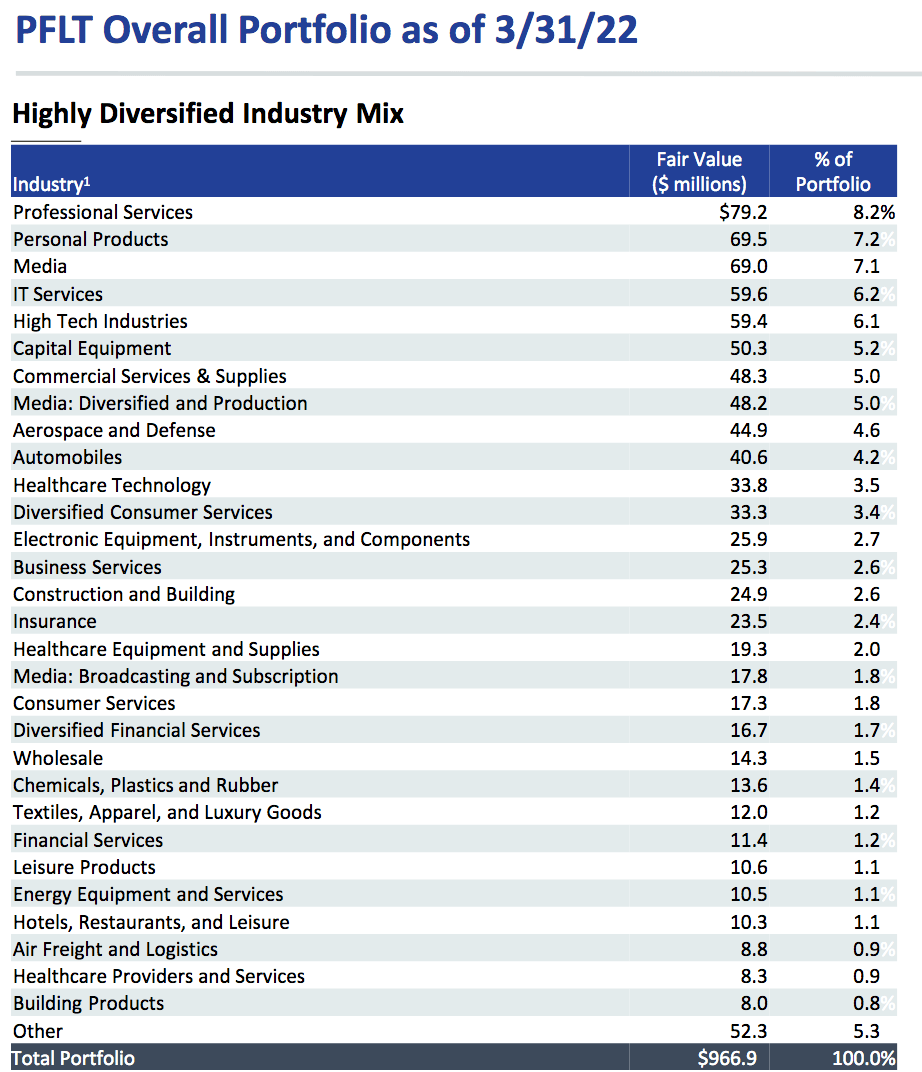
The firm has typically done new originations with over 80% repeat sponsors – this dipped to 76.5% in 2019, jumped to 88% in 2020, and was 0ver 82% in 2021:
PFLT site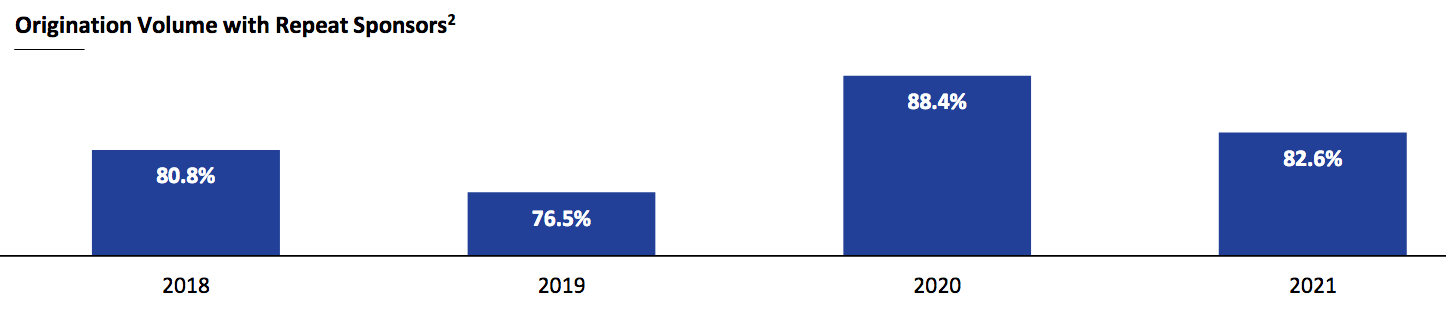
Since 2015, PFLT has invested 37% in companies with less than $20M in EBITDA; 34% in the $20 – $50M EBITDA ranges; and 29% in the above $50M range:
PFLT site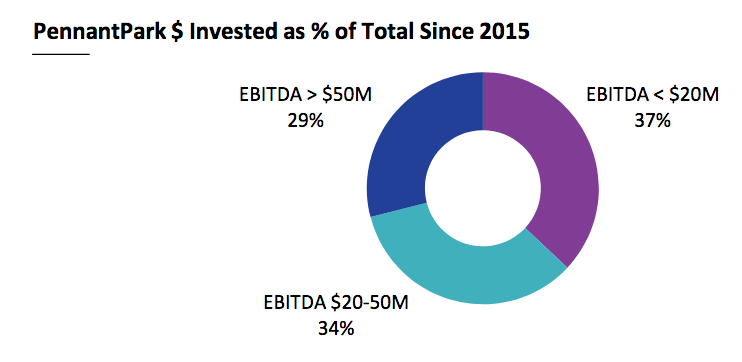
Growth has been the highest in the sub-$20M group, averaging 84%, vs. 25% for all-size companies. PFLT’s rate of return on this group is also higher, at 11.9%, vs. 10.6% for all deals:
PFLT site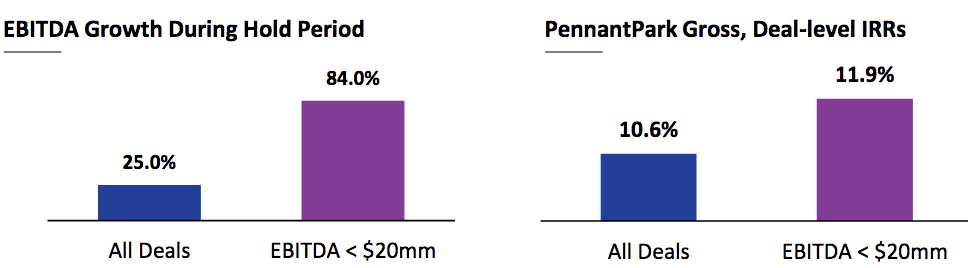
There’s an interesting, non-intuitive point about losses for small companies vs. large companies. Wouldn’t you think that smaller companies are more likely to create losses? However, that’s not the case – large corporate loans have a higher default rate, and a lower recovery rate than middle-market companies historically.
PFLT had 2 portfolio companies on non-accrual as of 3/31/22, representing 2.5% and 2.3% of its overall portfolio on a cost and fair value basis, respectively.
PFLT site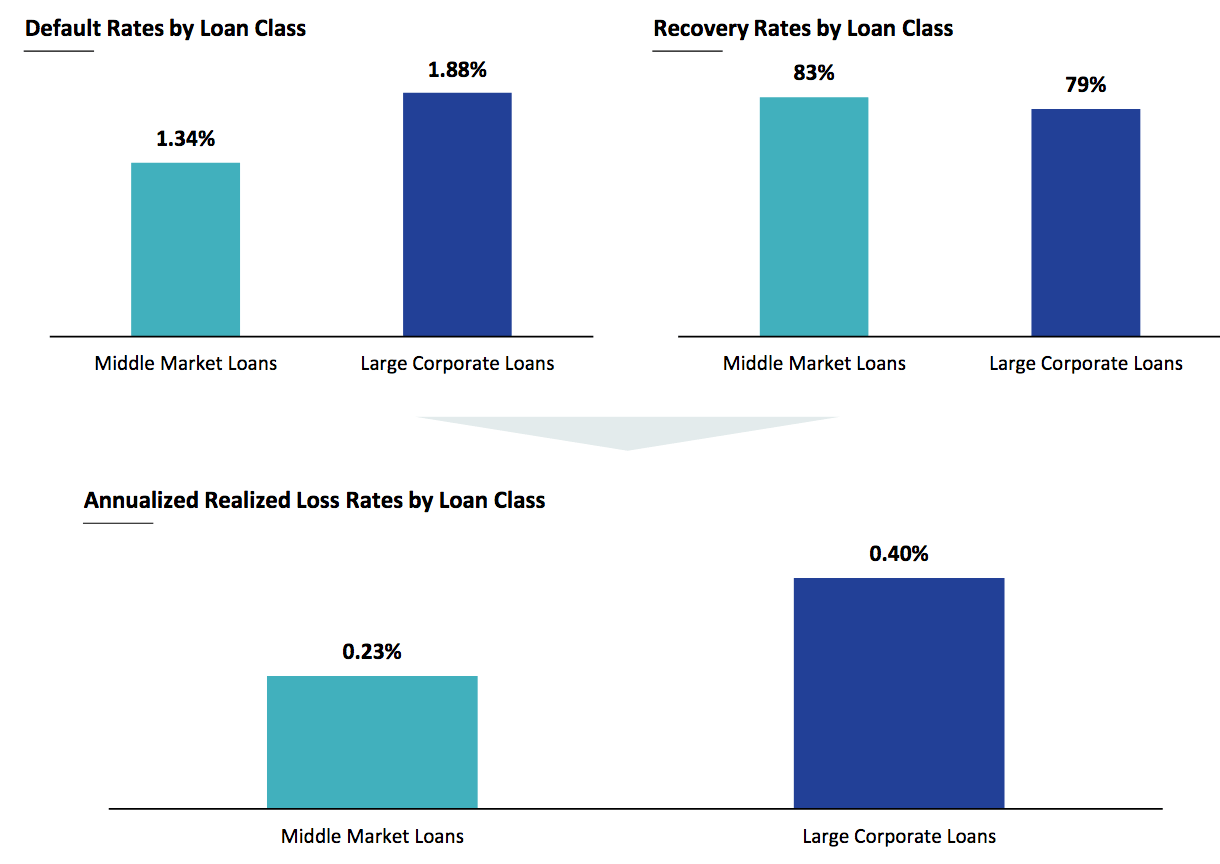
Earnings:
PFLT’s total investment income was by ~-6% in calendar year 2021, with NII and NII/Share down slightly, -2%. Realized and Unrealized Gains both rose significantly, while NAV/Share rose 2.5%.
Q1 ’22 had good growth, even in a tough market, with total investment income jumping by ~27%, and NII up by 14.7%. Realized Gains, which, like Unrealized Gains, are lumpy, due to timing issues, were -$15M, while Unrealized Gains were $11.3M. NII/Share rose 11.5%, while NAV/Share was down -0.71%.
NOTE: PFLT’s fiscal year ends on September 30th.
Hidden Dividend Stocks Plus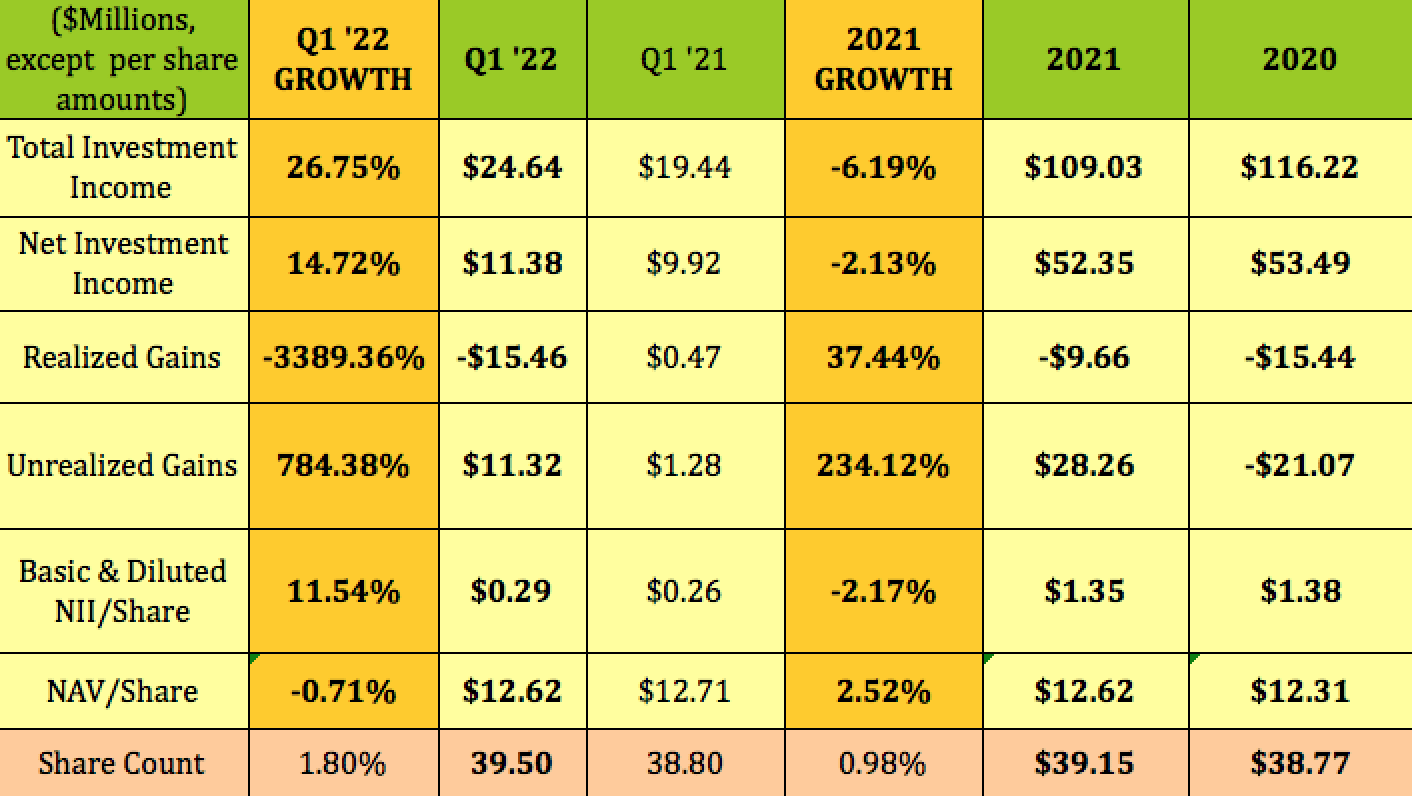
New Business:
In Q1 2022, PFLT invested $113.2M in 7 new and 29 existing portfolio companies, with a weighted average yield on debt investments of 7.2%. Sales and repayments of investments for Q1 2022 totaled $103.9M.
Dividends:
At $10.82, PFLT yields 10.54%. It’s not a dividend growth stock – it has paid $.095/month since Q1 2015. Trailing NII/Distribution coverage is solid, at 1.21X. It should go ex-dividend next in mid-July, with an early August pay date.
Hidden Dividend Stocks Plus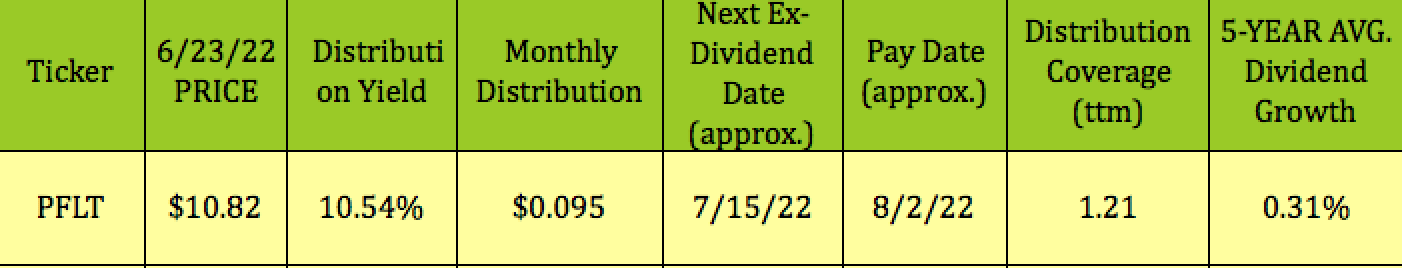
Profitability & Leverage:
PFLT’s ROA and ROE trail BDC averages, while its EBIT Margin is higher. Its Debt/NAV leverage of 1.43X is also higher than BDC average of 1.08X.
Hidden Dividend Stocks Plus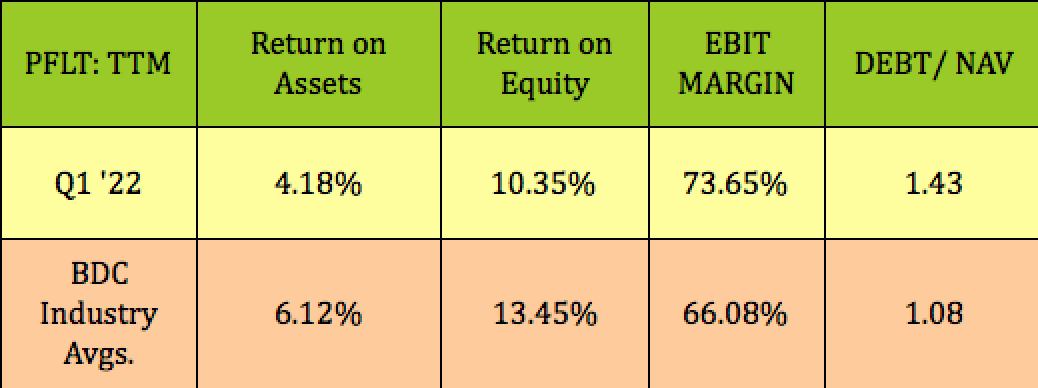
Debt & Liquidity:
As of March 31, 2022, PFLT had cash equivalents of $50.1M available for investing and general corporate purposes. It had $50.3M of unused borrowing capacity under its Credit Facility, as of March 31, 2022.
Its Assets/Debt ratio was 1.73X, and its Interest coverage ratio was 2.78X, a bit lower than the ~3.2X coverage for other BDCs we’ve covered recently.
On 5/2/22, the PSSL Credit Facility was amended to allow PSSL Subsidiary II to borrow up to $325M, up from $225M at any one time outstanding, subject to leverage and borrowing base restrictions.
Hidden Dividend Stocks Plus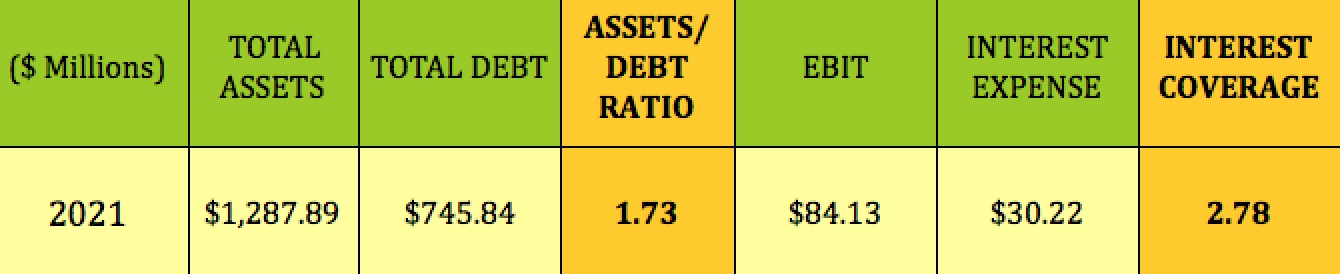
Valuation:
At its 6/23/22 price of $10.82, PFLT is selling at a -14.26% discount to its 3/31/22 $12.62/share. That’s a much deeper discount than the BDC industry average of -5%.
PFLT also looks cheaper than industry averages for earnings, with a Price/NII of 8X, vs. the 12.94X BDC industry average. It’s also cheaper on a P/Sales and EV/EBIT basis, with a very similar dividend yield.
Hidden Dividend Stocks Plus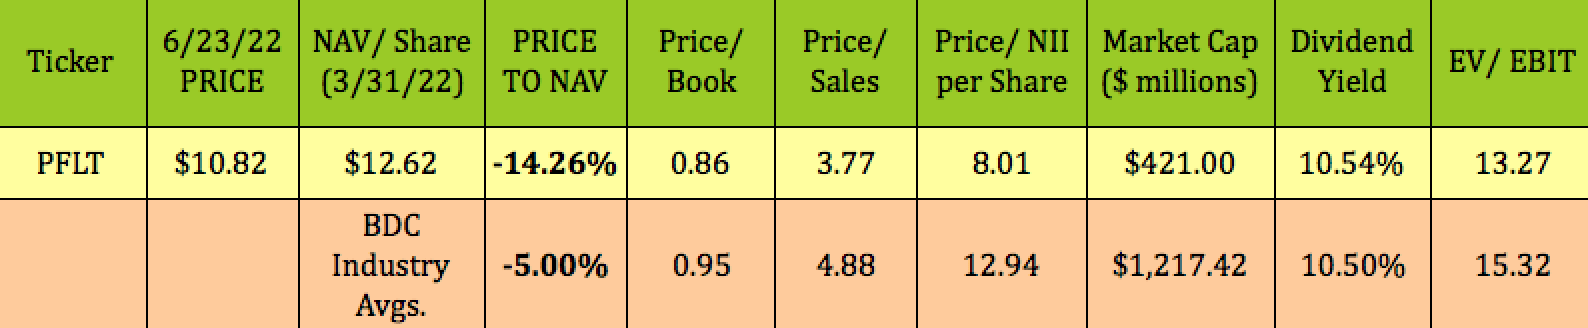
Performance:
PFLT has performed a bit better than the BDC industry so far in 2022 and has outperformed the S&P 500 by a wider margin. It has lagged the market over the past year, quarter and month, while holding up better than the BDC industry over the past month.
Hidden Dividend Stocks Plus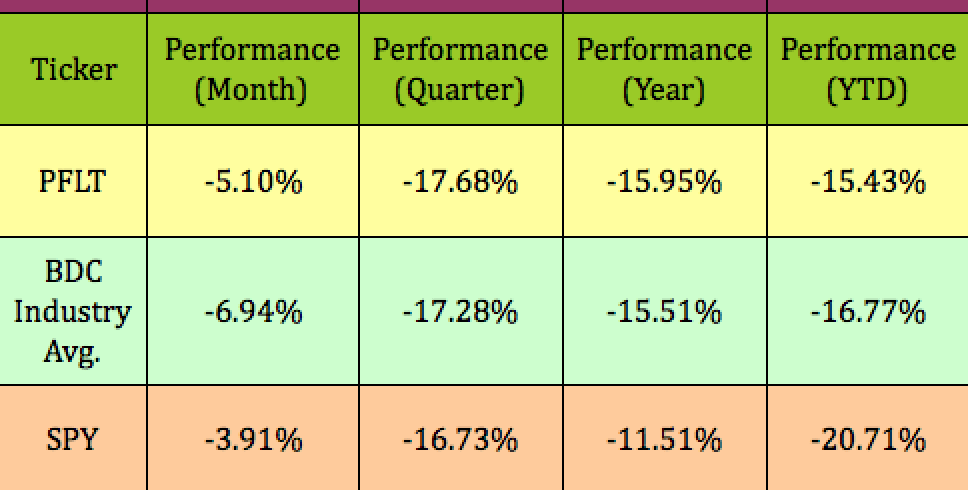
Parting Thoughts:
The market is bouncing between inflation worries and recession fears. PFLT will benefit from higher interest rates, due to its 100% floating rate business model. The other part of the equation is how well PFLT’s companies will fare in a recession, if that were to happen. We may nibble at some shares and take advantage of this deeper discount.
If you’re interested in other high-yield vehicles, we cover them every weekend in our articles. All tables furnished by Hidden Dividend Stocks Plus, unless otherwise noted.
Be the first to comment