

Dmitriy83/iStock via Getty Images
This ETF review series aims at evaluating products regarding the relative past performance of their strategies and quality of their current portfolios. As holdings and their weights change over time, updated reviews are posted when necessary.
PCEF strategy and portfolio
The Invesco CEF Income Composite Portfolio ETF (NYSEARCA:PCEF) is a fund of funds. It tracks the S-Network Composite Closed-End Fund Index. It has 117 holdings and a 12-month distribution yield of 8.63% as of writing. Distributions are paid monthly. The total expense ratio is 1.97%: 0.50% in ETF management fees, plus 1.47% in held funds’ expenses.
Eligible funds are screened on several factors. In particular, premium to net asset value must be under 20%. Weights are based on net asset value and adjusted to favor funds with a discount and penalize those with a premium. Each constituent’s weight is capped at 8%. The top 10 holdings, listed below, represent 25.7% of asset value.
|
Ticker |
Name |
Weight% |
|
PIMCO Dynamic Income Fund |
4.60 |
|
|
Eaton Vance Tax-Managed Global Diversified Equity Income Fund |
2.89 |
|
|
Nuveen Preferred & Income Securities Fund |
2.87 |
|
|
PIMCO Dynamic Income Opportunities Fund |
2.74 |
|
|
Virtus AllianzGI Dividend Interest & Premium Strategy Fund |
2.48 |
|
|
DoubleLine Income Solutions Fund |
2.10 |
|
|
Eaton Vance Limited Duration Income Fund |
2.08 |
|
|
BlackRock Enhanced Equity Dividend Trust |
2.04 |
|
|
Highland Income Fund |
2.01 |
|
|
BlackRock Resources & Commodities Strategy Trust |
1.92 |
Source: Invesco
Closed-end funds are often chosen by investors for their distribution yield. They also have a few metrics that are not applicable to stocks and ETFs. Two of them are more important than the yield:
- Discount to NAV (higher is better).
- Relative discount = Discount to NAV minus its 12-month average (higher is better).
The next table compares PCEF holdings with the full CEF universe regarding these metrics. Two methods are used: simple average and capital-weighted average. Out of 117 holdings, 114 with available data have been taken into account in the calculation.
|
Average discount% |
Average relative discount% |
Capital weighted discount% |
Capital weighted relative discount% |
|
|
PCEF |
5.55 |
1.29 |
4.87 |
1.33 |
|
CEF universe |
7.95 |
2.10 |
7.74 |
2.24 |
Calculation using Portfolio123
By all measures, PCEF holdings are below-par relative to the CEF universe.
Historical data
The next table compares PCEF since inception (February 2010) with U.S. large cap equities (SPY), the total U.S. bond market (BND) and a 60/40 mix. Dividends are included and reinvested to calculate the total return.
|
Total Return |
Annual.Return |
Drawdown |
Sharpe ratio |
Volatility |
|
|
PCEF |
96.67% |
5.46% |
-41.41% |
0.45 |
11.76% |
|
SPY |
353.92% |
12.62% |
-32.05% |
0.83 |
14.83% |
|
BND |
26.20% |
1.85% |
-18.93% |
0.3 |
3.79% |
|
60% SPY 40% BND |
186.29% |
8.62% |
-21.80% |
0.87 |
9.22% |
Data calculated with Portfolio123
PCEF annualized return reinvesting all distributions is below the current distribution rate, which is a clue that the fund may pay a high yield at the cost of capital decay. This is confirmed by the share price (next chart): it has lost 27% since inception:
PCEF share price history (TradingView on Seeking Alpha)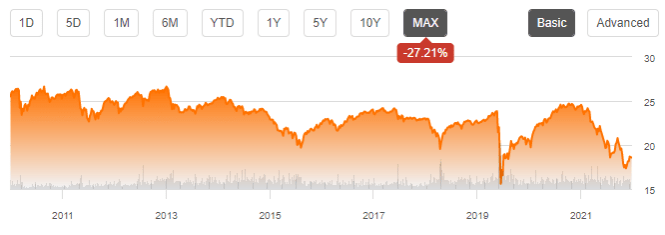
The next table reports the annual sum of distributions per share in the last 10 years. It has been slowly decreasing, losing about 13% between 2012 and 2021.
| year | 2012 | 2013 | 2014 | 2015 | 2016 | 2017 | 2018 | 2019 | 2020 | 2021 |
| annual $ distribution/share | 1.86 | 1.98 | 1.89 | 1.96 | 1.73 | 1.66 | 1.66 | 1.66 | 1.69 | 1.61 |
(calculated with data from Invesco)
In 2022 to date, PCEF beats its closest competitor, the Amplify High Income ETF (YYY), which is also an ETF of CEFs. However, it lags the equity and bond benchmarks (SPY, BND).
PCEF vs YYY, SPY, BND in 2022 (Portfolio123)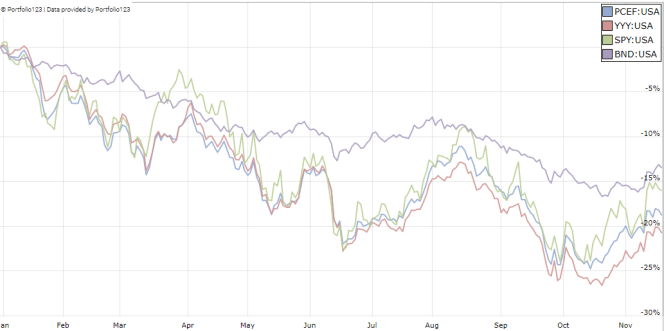
SPY and BND are not good benchmarks for PCEF. I would like to suggest a better one. The next table compares PCEF since inception with a subset of the closed-end fund universe holding a similar number of funds: the 125 CEFs with higher yields among those with an average trading volume above $100’000 per day and a positive discount to net asset value. The subset is rebalanced quarterly in equal weights.
|
Total Return |
Annual Return |
Drawdown |
Sharpe ratio |
Volatility |
|
|
PCEF |
96.67% |
5.46% |
-41.41% |
0.45 |
11.76% |
|
Reference subset |
158.66% |
7.75% |
-47.39% |
0.52 |
14.84% |
Past performance is not a guarantee of future returns. Data Source: Portfolio123
This benchmark, simpler than PCEF underlying index, beats it by a significant margin. A note of caution: PCEF returns are real, whereas the benchmark is simulated, therefore hypothetical.
Takeaway
PCEF selects closed-end funds using a sophisticated rule-based strategy. However, past performance, distribution history, and the average holding discount are underwhelming. A total expense ratio close to 2% doesn’t help. PCEF may be a useful instrument for tactical allocation, swing trading or capturing some market anomalies, but it doesn’t look like a good buy-and-hold investment for investors seeking a sustainable income and capital preservation.
Bonus: a solution to avoid capital decay in CEFs
Capital and income decay is an issue in many closed-end funds, and more generally in many high-yield investments. However, it can be avoided or mitigated by rotational strategies, instead of using CEFs as buy-and-hold instruments. I designed a 5-factor ranking system in 2016, and monitored its performance during 5 years. I started publishing the eight best ranked CEFs in Quantitative Risk & Value (QRV) after the March 2020 market meltdown. The list is updated every week. Its average dividend yield varies around 7-8%. It’s not a model portfolio: trading the list every week is too costly in spreads and slippage. Its purpose is helping income investors find funds with a good entry point. In the table and chart below, I give the hypothetical example of starting a portfolio on 3/25/2020 with my initial “Best 8 Ranked CEFs” list and updating it every three months since then, ignoring intermediate updates. Return is calculated using closing prices, with holdings in equal weights on rebalancing days. Dividends are reinvested at the beginning of every three-month period.
|
since 3/25/2020 |
Total Return |
Annual.Return |
Drawdown |
Sharpe ratio |
Volatility |
|
Best 8 CEFs quarterly |
130.30% |
37.08% |
-20.60% |
1.52 |
20.50% |
|
SPY |
67.62% |
21.57% |
-24.50% |
0.94 |
19.64% |
This calculation was done on 11/15/2022.
This simulation is not a real portfolio and not a guarantee of future return (Chart: author: data: Portfolio123)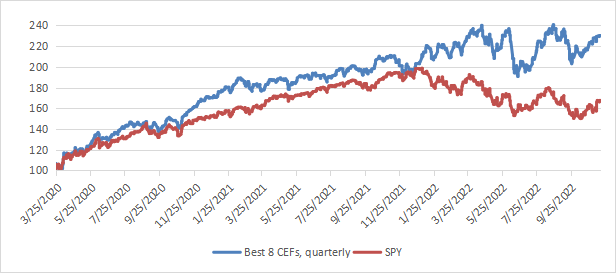
The usual disclaimer says that past performance (real or simulated) is not representative of future return. The “Best 8” list is unlikely to perform as well in a near future as since March 2020. The 2020 meltdown resulted in price dislocation and exceptional opportunities in the CEF universe. The 2022 downturn also was a source of opportunities in energy and infrastructure funds. This is unlikely to be reproducible in a near future. However, I think a discount-driven rotational strategy in CEFs has a much better chance to protect both capital and income stream against erosion and inflation than any high-yield passive investment like PCEF. Dates and lists can be checked in QRV post history.
Be the first to comment