

JHVEPhoto
Over the past year, Johnson & Johnson (NYSE:JNJ) investors have gotten the type of protection from market volatility that they expect. JNJ is considered a classic low-beta, defensive stock that will provide ballast to a broader equity allocation. Over the past 12 months, JNJ has returned a total of 3.6% vs. -10.6% for the S&P 500 (SPY). JNJ also has outperformed the iShares U.S. Pharmaceuticals ETF (IHE), which has returned a total of -3.1% over the past year.
Seeking Alpha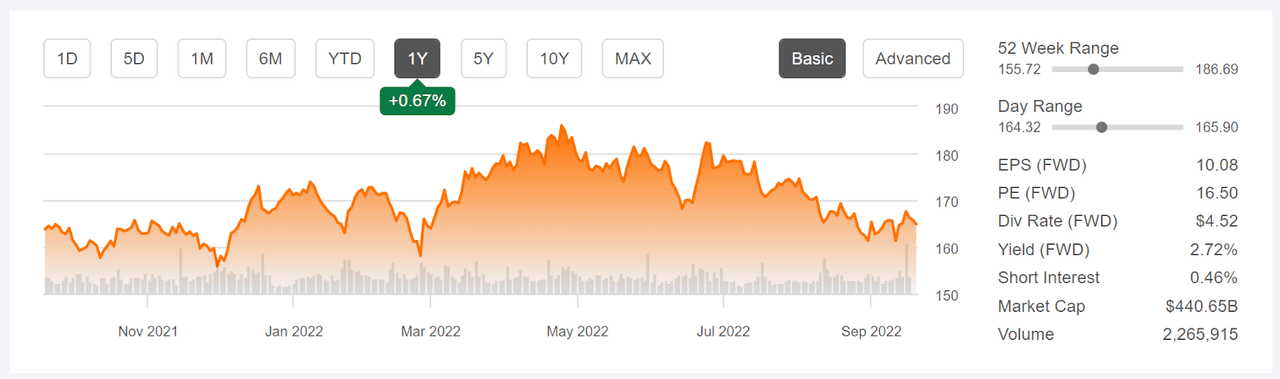
12-Month price history and basic statistics for JNJ
Particularly in the past couple of years, comparing a pharma stock to the average industry performance is not very meaningful. The pharma companies that developed successful COVID drugs have enjoyed a huge boost in sales, while other companies have not performed as well as expected because patients deferred medical treatments during the COVID lockdowns. JNJ, with its COVID vaccine, has been one of the companies that performed well through the pandemic. The company also has received a boost from positive developments in ongoing lawsuits against JNJ involving talc products. The mid-2021 settlement relating to the opioid epidemic also removed some uncertainty with regard to legal liabilities. The quarterly earnings show a modest growth trend over the past four years. The consensus outlook for EPS growth over the next three to five years is 3.8% per year.
ETrade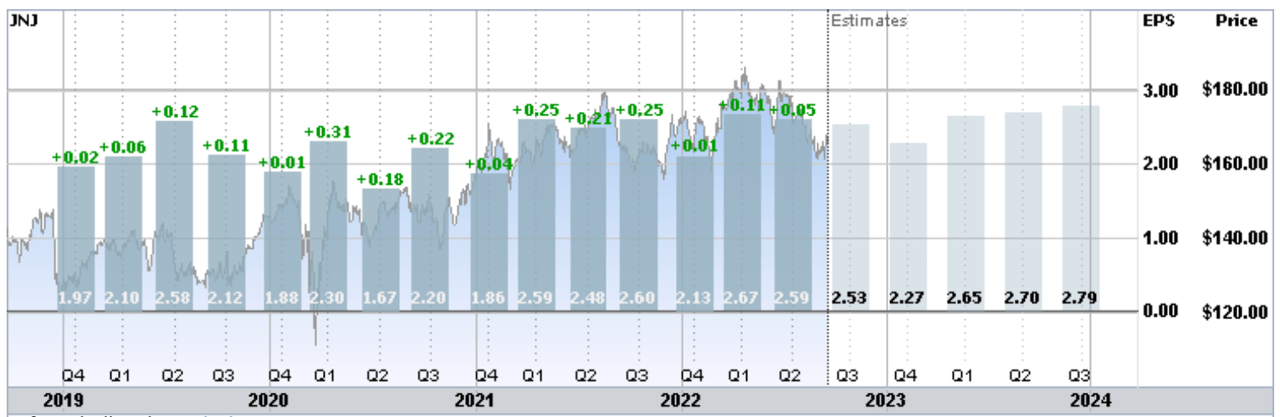
Historical (four years) and estimated future quarterly EPS for JNJ. Green values are amounts by which quarterly EPS beat the consensus expected value
President Biden recently stated that the COVID-19 pandemic is over, and, indeed, reported cases are low, with a downward trend. In JNJ’s Q2 earnings slide deck, presented on July 20, you have look fairly carefully to find references to JNJ’s COVID vaccine. This de-emphasis is intended to demonstrate the incredible breadth of JNJ’s portfolio of products and services and to assuage any potential concerns that the end of the pandemic will have a substantial impact on earnings.
JNJ’s forward P/E, 16.5, is higher than it was at the start of March (15.8). With the forward dividend yield of 2.72% and the trailing five-year dividend growth rate of 5.95%, the Gordon Growth Model indicates that an expected total return of about 8.7% is plausible. JNJ’s 59 consecutive years of dividend growth add some confidence in the reasonableness of the Gordon Growth Model estimate. For context, JNJ’s trailing 10- and 15-year annualized total returns are 11.3% and 8.2% per year, respectively.
I last wrote about JNJ on March 1, 2022, at which time I maintained a buy rating that I first assigned in a Seeking Alpha post on April 12, 2021. In my March post, I noted that JNJ looks relatively expensive in terms of forward P/E, as compared to Pfizer and Merck. JNJ’s TTM P/E also was quite high compared to historical levels. With the higher valuation, JNJ’s dividend yield of 2.55% was below Pfizer’s (3.35%) and Merck’s (3.62%). Comparing valuation metrics is of limited value for pharma companies because their pipelines are so distinct. To get a handle of estimates of future growth potential, I rely on two forms of consensus outlooks. The first is the well-known Wall Street analyst consensus rating and price target. The second is a probabilistic price forecast calculated from the prices of call and put options on the stock, the market-implied outlook. At the start of March, the Wall Street consensus rating was a buy and the consensus 12-month price target implied a total return (including the dividend) of 17% over the next year. The market-implied outlook was bullish to January of 2023, with expected volatility of about 21% (annualized). As a rule of thumb for a buy rating, I want to see an expected 12-month total return that’s at least half the expected volatility. Taking the Wall Street consensus price target at face value, JNJ comfortably exceeded this threshold. With the company’s solid trailing earnings and the bullish views from the Wall Street consensus and the market-implied outlook, maintaining the buy rating was the obvious decision. In (roughly) the 6 ⅔ months since March 1, 2022, JNJ has returned +1.8% vs. -10.2% for the S&P 500 (SPY).
For readers who are unfamiliar with the market-implied outlook, a brief explanation is needed. The price of an option on a stock is largely determined by the market’s consensus estimate of the probability that the stock price will rise above (call option) or fall below (put option) a specific level (the option strike price) between now and when the option expires. By analyzing the prices of call and put options at a range of strike prices, all with the same expiration date, it’s possible to calculate a probabilistic price forecast that reconciles the options prices. This is the market-implied outlook. For a deeper explanation and background, I recommend this monograph published by the CFA Institute.
I have calculated updated market-implied outlooks for JNJ and I have compared these with the current Wall Street consensus outlook in revisiting my rating.
Wall Street Consensus Outlook for JNJ
ETrade calculates the Wall Street consensus outlook for JNJ by combining the views of 10 ranked analysts who have published ratings and price targets within the past three months. The consensus rating is a buy, as it has been for all of the past year, and the consensus 12-month price target is +13.7% above the current share price. This expected price appreciation is slightly lower than the value of +15.2% at the start of March. The 12-month price target of $187.50 is very close to the value at the start of March, $188.20.
ETrade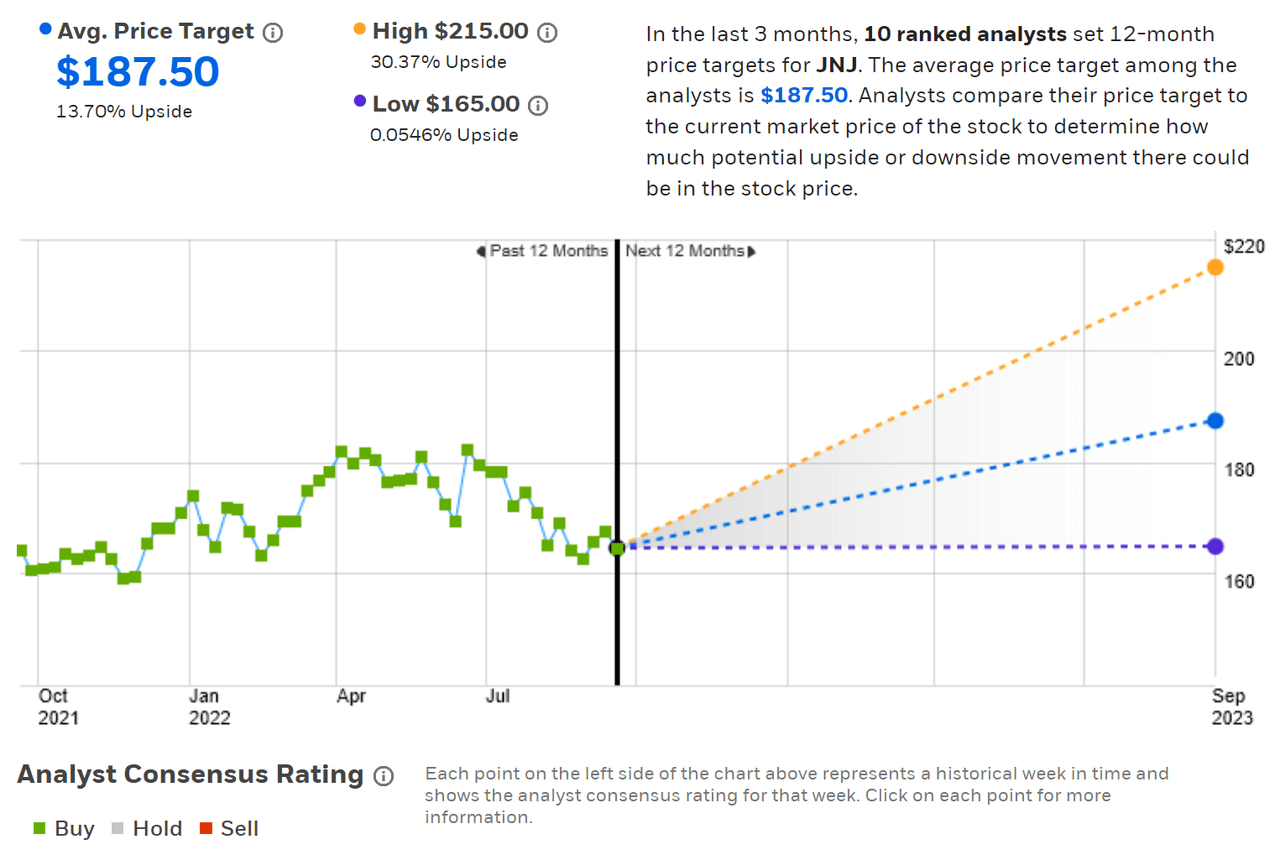
Wall Street analyst consensus rating and price target for JNJ
Seeking Alpha’s version of the Wall Street consensus outlook is calculated using ratings and price targets issued over the past 90 days by 20 analysts. The consensus rating is a buy and the consensus 12-month price target is 12.2% above the current share price. Note that the consensus rating on JNJ, as calculated by Seeking Alpha, has been a buy for all of the past three years.
Seeking Alpha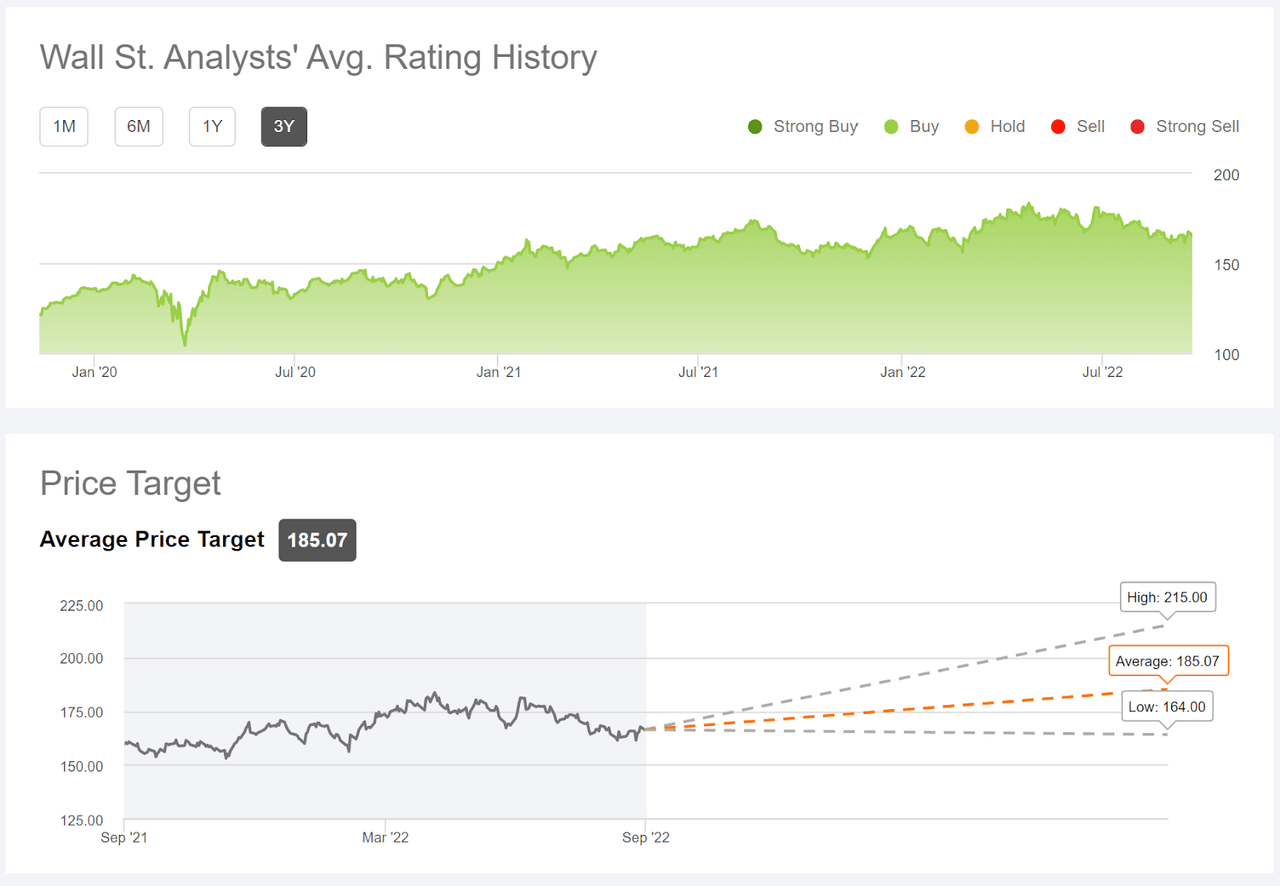
Wall Street analyst consensus rating and price target for JNJ
The Wall Street consensus outlook for JNJ continues to be a buy and the expected 12-month total return is 15.7% (averaging the ETrade and Seeking Alpha consensus price targets and adding the dividend yield). The expected return is slightly lower than at the start of March.
Market-Implied Outlook for JNJ
I have calculated the market-implied outlook for the four-month period from now until January 20, 2023, and for the 8.8-month period from now until June 16, 2023, using the prices of call and put options that expire on this date. I selected these two dates to provide a view to the start and middle of 2023, as well as because the options expiring in January and June tend to be among the most liquid.
The standard presentation of the market-implied outlook is a probability distribution of price return, with probability on the vertical axis and return on the horizontal.
Geoff Considine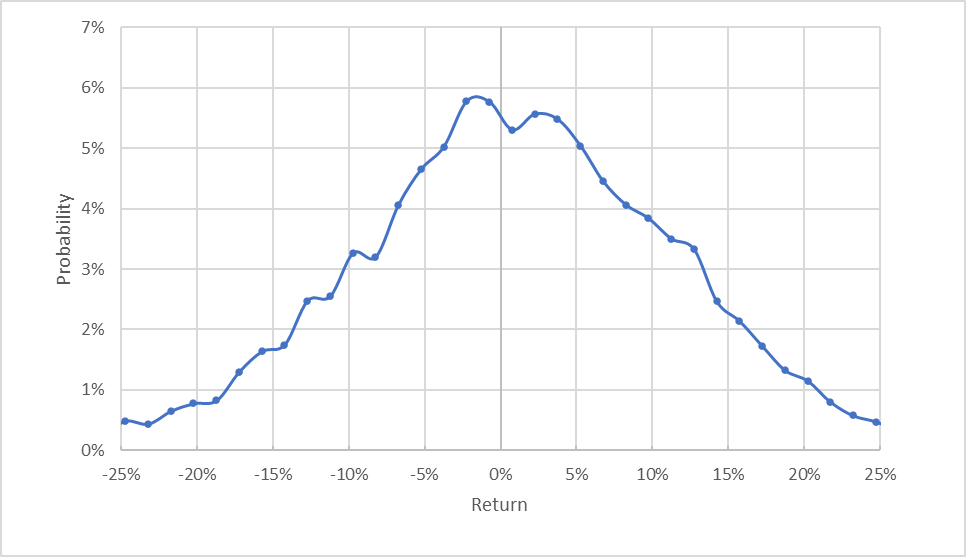
Market-implied price return probabilities for JNJ for the 4-month period from now until January 20, 2023
The market-implied outlook for the next four months, into January of 2023, is generally centered at zero, with broadly comparable probabilities of positive and negative returns. That said, the probabilities of positive returns are somewhat elevated vs. probabilities of negative returns of the same magnitude. Compare, for example, the probabilities of positive and negative 5% or 10% returns. The expected volatility calculated from this distribution is 21.1% (annualized), which is very low for an individual stock, but this is expected for JNJ. The expected volatility that I calculated at the start of March was very slightly higher (about 22%).
To make it easier to compare the relative probabilities of positive and negative returns, I rotate the negative return side of the distribution about the vertical axis (see chart below).
Geoff Considine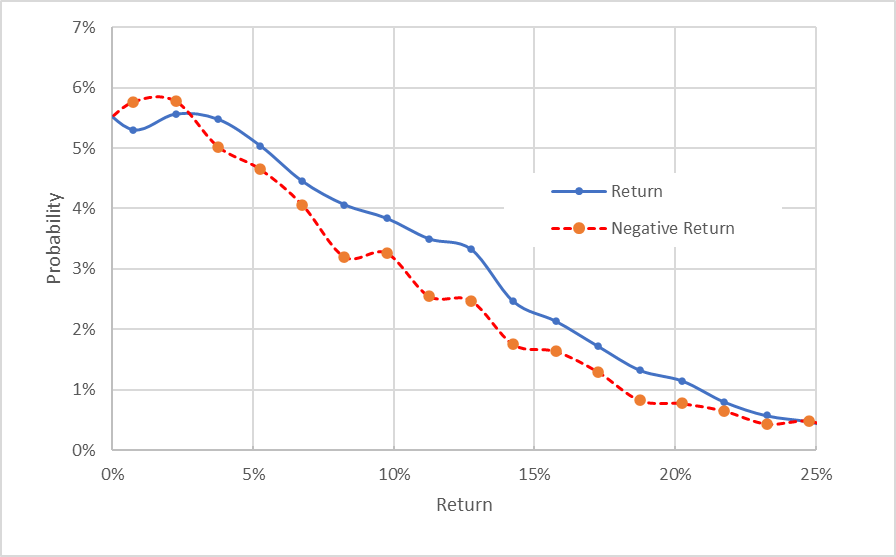
Market-implied price return probabilities for JNJ for the four-month period from now until January 20, 2023. The negative return side of the distribution has been rotated about the vertical axis
This view really shows the tilt in probabilities favoring positive returns over the next four months. The probabilities of positive returns are higher than for negative returns of the same magnitude across almost the entire range of possible outcomes (the solid blue line is above the dashed red line over most of the chart above). This is a bullish market-implied outlook for the next four months and is qualitatively similar to the 3.6-month outlook from my March 1 post.
Theory indicates that the market-implied outlook is expected to have a negative bias because investors, in aggregate, are risk averse and thus tend to pay more than fair value for downside protection. There’s no way to measure the magnitude of this bias, or whether it is even present, however. The expectation of a negative bias reinforces the bullish interpretation of this outlook.
The market-implied outlook for the 8.8-month period from now until June 16, 2023, is even more bullish than the short-term outlook, with a larger spread between probabilities of positive and negative returns. This is more bullish than the 10.7-month outlook from my March 1 post. The expected volatility calculated from this distribution is 22.0%.
Geoff Considine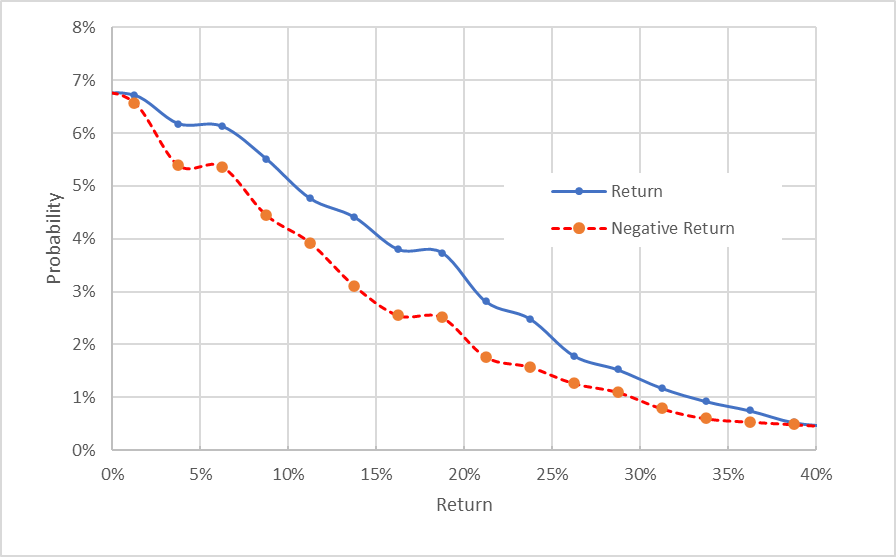
Market-implied price return probabilities for JNJ for the 8.8-month period from now until June 16, 2023. The negative return side of the distribution has been rotated about the vertical axis
The market-implied outlooks to mid-January and to mid-June of 2023 are telling a consistent story and indicate an increasingly bullish view over time. The expected volatility is consistent between the two periods.
Summary
Through the rise and fall of COVID cases, along with uncertainty related to the talc opioid lawsuits, JNJ has delivered slow-but-steady earnings growth. The outlook is for more of the same, and this helps to explain why JNJ’s historical and expected future volatility is so low. JNJ’s portfolio of products is highly diversified, which helps to smooth earnings. The Wall Street analyst consensus rating on JNJ has been bullish for years and continues to be bullish. The consensus 12-month price target implies an expected total return of 15.7%, which is well above the 3-, 5-, 10-, and 15-year annualized returns. This expected total return is well above ½ the expected annualized volatility (22% from the market-implied outlook), which suggests an attractive expected risk-return tradeoff. Even with a significant reduction to be more in line with the Gordon Growth Model estimate for expected return, JNJ can still provide a reasonable risk-return balance. The market-implied outlook for JNJ is bullish to early- and mid-2023, and even looks somewhat more bullish than back at the start of March. Even with the muted earnings growth outlook, the outlook for JNJ is favorable. I’m maintaining a buy rating.
Be the first to comment