

Rafael_Wiedenmeier/iStock Unreleased via Getty Images
Office REITs are beaten down by the Work From Home (WFH) trend, which is here to stay. Might as well call it the WFH Era. So far in 2022, Office REITs are the third-worst performing REIT sector, with a total return of (-36.01)%, compared to the Equity REIT Index return of (-28.50)%. Although REITs in general have outperformed the NASDAQ, they have badly underperformed the Dow and the S&P 500, as the graphic below shows.
Hoya Capital Income Builder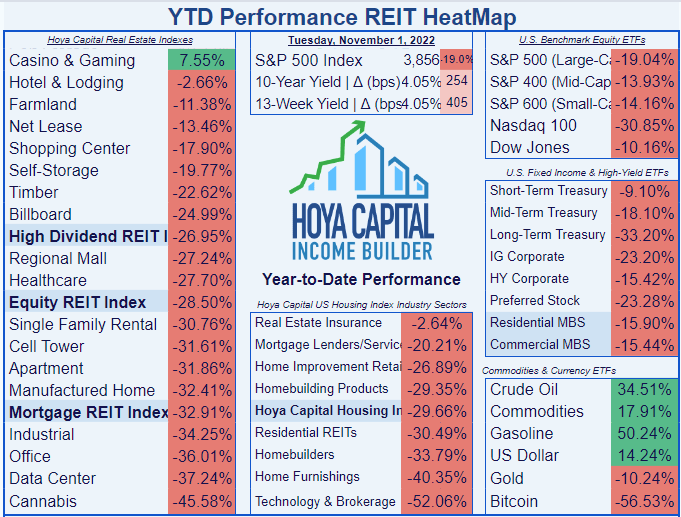
At some point, the WFH trend is priced in by the market. Has that time arrived? It may be time to take a look at Office REITs, as there are some significant bargains lying around.
Today’s article focuses on an intriguing small-cap REIT.
Meet the company
Orion Office REIT
Headquartered in Phoenix, Arizona, Orion Office REIT was formed last year, when Realty Income merged with VEREIT, becoming the repository for the office properties of both companies.
Orion owns just over 10.5 million rsf (rentable square feet), currently only 86.7% occupied, with a weighted average remaining lease term of just 4.1 years, and ABR (annual base rent) slightly under $170 million.
Company investor presentation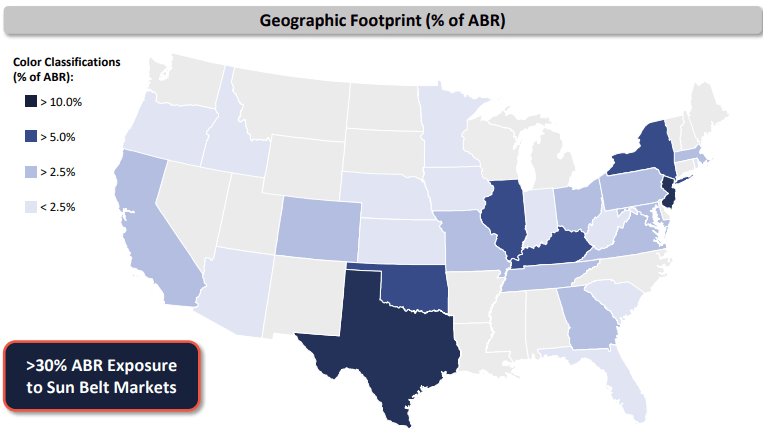
Although the company has a significant Sunbelt presence, it is not Sunbelt focused. Texas leads the way with 14% of ABR, but New Jersey (11%), New York (8%), and Illinois (7%) are next in line.
Company investor presentation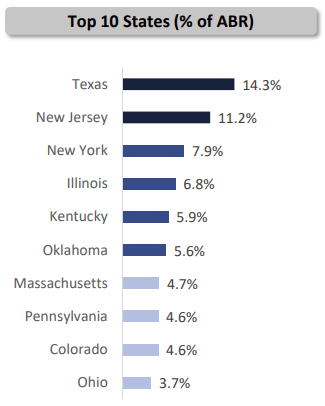
Orion Office (NYSE:ONL) focuses on:
- Mission-critical headquarters locations,
- Primarily single-tenant net lease properties, with
- Mostly investment-grade tenants (67%),
- In suburban markets experiencing economic and population growth,
- With easy access to commuter routes and public transportation.
The management team is composed mostly of former VEREIT executives, and seeks to create value through
- Asset management,
- Capital recycling, and
- Modest external growth
…in that order.
The tenant base is not very well diversified, as the General Services Administration accounts for 12% of ABR, and Merrill financial services another 7%. The top 10 tenants account for almost half (49%) of ABR.
Company investor presentation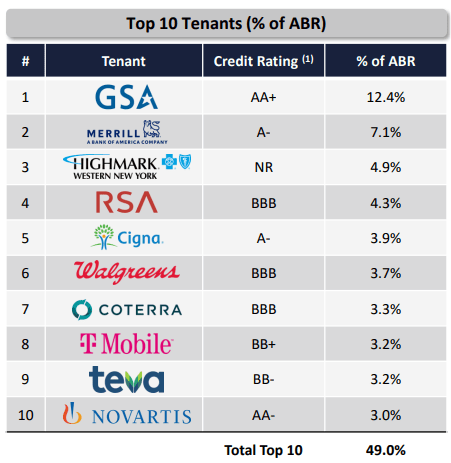
The tenants are well diversified by industry, however, and the industries tend to be fairly recession-resistant. Health care and government agencies account for 25% of ABR, with insurance and financial services another 19%.
Company investor presentation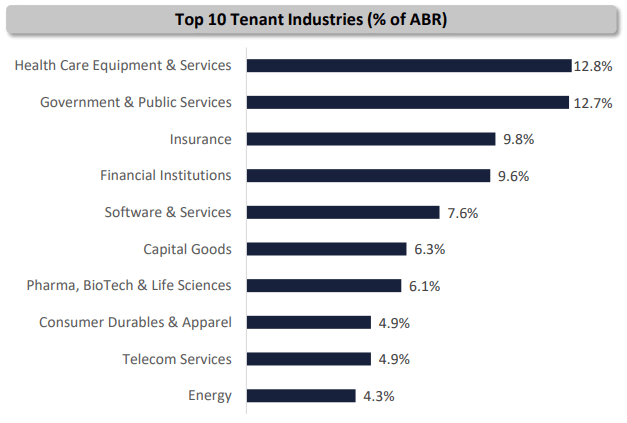
The lease expiration schedule is daunting. In 2023, leases accounting for 18.4% of ABR expire, and in 2024, another 23.4%.
Orion’s earnings over the next two years will be mostly a function of their ability to re-let the properties where the leases are expiring. The company is counting on management’s extensive customer relationships and proactive property management to get this done. We shall see. This will be a good test of ONL’s business model, and even if they are successful in renewing or finding new tenants, there is a substantial possibility that FFO will drop off somewhat, no later than 2024. Leasing activity will be the crucial thing to watch when the company reports earnings over the next 10 quarters.
Company investor presentation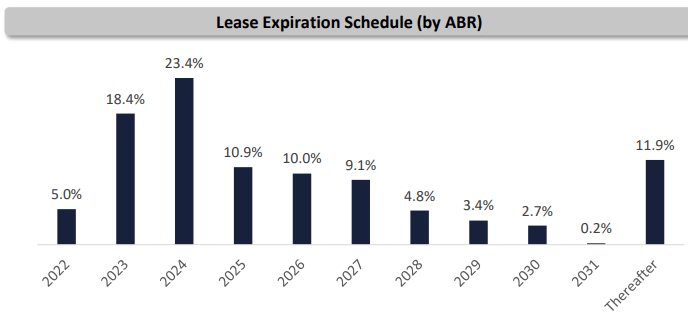
As CEO Paul McDowell puts it:
following our spin off from Realty Income, we inherited a portfolio that needed some intensive asset management and repositioning to address significant lease maturities and vacancies.
Last November, management did manage to sign an early lease extension for 11 years with Merrill Lynch in New Jersey, and through H1 2022, has signed 385,000 square feet of lease extensions.
On the capital recycling front, ONL has closed on two sales, totaling 210,000 rsf and proceeds of $9.2 million, and has agreements in place to sell 6 more properties, totaling 338,000 rsf for proceeds of $18.9 million. That accounts for about 5% of their total portfolio, and the proceeds will be targeted to assets that better fit their criteria. This portfolio repositioning is also key to ONL’s prospects going forward.
As McDowell says,
. . . this will take time and put continued pressure on our earnings performance over the coming quarters and years
As for their modest external growth goals, again they are counting on the management team’s extensive relationships to find or create off-market opportunities, including sale-leasebacks and build-to-suits.
Again, CEO McDowell, speaking on the Q2 earnings call, said,
given the macroeconomic environment, our current valuation and our capital allocation needs, we will remain highly disciplined and strategic when it comes to adding new properties to our core portfolio.
He did not provide guidance as to how much the company intends to invest in acquisitions. The leasing effort will require a considerable amount of capex ($5 to $10 per square foot, according to McDowell), to add value to the existing portfolio, in order to keep the properties leased out.
Growth metrics
Here are the growth figures so far, for FFO (funds from operations) and TCFO (total cash from operations).
| Metric | 2021 | 2022* | CAGR |
| FFO (millions) | $46.7 | $105.9 | — |
| FFO Growth % | — | 126.8 | 126.8% |
| FFO per share | $1.75 | $1.70 | — |
| FFO per share growth % | — | (-2.9) | (-2.9)% |
| TCFO (millions) | $56.1 | $103.6 | — |
| TCFO Growth % | — | 84.7 | 84.7% |
Source: TD Ameritrade, CompaniesMarketCap.com, and author calculations *Projected, based on H1 2022 results
Both FFO and TCFO are expected to approximately double this year, compared to last, yet per share FFO growth is expected to decrease slightly. The company was only in operation two months last year, so the growth figures should be taken with a very large grain of salt. The company has operated at a loss of almost $20 million through H1 this year.
Meanwhile, here is how the stock price has done over the past twelve months, compared to the REIT average as represented by the Vanguard Real Estate ETF (VNQ).
| Metric | 2021 | 2022 | 3-yr CAGR |
| ONL share price Nov. 1 | $25.00 | $9.36 | — |
| ONL share price Gain % | — | (-62.6) | (-62.6)% |
| VNQ share price Nov. 1 | $109.58 | $82.95 | — |
| VNQ share price Gain % | — | (-24.3) | (-24.3)% |
Source: MarketWatch.com and author calculations
ONL investors have had an exceptionally rough ride thus far, losing a whopping (-62.6)% on share prices, compared to the VNQ’s also disappointing loss of (-24.3)%.
Market cap is around $530 million, barely enough to qualify as a small-cap.
Balance sheet metrics
The balance sheet is the strength of the company thus far. The Liquidity Ratio is an impressive 2.60, well above both the REIT average and the Office REIT sector average. Orion’s debt ratio is a little worse than other Office REITs, and a lot worse than the overall REIT average, but Debt/EBITDA is solid at 6.5. ONL’s balance sheet is not bond rated.
| Company | Liquidity Ratio | Debt Ratio | Debt/EBITDA | Bond Rating |
| ONL | 2.60 | 44% | 6.5 | — |
| Office REIT avg | 1.77 | 41% | 7.4 | — |
| Overall REIT avg | 1.90 | 25% | 6.2 | — |
Source: Hoya Capital Income Builder, TD Ameritrade, and author calculations
Orion ended Q2 with $628 million in debt (84% of which is fixed-rate), over against $374 million in liquidity (including $20 million in cash and $354 in available credit). More than 25% of that debt comes due next year, after which maturities fall off sharply.
Company investor presentation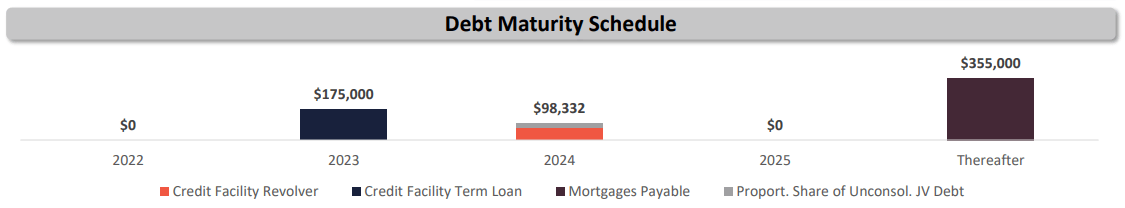
According to the company’s latest 10-Q, the fixed-rate debt of $355 million is carried at a steep 4.97% weighted-average interest rate, with an average 4.6 years to maturity.
Dividend metrics
Although slightly above the REIT average, ONL’s current Yield of 4.27% is disappointing for an Office REIT.
| Company | Div. Yield | 3-yr Div. Growth | Div. Score | Payout | Div. Safety |
| ONL | 4.27% | 0.0% | 4.27% | 20% | NR |
| Office REITs | 6.31% | 3.2% | 6.94% | 52% | C |
| REITs overall | 3.93% | 6.2% | 4.71% | 59% | C |
Source: Hoya Capital Income Builder, TD Ameritrade, Seeking Alpha Premium
Dividend Score projects the Yield three years from now, on shares bought today, assuming the Dividend Growth rate remains unchanged. With just one year of history, ONL has not yet raised or lowered its dividend, so the company’s Dividend Score comes in below average at 4.27%.
Seeking Alpha Premium has not yet assigned a dividend safety rating to ONL, but the 20% payout ratio is exceptionally low.
Valuation metrics
ONL trades at a dirt cheap 5.5x FFO ’22, and a (-28.0)% discount to NAV. This is supposed to mean it is a bargain, from a value investor’s standpoint.
| Company | Div. Score | Price/FFO ’22 | Premium to NAV |
| ONL | 4.27% | 5.5 | (-28.0)% |
| Office REIT average | 6.94% | 10.0 | (-23.0)% |
| Overall REIT average | 4.71% | 16.5 | (-15.0)% |
Source: Hoya Capital Income Builder, TD Ameritrade, and author calculations
However, cheap REITs usually stay cheap, and ONL is cheap for a reason. Since the company’s cash flow looks healthy, it will be very interesting to see if they raise their very cautious payout ratio.
Which way is the wind blowing, and what could go wrong?
The WFH era has begun, and will remain more or less a permanent headwind for all Office REITs, but ONL has some tailwinds in their favor as well.
During the pandemic, there was a significant population shift out of big cities into smaller ones and suburbs. This resulted in 91% of suburban counties enjoying net move-ins, while 82% of urban centers experienced net move-outs.
Company investor presentation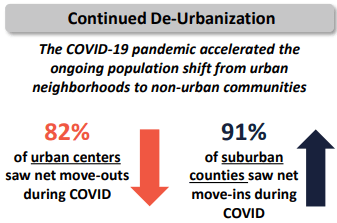
As has been well-documented, this migration has swelled Sunbelt populations to a much greater extent than the rest of the country.
Company investor presentation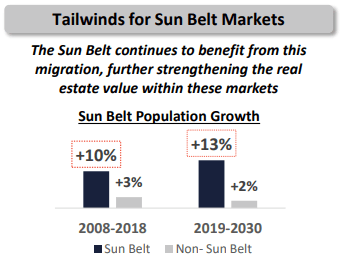
There have been some notable large corporations committing to offices in suburban and secondary markets, as shown in the graphic below.
Company investor presentation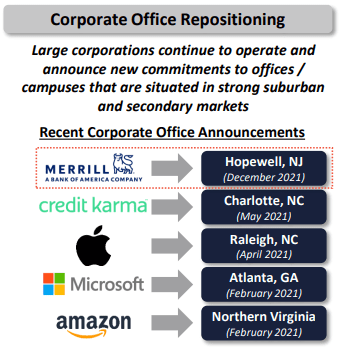
These suburban and secondary markets are characterized by
- Strong population growth,
- S highly educated workforce,
- Office-using employment growth,
- Limited new office supply,
- Success to mass transit,
- Adequate supply of affordable housing,
- Good public schools, and
- Relatively business-friendly tax and regulatory environments.
All that said, the company’s biggest risk going forward is the short remaining lease terms and the extraordinary amount of leases expiring over the next two years. ONL management’s ability to renew or re-lease those properties, and unload non-core and underperforming assets, will be crucial.
Investor’s bottom line
Orion Office is composed of all the office properties that neither Realty Income nor VEREIT wanted. There is a reason for that. Under the best scenario, management does an amazing job of re-letting all the properties where the leases are expiring over the next two years. If they do that, ONL emerges as a reasonable investment, going forward from that point. But that is by far the most optimistic scenario. There are less rosy (and probably more realistic) possibilities, in which this company struggles for several years to come.
Right now, ONL does not pay a strong enough dividend to make the risk worthwhile. Yields are very high in the Office sector, and given the muted growth prospects, you should probably insist on a high Yield, if you are going to put your hard-earned money in. There are several much better investments opportunities in the Office REIT sector, and Hoya Capital Income Builder makes them easy to spot.
As for Buy, Sell, or Hold, that depends on your investing horizon. In the short run, this REIT is so beaten down, with the jury still out, and the dividend so likely to be increased, that it will be a reasonable Hold for the next 6 months or so. I expect 2023 to be a great year for REITs, but doubt that ONL will outperform the average REIT.
Over a two-year horizon, however, I would characterize this REIT as a Sell, simply because there are better alternatives. In the 2 – 5 year window, it is too difficult to predict this company’s fate. Since I can only give one rating, I’m going to assign this company a Sell.
Seeking Alpha Premium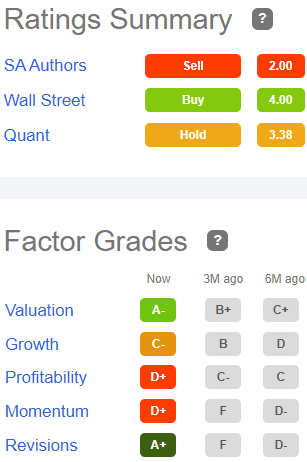
That puts me in good company with other authors on Seeking Alpha, but out of step with one of the Wall Street analysts, who rates ONL a Strong Buy. The average price target for the two analysts that cover this firm is $19, which implies 105% upside.
TipRanks is Neutral on ONL, and Ford Equity Research rates it a Hold. However, as always, the opinion that matters most is yours.
Be the first to comment