

sqback/iStock via Getty Images
Introduction:
Value investing is inherently contrarian. A value investor, such as myself, is buying a security because we believe we are effectively purchasing something which is less than its true value, and given time the market will eventually reflect its fair value. That in-itself though doesn’t make it a true contrarian investment. Highly cyclical stocks will often trade very cheaply on certain metrics when the company is in its down cycle. The market tends to discount future results by 6-12 months depending upon the type of business. Thus, a highly cyclical stock in a down cycle where it might not make much if any profit, tends to get arguably oversold relative to its full cycle fair value. Therefore, a value investor will often make a purchase knowing that the longer term fair value of the stock is more than the current price. Again though, that is not really an example of a contrarian view, and while this recommendation is both cheap on near and longer term fair value outlooks, the reason I would argue it’s a contrarian investment is more contextualized.
THO Investor Presentation 6-26-22
THOR Industries (NYSE:THO) is the largest Recreational Vehicle company in the market and dominates the towable segment. It was formed in 1980, and largely through acquisitions, has become the conglomerate of the industry. This is a company that I’ve been involved with for a couple of decades now, and one that I’ve always respected in terms of its long-term ability to compound growth. If you’ve read any of my articles in previous years, then you might have seen me talk about a financial measure I created by adjusting a company’s equity for cashflow changes. THO has a very nice record over the last 15 years in terms of total compounding rates of adjusted book value growth, and the consistency with which it grows is excellent for a stock considered cyclical. Not to mention it throws of significant amounts of free cash flow.
SEC Edgar Company Filings
The yellow highlighted section shows the 5-, 10-, and 15-year compounding rates of growth for THO. Notice also that the year over year rates are consistently positive, excluding the ’08-’09 period, with normally small gains or losses in the bottom of their down cycle. Bottom line is you don’t usually see this degree of growth through the cycles trading for the valuation that THO historically goes for. The last time I traded the stock I sold some back in July of 2020 when it was north of $100, but I’ve been holding the balance since because I think it might already be discounting the worst of the cycle decline.
Thesis: Cycle Decline For RV Shipments
This is where the context I spoke about comes into play. The 30,000 foot view for this stock, and all RV companies, is simply how many units are shipping in the future. If we apply this simple concept to THO’s stock, we can see how much correlation there is between the industry wholesale shipments and the stock price.
Historical Shipment Data RVIA.org Fidelity Trader Pro

The above chart is the industry shipment data from RVIA, and below it is a log chart of THO’s stock price with the month end dates near those shipment cycle lows. It’s not perfect as the 2020 market low during the pandemic shows, but for the most part if you wanted to know when you should be long or short, you can pretty much just follow the growth path of the industry shipments. This is where the contrarian play arrives.
I would hope that if you are considering investing in an RV industry stock long or short, that by now you know that shipments have just started to go down to the tune of (36%) year over year in the last monthly report.
Monthly RV Shipments 2022 2021
I hope that you also know that the pandemic helped to create, or pull forward, significant demand so that the industry experienced a stronger growth cycle than historical experience. This leads to an obvious down cycle, or dare I say short thesis, for the industry stocks. With what I displayed before concerning the correlation between the stock price and industry shipments, and now that year over year shipments have just started a precipitous decline, then logic would dictate you should stay away from THO probably for at least another 6-9 months until the stock can start to look past the depth of the shipment through.
Yet here I am still holding THO stock and making the case that it might already be discounting the full down cycle for the industry. Below is the RVIA annual shipment data. I’ve included the year over year rate of change, as well as the Peak-To-Trough annual declines in shipments for each down cycle highlighted in grey. The primary point I would like to highlight here, is that outside of the ’08-’09 financial crisis, most of the down cycles experience declines in the (20%) range. We are now seeing declines in the mid-(30%) range. I.e., we’re already seeing a larger decline in shipment rate as one would expect from the pandemic lockdown bump to sales.
RVIA Shipment Data yoy & cycles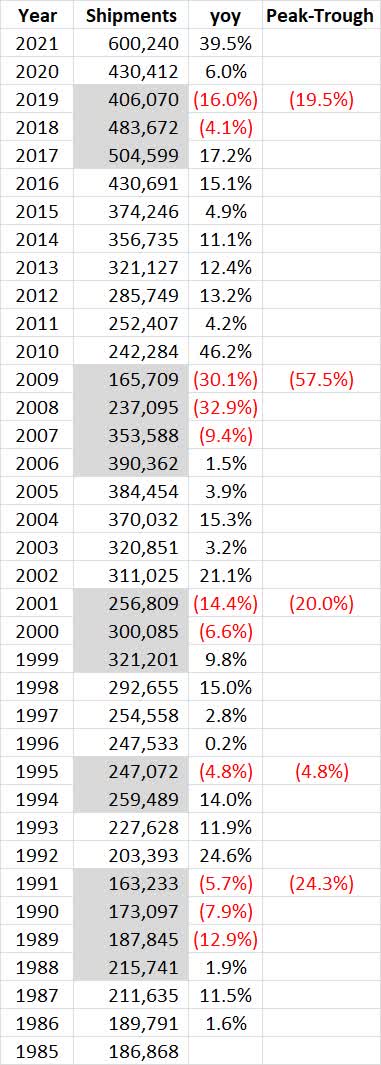
Valuation:
Valuation is absolutely a difficult tool when used for timing market moves, but it is an excellent one for judging risk/reward and long-term return potential. The market values the RV industry as a consumer cyclical business, and as we’ve seen it does have a natural peak and trough cycle to shipments. When looking at cyclical companies, the choice in valuation metrics we use are very important. Essentially, cyclical stocks will always look cheap at the top and expensive at the bottom if one is primarily using an income or cashflow based metric like price-to-earnings or free cashflow etc…. Thus, I will always encourage looking at an asset-based metric like price-to-book value [P/BV] for cyclical business.
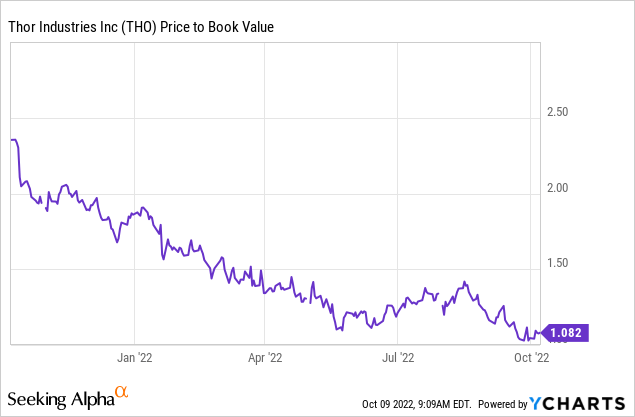
THO’s stock is currently trading just above 1x P/BV. I often argue for using tangible book value to exclude intangibles like goodwill. However, in this case the company’s strategy for the last four decades has been to roll-up the industry through acquisitions. Hence, I think in a case like this including the intangibles is important. If the company doesn’t do a good job in the price it pays for the acquisitions, then usually it will have to write down the value of goodwill during the down cycles which will impact both their book value compounding growth rate and valuation.
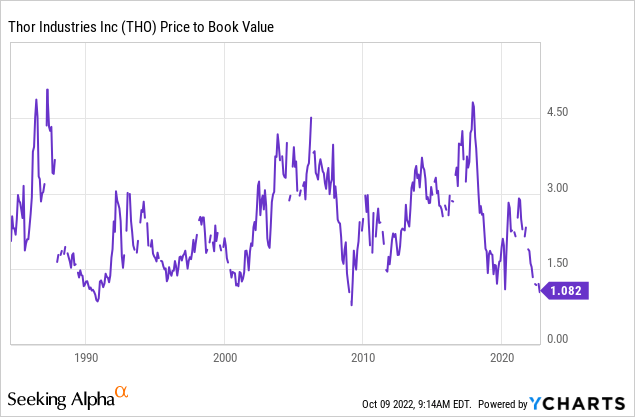
The long-term historical valuation range for THO’s P/BV suggests there is limited downside risk from here without a write-down to book value. The cycle low in ’08-’09 was about 0.80x book, and the one in late 2000 was about 1.15x book. Therefore, we might already be in the range of resistance for the stock to decline further without another crisis comparable to the ’08-’09 period.
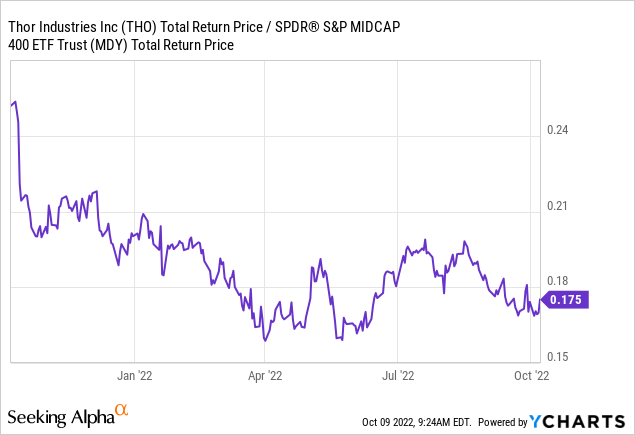
The above chart is a ratio depicting the relative performance of THO’s total return versus its Mid-Cap peer group (MDY). It has made a higher low currently than the period in April and June, which might be an indication that the valuation floor is having its supportive effect.
Technical Analysis:
Long-term log charts are great for showing how a stock and company has performed over time. In fact, if it is a steady growing company, then you should be able to see it form a channel with a very obvious up trend. Below is the entire history of THO’s stock trading where I have added two lines to link historical peaks and troughs. The pervious time I purchased this stock was during the last down cycle in June of 2019 when prices were in the mid-50’s. The fact that the stock was touching the bottom of the historical uptrend line was part of my thesis then too. Note also that on this upcycle in 2021, despite the boost from the pandemic, the stock didn’t get close to flirting with its uptrend line. The market was quick to discount the up cycle and never pushed it to its historical higher range. I think we could be seeing the reverse of that characteristic now.
Fidelity Active Trader Pro
Market Positioning:
Earlier I basically presented the simple case for why one would expect THO’s stock to keep declining. The cycle is turning down, it was an abnormal up cycle boosted from the pandemic, and the stock tends to bottom when industry shipments do. Hence, it’s going down and don’t buy it until shipment data stops declining. I used to work in long/short funds, so I get the thesis and you don’t really need to go much deeper than that. The stock will follow the fundamentals of its business eventually.
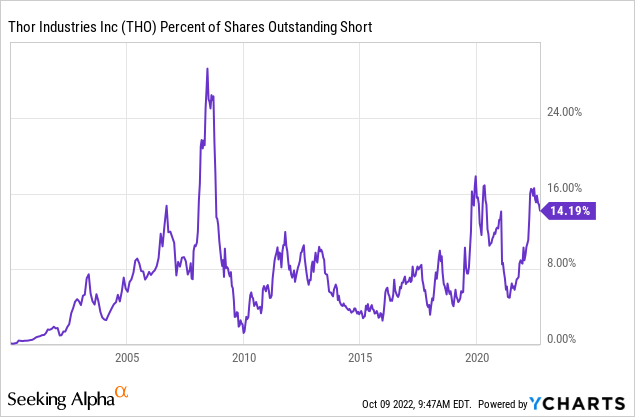
There is a risk though when a stock gets crowded on the short side. Historically, we can see that the short interest as a percentage of the shares outstanding is similar to its last cycle peak with only the financial crisis surpassing. I mentioned that I bought this stock in June of 2019. Let’s take a closer look at how it performed and how the short interest evolved then.
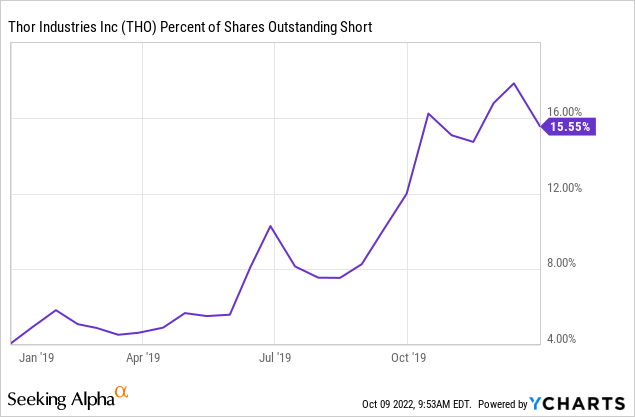
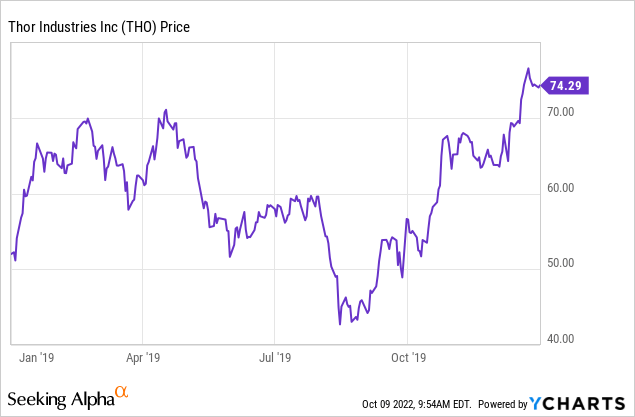
I bought this in June 2019 and I did suffer a decline into the end of August then. The interesting thing is how the short interest built up late in the year as the stock actually rallied. At least in this case, the short interest mostly came in after the stock had already bottomed. You could say they got lucky though with the March of 2020 market melt-down providing an escape from the position. It took some time before the market tuned into the stocks that would benefit from the lockdown.
Overall this might be the most contrarian point of owning this stock right now. There’s a definitive market bet being made for the stock to decline. The fact that the size of the bet is already commensurate to the levels we saw the last cycle though, I view as another potential positive element to support the stock on an absolute and relative basis.
Risk:
There’s always a risk I’m wrong in making this case. The stock might languish or decline with the continuing contraction in industry shipments. The parts of the thesis I’m worried about moving forward is the following: Mortgage Rates. You’ll see a lot of discussion around fuel prices and how it affects RV sales. It’s perfectly rational when you consider the amount of energy required to move these large vehicles. However, it’s not the biggest economic impact to RV sales as a single factor. That honor belongs to mortgage rates. Remember that these vehicles are called Motor-Homes for a reason, and the ‘Home’ aspect of them also means that financing is a significant factor to the purchase equation.
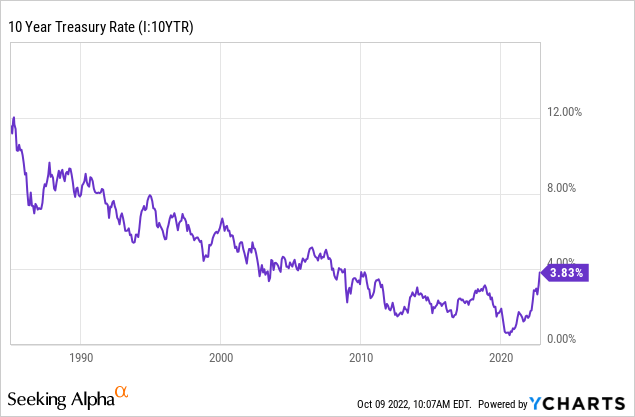
Note how the peaks in the 10 Year Treasury Rate (TNX) line up with the troughs of the RV cycle: 2019, 2006, 2000, 1995, 1990. If you were looking at the industry cycle data from before and wondering what that little (5%) decline in 1995 was about, well now you know it was about mortgage rates. If I’m wrong and the stock has another material leg down from here, I suspect it will likely be due to interest rates moving materially higher from this point exacerbating the down cycle further.
Conclusion:
THO has been a strong growth, all be it cyclical, company for decades now, and thanks to its cyclicality it tends to trade at less than fair value in my opinion when the cycles turn down. Between valuation and technical analysis, there’s a good case to be made that the stock is already discounting the larger than normal decline in shipments the industry will see due to the bump up in demand during the lockdown phase of the pandemic. The fact that short interest has already made a sizable bet on further declines comparable to the previous cycle, could lend more support to the stock on both an absolute and relative basis. In fact, relatively we may already be seeing signs that the stock is beginning to resist further declines due to all of these factors. The primary risk I’m watching is a further acceleration in interest rates that may create too strong of a headwind for future shipments. Technically I have no call to bet on declining rates currently, but in this case it’s more about the long-end of the curve remaining in this range. If the 10- and 30-year treasury rates were to move meaningfully above 4% with commensurate response in mortgage rates, then I would reconsider my thesis. Good luck out there to everyone.
Editor’s Note: This article was submitted as part of Seeking Alpha’s best contrarian investment competition which runs through October 10. With cash prizes and a chance to chat with the CEO, this competition – open to all contributors – is not one you want to miss. Click here to find out more and submit your article today!
Be the first to comment