


blackphobos/iStock via Getty Images
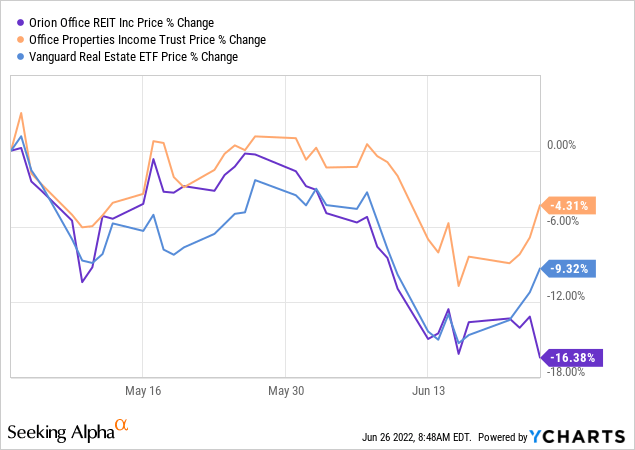
When we last covered Orion Office REIT Inc. (NYSE:ONL) we compared it against Office Properties Income Trust (OPI). Our rationale was that both these were single tenant, triple net, office REITs and OPI’s longer history would convince ONL investors of the rough times ahead. We concluded with a “meh” for OPI and a Sell for Orion.
All things considered, we believe OPI should trade at 5X FFO and Orion, thanks to its far shorter leases, and shorter weighted average debt maturity, should actually trade at 4X-5X FFO. That leads us to a hold rating on OPI and a Sell rating on Orion. The “Sell” may sound rough, but it is an upgrade from the “Strong Sell” we gave it the first time around.
Source: Why Both Deserve Low Multiples
Our logic worked out and OPI certainly outperformed Orion by a large margin over the last 2 months.
Is It The Turn?
Stocks look horrible just before things turn. Capitulation selling is not pleasant, and the nausea can force selling from even the steadiest hands. ONL has certainly been a painful hold for investors, and the stock has delivered one of the worst performances among REITs we cover. But turns require fundamentals to reverse as well. Let’s look at where that stands.
Q1-2022
Our concern with Orion was always that the single tenant properties with short term leases were a liability rather than an asset. Investment grade tenants don’t help make this situation better. Those tenants have a lot of brokers wooing them in this office market. While tenants can go almost anywhere, Orion’s single-tenant building can only attract very specific tenants to replace the one who wants to leave. We saw this problem play out further. In Q4-2021, occupancy was 91.9%.
As of December 31, 2021, the Company had a real estate portfolio comprised of 92 properties, and a 20% ownership interest in a joint venture comprising six properties. The Company’s portfolio occupancy rate was 91.9%, approximately 67.7% of the Company’s annualized base rent as of December 31, 2021 was from tenants with an investment grade credit rating, and the weighted average remaining lease term was 4.1 years.
Source: Orion Q4-2021 Results
This dropped by the time the March results were out.
The Company has 92 office properties with an aggregate of 10.5 million leasable square feet located in 29 states and Puerto Rico, with an occupancy rate of 88.1% and a weighted-average remaining lease term of 4.0 years as of March 31, 2022.
Source: Orion Q1-2022 Results
About half of the portfolio is coming up for renewal in the next 30 months, in what we consider to be very challenging market conditions.
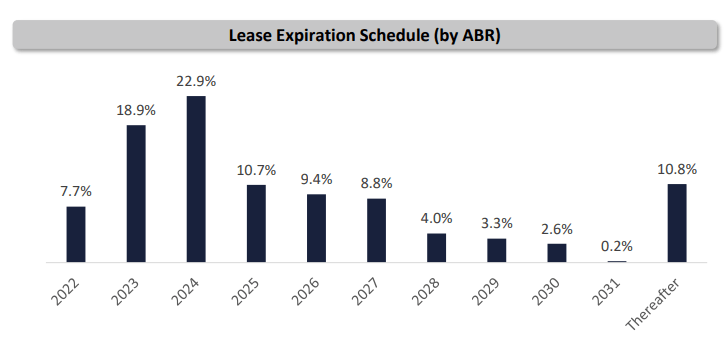
Orion Lease Expirations (Orion May Presentation )
The balance sheet, appears strong, but really is not. Orion suggests that 5.5X to 6.5X is a conservative leverage profile.
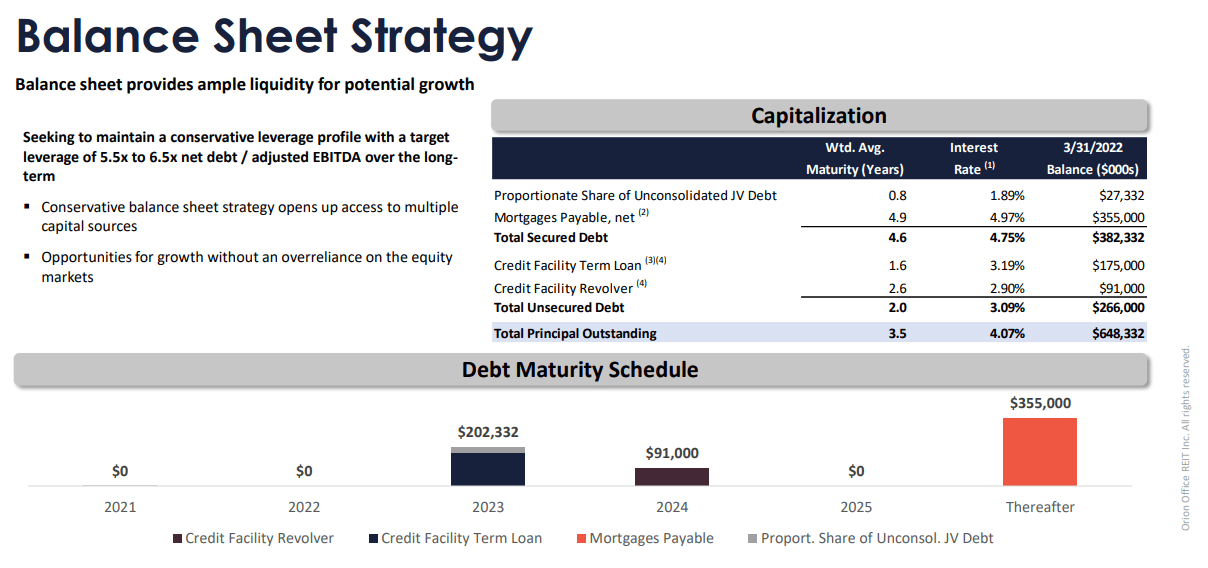
Orion May Presentation
We think that 6.5X is at least 3 turns ahead of what we consider as prudent, especially with a weighted average debt maturity of 3.5 years.
Value Or Value Trap
We get that the funds from operation (FFO) multiple is low (6.66X at midpoint).
We believe our first quarter performance keeps us on track with the full year 2022 guidance we provided with an estimated core FFO range of $1.66 to $1.74 per share. Based on our initial results in April second quarter 2022 is also tracking well.
Source: Orion Q1-2022 Transcript
But there were scary numbers presented alongside that. We would focus on the net debt to EBITDA guidance.
Our net debt-to-adjusted EBITDA was 4.51x at quarter-end. And we expect to remain within the estimated range of 4.7x to 5.5x as of December 31, 2022 that we guided to on the last call.
Source: Orion Q1-2022 Transcript
The scary part here is that at a base level there is a huge amount of FFO being generated. This works out to about $95 million based on the shares outstanding. Orion is paying out a very small fraction of this based on the current dividend policy. So all other things being equal, the net debt to EBITDA should drop as the year progresses. If we assume EBITDA holds constant going into 2023, then net debt to EBITDA should glide down from 4.51X to 4.20X as FFO after dividends reduces net debt. The guidance (as high as 5.5X) goes to show just how much pressure management expects from reducing EBITDA and possibly capital expenditures. This is the crux of the problem that the low multiple is hiding.
Verdict
The FFO appears large, but as we saw above, it likely won’t be enough to even keep debt to EBITDA constant. The dividend policy is very appropriate considering the risks. Of course, Orion may be forced to pay out a one time additional amount based on REIT rules and taxable income. We have very little insight into where that falls, so we cannot say there is no chance of a higher payment. But all things considered, don’t expect a materially higher payment. The stock only appears cheap, mainly due to price anchoring and investors eyeballing a 52-week high in the low $30s.
For worse or for better, we are going to give it to you in capital letters. Single tenant office properties are the worst asset class among REITs in this environment. If a tenant requires even 10% less space for hybrid work, they can abandon the building and look for other solutions. We don’t like the stock here and are maintaining our Sell rating with a $8.5 price target (5X FFO).
Please note that this is not financial advice. It may seem like it, sound like it, but surprisingly, it is not. Investors are expected to do their own due diligence and consult with a professional who knows their objectives and constraints.
Be the first to comment