

kaedeezign/iStock via Getty Images
A guest post by D Coyne
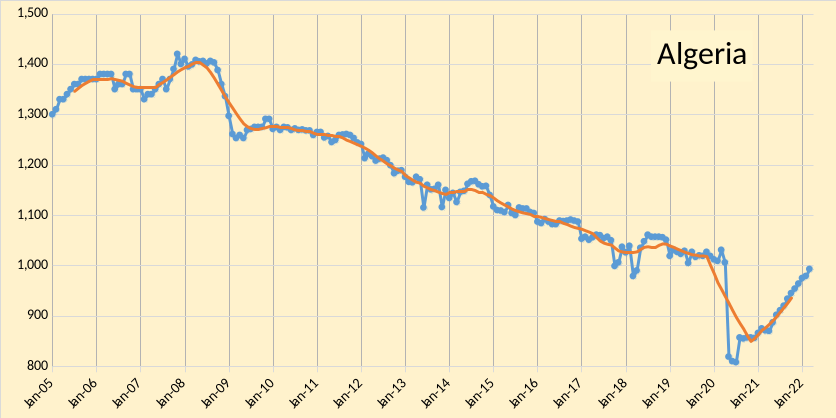
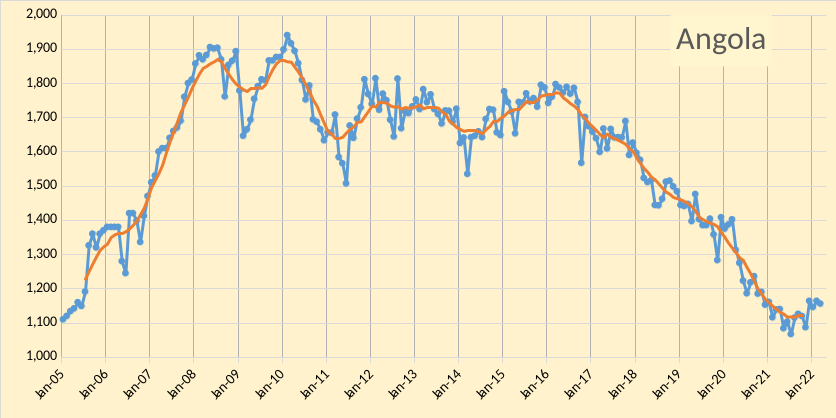
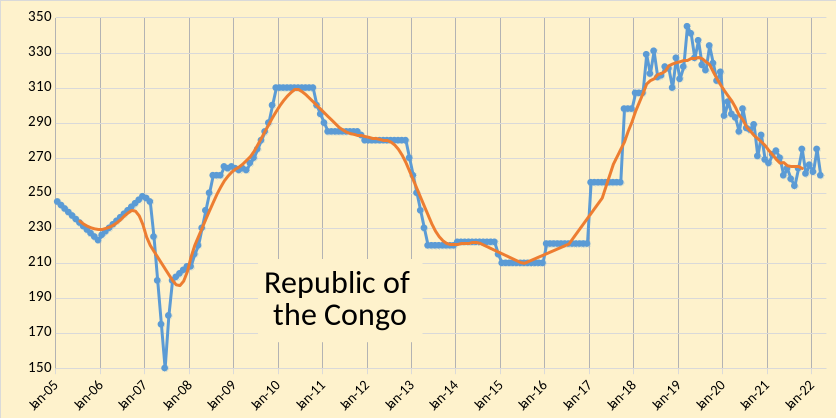
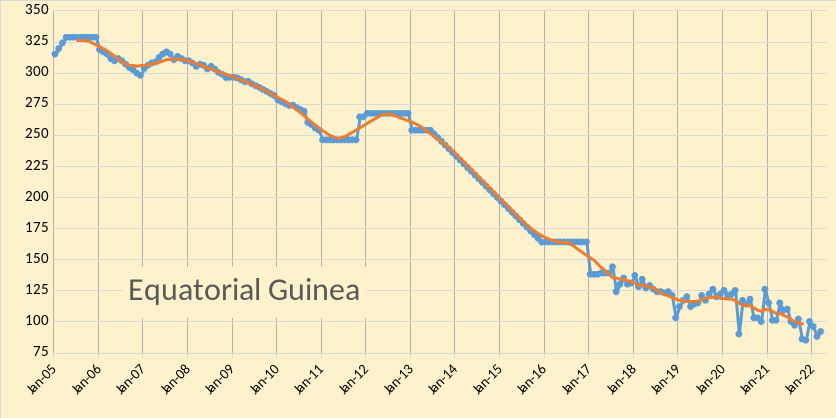
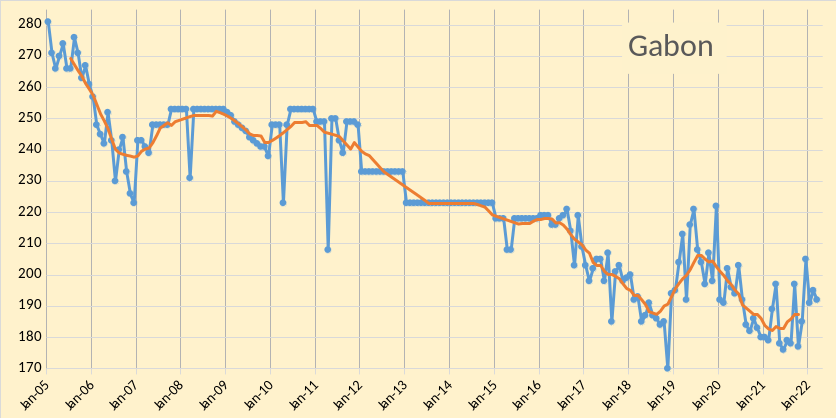
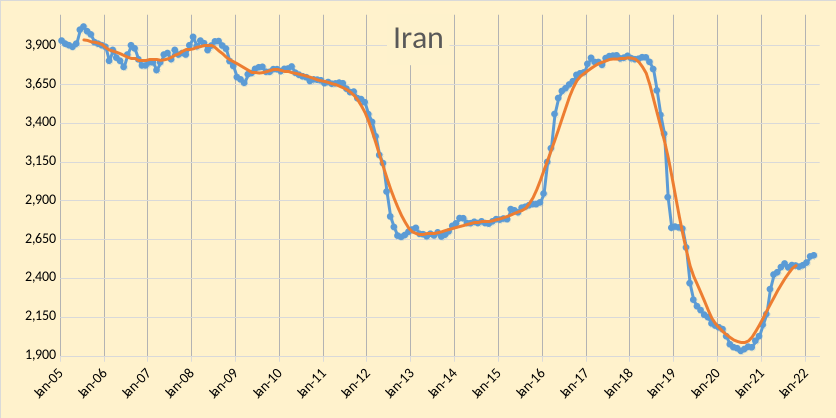
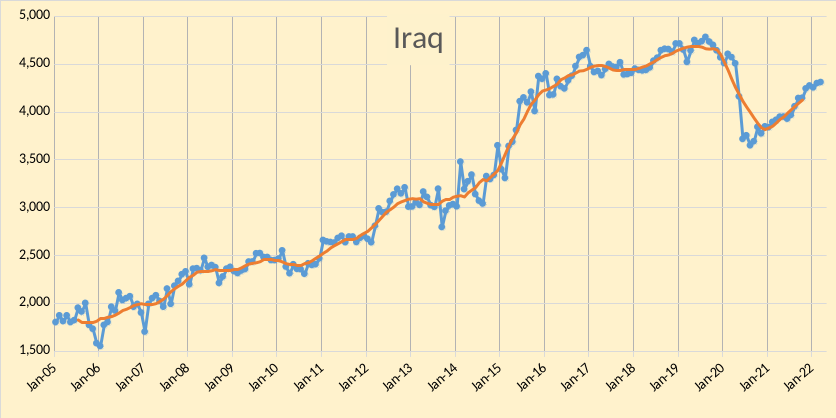
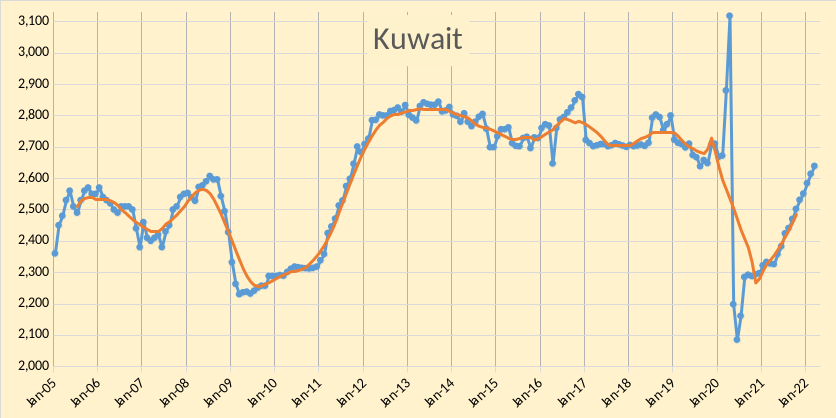
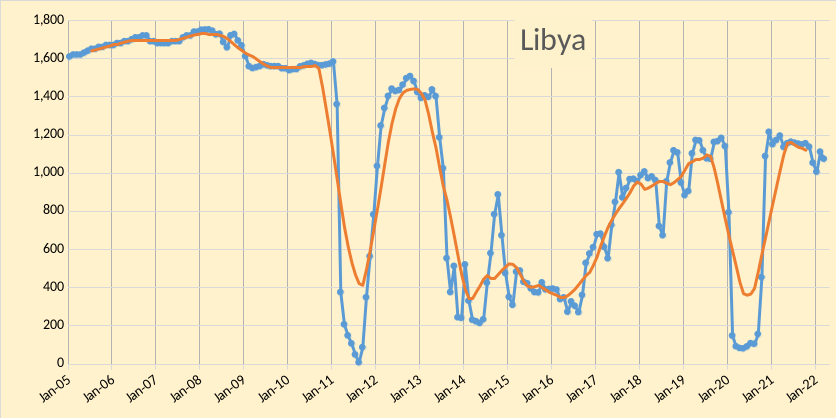
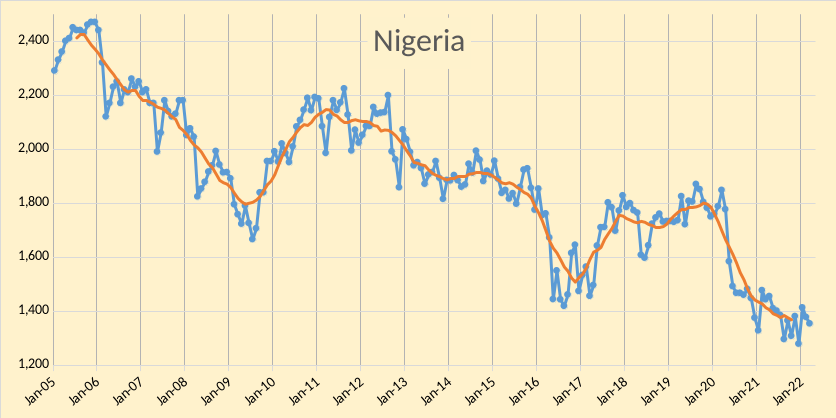
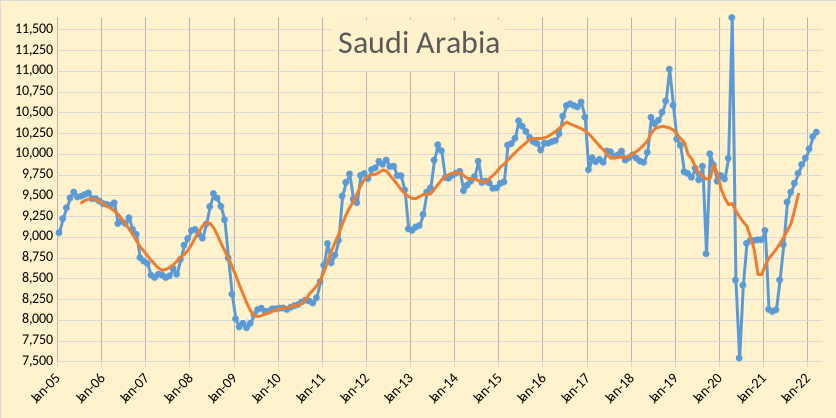
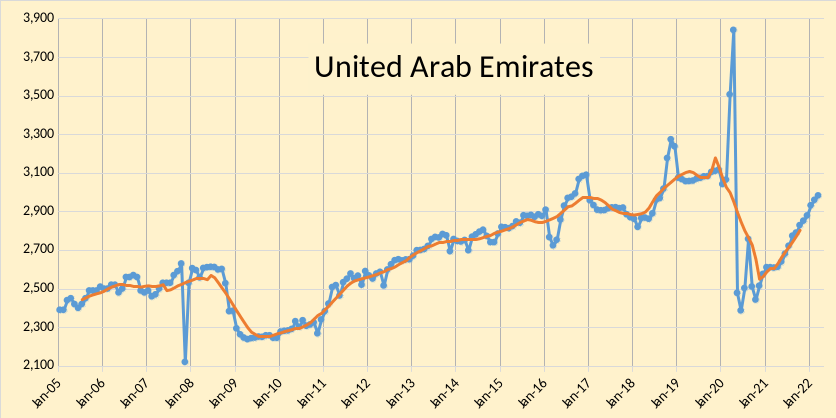
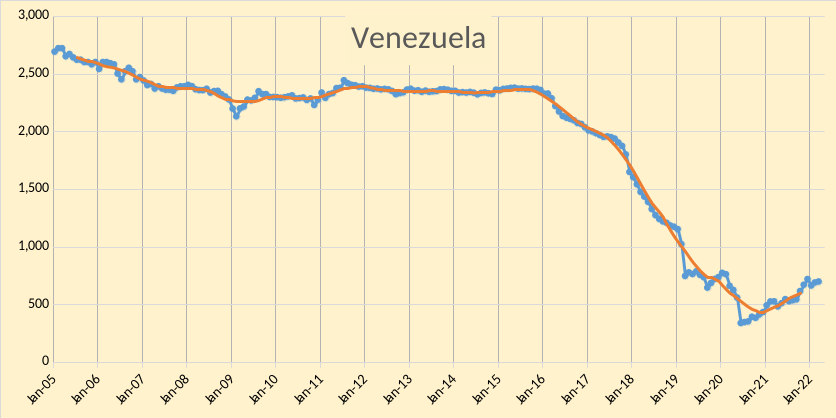
The OPEC Monthly Oil Market Report (MOMR) for April 2022 was published last week. The last month reported in each of the charts that follow is March 2022 and output reported for OPEC nations is crude oil output in thousands of barrels per day (kb/d). In most of the charts that follow the blue line is monthly output and the red line is the centered twelve-month average (CTMA) output.
Figure 1 Figure 2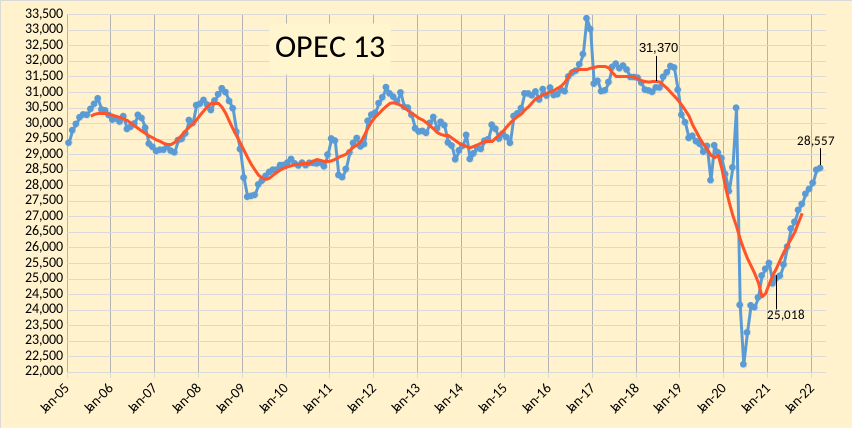
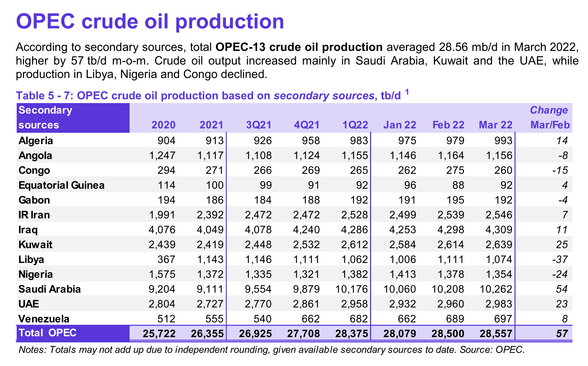
OPEC output increased by 57 kb/d according to secondary sources in March 2022. January 2022 output was revised higher by 45 kb/d from what was reported last month and February 2022 output was revised higher by 27 kb/d compared to the March 2022 MOMR. Most of the increase in OPEC output was from Saudi Arabia (54 kb/d) followed by Kuwait (25 kb/d), and UAE (23 kb/d). Five OPEC members saw increases of less than 15 kb/d (total of 44 kb/d for that group of 5 nations). Five OPEC nations had lower output in March, with Libya (-37 kb/d) and Nigeria (-24 kb/d) having the largest decreases in output and the other three nations with lower output in March having a combined decrease of 27 kb/d.
In the chart below, OPEC 13 crude and Russian C+C are shown, I expect that OPEC 13 crude plus Russian C + C are likely very near the short-term peak unless sanctions are removed from Iran in the near future. Any potential future increase for OPEC 13 will likely be more than offset by decreases in Russian C+C output over the next 6 to 12 months without increased output from Iran.
Figure 3 Figure 4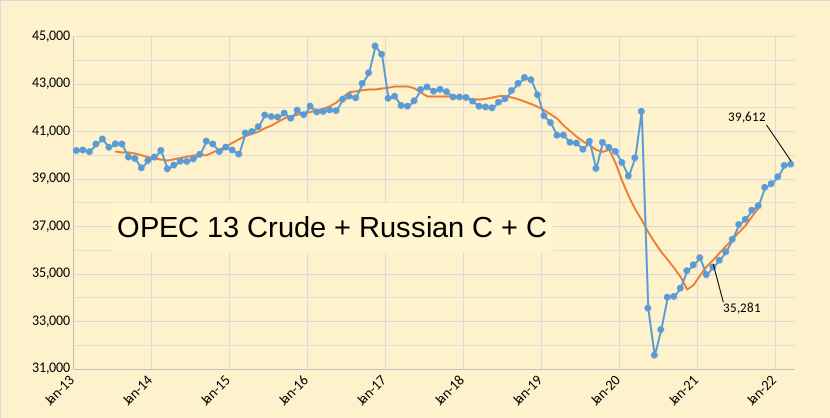
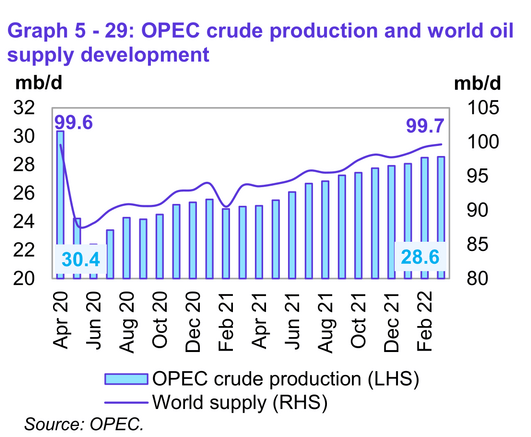
World liquids output surpassed the level from 24 months earlier based on OPEC estimates in figure 4 above.
Figure 5 Figure 6 Figure 7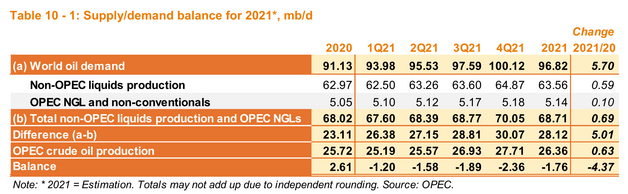
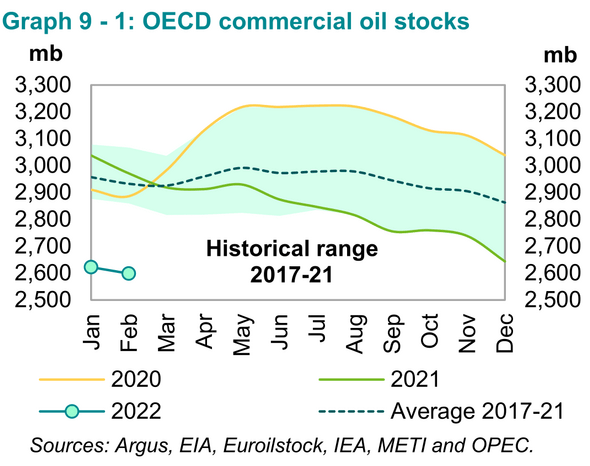
In figure 5 above, we see that OPEC produced 1.76 Mb/d less than needed to keep the market in balance in 2021, if we assume their estimates for supply and demand are correct. This implies a draw on World petroleum stocks of about 642 million barrels in 2021. As can be seen in Figure 7 above, OECD commercial stocks decreased by about 450 million barrels in 2021 so the rest of the stock draw either came from government-controlled stocks, oil on water, or non-OECD stocks. We know OECD government stocks decreased by about 57 million barrels in 2021 and oil on water increased by 54 Mb in 2021 (see MOMR Appendix), this implies non-OECD stocks fell by about 189 million barrels in 2021.
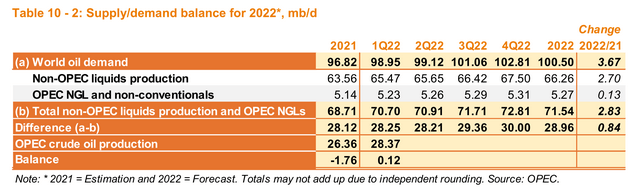
My estimate for OPEC capacity is roughly 130 kb/d above the March 2022 output level under the assumption that Iranian sanctions are not removed in 2022. Currently, negotiations with Iran are not going very well and it seems unlikely a compromise will be reached soon. This suggests oil stocks will continue to decrease if the estimates for the call on OPEC in the third and fourth quarters of 2022 outlined in figure 6 above prove correct. Note the large increase in non-OPEC output forecast in 2022 in figure 6, about a 2630 kb/d increase in output in one year (21Q4 to 22Q4) is forecast for the non-OPEC oil producers, including 960 kb/d for the US, it seems this forecast is likely too optimistic for oil supply. Bottom line, oil supply is very likely to be tight in 2022, and oil prices may be high unless a recession destroys some demand.
Figure 8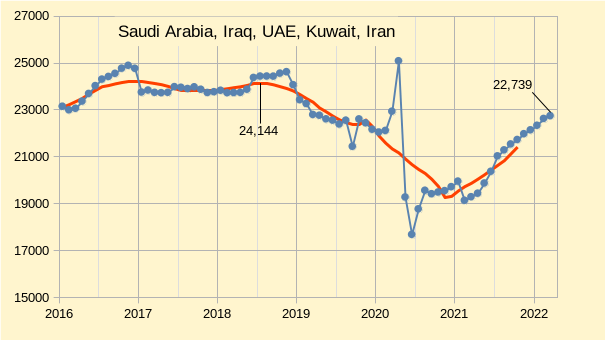
In the chart above, we see the combined output of the big 5 OPEC producers where most spare capacity might reside. If we deduct the spare capacity of Iran from the other 5 OPEC nations in Figure 8 and then deduct output in March 2022, we are left with only about 130 kb/d of spare capacity for OPEC (about 28687 kb/d of capacity when we add back output from the other eight OPEC nations in March 2022.) Note that I use the maximum 12-month average OPEC output to estimate capacity. If Iranian sanctions were removed, approximately 1275 kb/d of OPEC capacity might be added over 6 to 12 months, bringing total capacity to 29960 kb/d.
Figure 9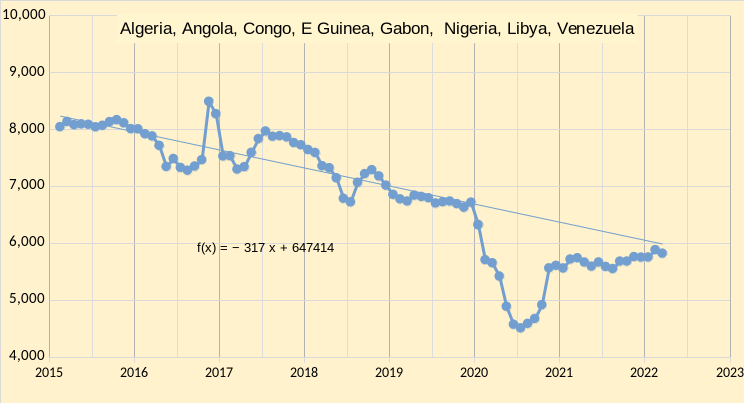
If we consider the other eight OPEC producers in Figure 9 above and look at the trend from Jan 2015 to December 2019, we find an annual decline rate of about 317 kb/d. Much of any OPEC spare capacity that might have existed in December 2019 may have been eroded by the declining output of this group of 8 OPEC nations (about a 1000 kb/d decrease from Jan 2019 to Jan 2022). I have used March 2022 output from these 8 nations to estimate capacity in March 2022, the concern is that future decline may reduce OPEC output capacity unless new resources are developed.
Figure 10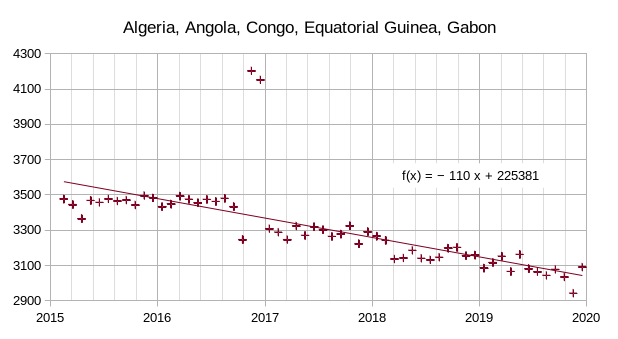
Consider figure 10 above, where we leave out three politically troubled nations (Libya, Nigeria, and Venezuela) from the group of 8 nations in Figure 9. Venezuela has seen steady decline from Jan 2016 to Jan 2020 at an annual rate of over 400 kb/d, Libya and Nigeria have seen large fluctuations in output over the years. The group of 5 nations in figure 10 have seen relatively steady decline from Jan 2015 to Dec 2019 at an annual rate of 110 kb/d. Venezuela may have reached bottom and is likely to see flat output to very slow decline going forward, Nigeria and Libya are more difficult to predict due to instability.
Figure 11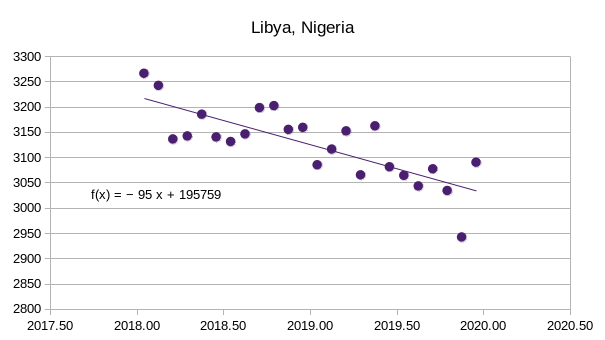
In 2018 and 2019, Libyan and Nigerian output was decreasing at an annual rate of 95 kb/d. If we add this the 5 OPEC nations in figure 10, we get an annual decrease of about 205 kb/d during the 2018 to 2019 period for 7 nations (Venezuela has been excluded from the original eight-nation group). Some of this decrease might have been due to quotas in 2019 (although Libya did not have a quota the other 6 nations did have a quota during most of 2019.)
A rough estimate for future annual decline rate from the 8 OPEC nations in figure 9 is about 250 +/-50 kb/d. It is not clear if the big 5 OPEC producers will be able to offset this decline in output in the future, my guess is that they have the resources to increase output at an annual rate of 250 kb/d or more, but time will answer this question.
Editor’s Note: The summary bullets for this article were chosen by Seeking Alpha editors.
Be the first to comment