

photobyphm
Based on Verizon’s (NYSE:VZ) stock performance, it might not be wise to venture into this investment long-term. However, there is a positive side that gives a higher dividend return than other stocks within the United States. Therefore, I sometimes wonder if it’s worth holding onto this weak stock performer for higher dividend income.
Fundamental very weak despite strong dividend return
Ratios
It is pretty discouraging to see the current and quick ratios decline for the most significant American cellular network over the last five years. What would be driving this decline?
|
Unnamed: 0 |
2017 |
2018 |
2019 |
2020 |
2021 |
|
Period |
FY |
FY |
FY |
FY |
FY |
|
Current ratio |
0.905 |
0.913 |
0.835 |
1.377 |
0.779 |
|
Quick ratio |
0.774 |
0.734 |
0.625 |
1.162 |
0.568 |
Source: Financial Modelling Prep
Growth
Verizon’s revenue growth story and profit have been fragile for the last five years. Here is not a good sign for a not-so-profitable company with little change.
|
, Unnamed: 0 |
2017 |
2018 |
201the 9 |
2020 |
2021 |
|
Period |
FY |
FY |
FY |
FY |
FY |
|
Revenue growth |
0.000 |
0.038 |
0.008 |
-0.027 |
0.041 |
|
Gross profit growth |
-0.001 |
0.012 |
0.024 |
-0.001 |
0.003 |
Source: Financial Modelling Prep
Data
Verizon’s simple moving average over 200 days and 50 days has been quite negative, with little return over the last 20 days. As a result, it is not a top growth story among all USA-based stocks.
|
Unnamed: 0 |
Values |
|
Income |
20.80B |
|
PEG |
2.26 |
|
EPS next Q |
1.23 |
|
Inst Own |
64.80% |
|
SMA20 |
1.78% |
|
SMA50 |
-5.27% |
|
SMA200 |
-21.50% |
Source: FinViz
Estimates
One would expect strong growth over the next five years for a large USA-based cellular network provider. As one can see, it appears to have tiny amounts of growth at best, but profit remains very flat. By looking at this analysis, one should use capital deployment wisely on such a flat-line story. Some long-term investors will only be interested in Verizon’s dividend strength over the next few years. This dividend strength puts Verizon as a top contender if this is all you are interested in.
|
YEARLY ESTIMATES |
2022 |
2023 |
2024 |
2025 |
2026 |
|
Revenue |
136,530 |
138,238 |
140,000 |
139,651 |
141,505 |
|
Dividend |
2.58 |
2.63 |
2.69 |
2.75 |
2.79 |
|
Dividend Yield (in %) |
6.86 % |
6.99 % |
7.13 % |
7.30 % |
7.42 % |
|
EPS |
5.20 |
5.05 |
5.10 |
5.11 |
5.46 |
|
P/E Ratio |
7.25 |
7.45 |
7.39 |
7.36 |
6.89 |
|
EBITDA |
47,918 |
48,738 |
49,470 |
50,166 |
51,491 |
|
Net Profit |
20,830 |
21,138 |
21,384 |
21,336 |
23,286 |
|
EPS (GAAP) |
4.78 |
5.02 |
5.12 |
5.23 |
5.37 |
|
Net Debt |
145,722 |
141,218 |
134,358 |
125,288 |
115,869 |
|
Research & Development Exp. |
– |
– |
– |
– |
– |
|
Total Assets |
379,773 |
393,229 |
393,968 |
392,118 |
399,487 |
Source: BusinessInsider
Enterprise
Analyzing Verizon’s share price since 2019, it has been relatively flat at best, with a decline for this year. Based on looking at the forward guidance estimates, one should avoid this stock for better performance elsewhere.
|
Unnamed: 0 |
2018 |
2019 |
2020 |
2021 |
2022 |
|
Symbol |
VZ |
VZ |
VZ |
VZ |
VZ |
|
Stock price |
54 |
59.360 |
54.750 |
52.900 |
46.190 |
|
Number of shares |
4.128 B |
4.138 B |
4.140 B |
4.148 B |
0 |
|
Market capitalization |
222.912 B |
245.632 B |
226.665 B |
219.429 B |
0 |
|
Enterprise value |
333.230 B |
357.008 B |
355.041 B |
394.438 B |
173.709 B |
Source: Financial Modelling Prep
Risk is potentially high for weak stock performance
Sustainability
With an underperforming sustainability rating, there appears to be no effort to make this company perform better to attract the most significant asset managers to invest. Verizon would be wise to make all efforts to ensure their company becomes environmentally friendly.
|
Unnamed: 0 |
Value |
|
Social score |
8.92 |
|
Peer count |
64 |
|
Governance score |
5.69 |
|
Total esg |
18.48 |
|
Highest controversy |
3 |
|
ESG performance |
UNDER_PERF |
|
Percentile |
20.38 |
|
Peer group |
Telecommunication Services |
|
Environment score |
3.88 |
Source: Yahoo Finance
High risk to holding stock but dividend outlooks remains very strong
Price Target
Stock market analysts expected higher stock prices by setting very high target levels. However, they must be disappointed as the stock price has declined over the last few months.
price target verizon (custom platform)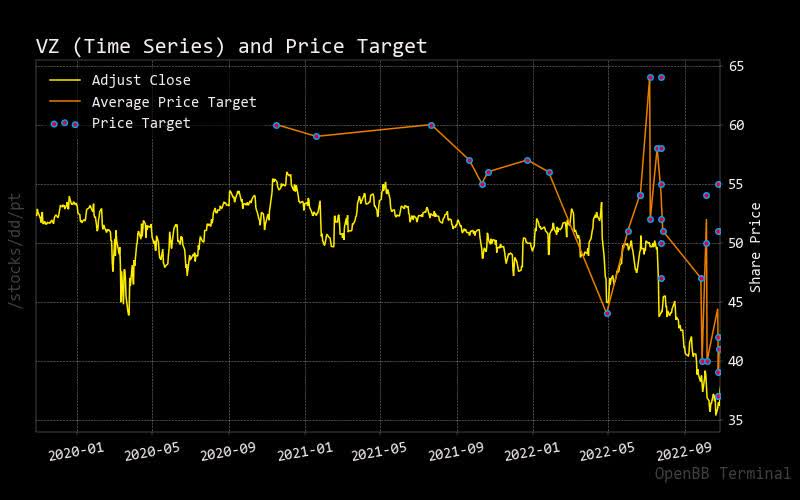
Source: BusinessInsider
Recommendation
Most investors are highly attracted to the high-paying dividend. Outside of that, this stock appears to be a complete dog, but it makes sense that they have to pay a high-paying dividend compensation to attract stockholders.
|
Interval |
RECOMMENDATION |
BUY |
SELL |
NEUTRAL |
|
One month |
STRONG_BUY |
18 |
1 |
7 |
|
One week |
BUY |
13 |
2 |
11 |
|
One day |
BUY |
14 |
2 |
10 |
Source: Trading View
Price vs. Short Volume
If you are only interested in the stock price, you can see that the shorting volume was slightly higher than 50% of the total trading volume. As already highlighted, this is a stock worthy of choice for its dividend rather than for its performance.
short verizon (custom platform)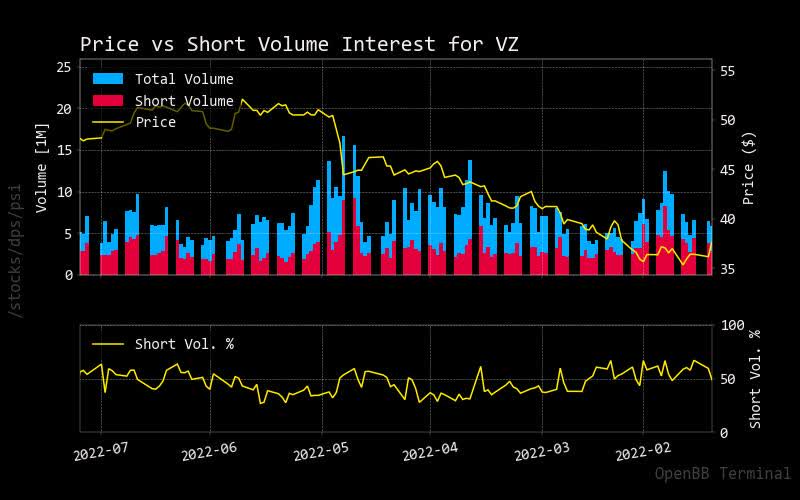
Source: StockGrid
Insider Stats
It seems that only executives are selling this stock for all of 2022. Here it is noteworthy to show that executives are not confident in the long-term performance of their employer’s stock.
|
Unnamed: 0 |
X |
Filing Date |
Trading Date |
Ticker |
Insider |
Title |
Trade Type |
Price |
Quantity |
Owned |
Delta Own |
Value |
|
0 |
nan |
2022-07-07 08:13:35 |
2022-07-05 |
VZ |
Silliman Craig L. |
EVP, ChiefAdminLegal, PubPolOf |
S – Sale |
$51.42 |
-1,558 |
37,980 |
-4% |
-$80,112 |
|
1 |
nan |
2022-06-07 08:04:50 |
2022-06-03 |
VZ |
Silliman Craig L. |
EVP, ChiefAdminLegal, PubPolOf |
S – Sale |
$50.94 |
-1,558 |
39,538 |
-4% |
-$79,365 |
|
2 |
nan |
2022-05-25 08:25:20 |
2022-05-23 |
VZ |
Silliman Craig L. |
EVP, ChiefAdminLegal, PubPolOf |
S – Sale |
$50.00 |
-1,558 |
41,097 |
-4% |
-$77,900 |
Source: Open Insider
Technical Analysis shows Verizon has long way to go before any investment
Fibonacci
After this long steep decline, Verizon’s current stock price is technically above the Fibonacci trend line. So, are any short-term rallies to occur over the next few days or weeks?
fibonacci verizon (custom platform)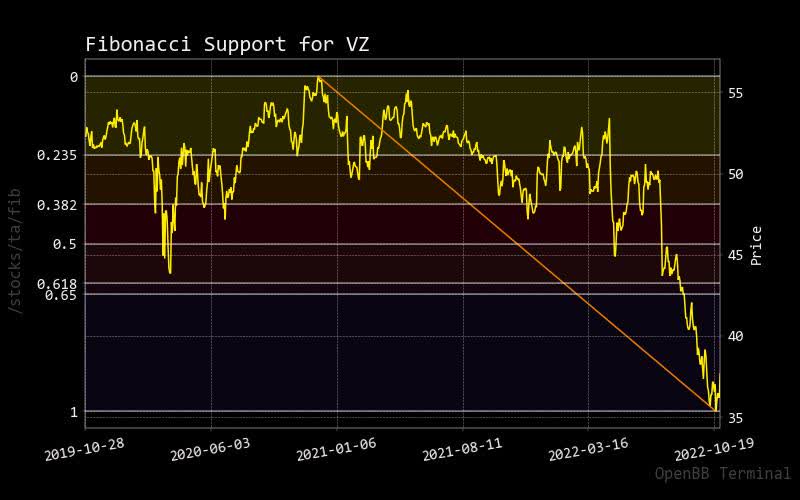
Bollinger Bonds
As the current stock price has broken through the upper Bollinger band, one should consider investing in this stock for dividend growth. However, based on negative fundamentals over the long run, it might be wise to hold off until positive catalyst news build momentum in Verizon.
bollinger verizon (custom platform)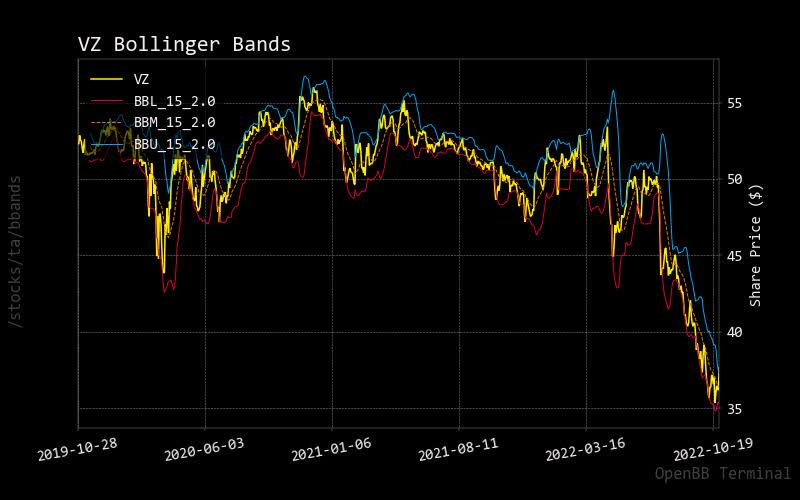
RSI
Has this relative strength indicator shown optimal market entry potential? Verizon is a stock to watch instead of taking entries on. However, as stated before, one might think to take positions currently under these conditions if they are only interested in the strong dividend returns. For day traders only interested in stock performance, Verizon is not a wise stock to hold at this current time.
rsi verizon (custom platform)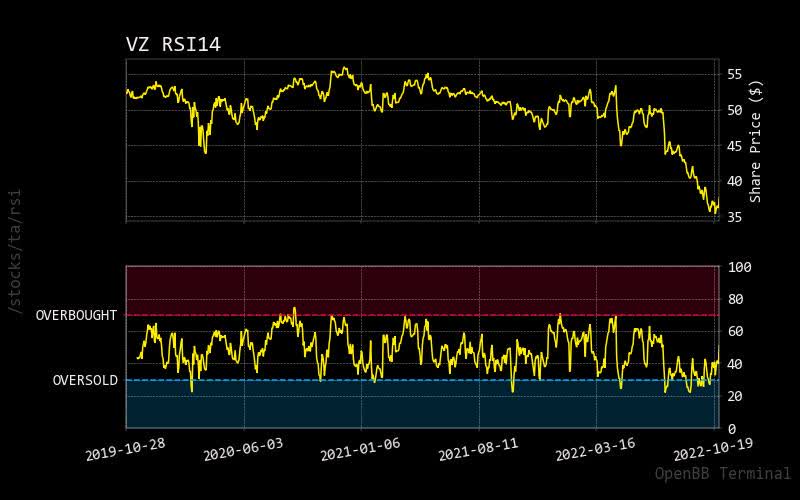
Prediction via AI
Monte Carlo
The results of the Monte Carlo simulation show that strength for upper momentum is there with more predictive paths. Also, the normalized distribution graph shows an expectation of a slight probability of higher prices for Verizon. As stated earlier, looking at other stocks with a higher likelihood of stock performance might be wise.
monte csrlo verizon (custom platform)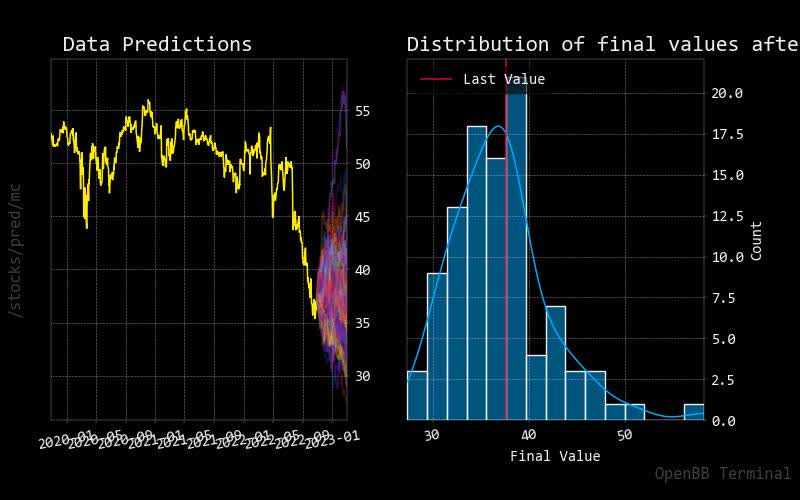
Regression
It is rare to see a red regression trendline over 30 days point down. It might be wise to take this as a warning if you are interested in stock performance only.
regression verizon (custom platform)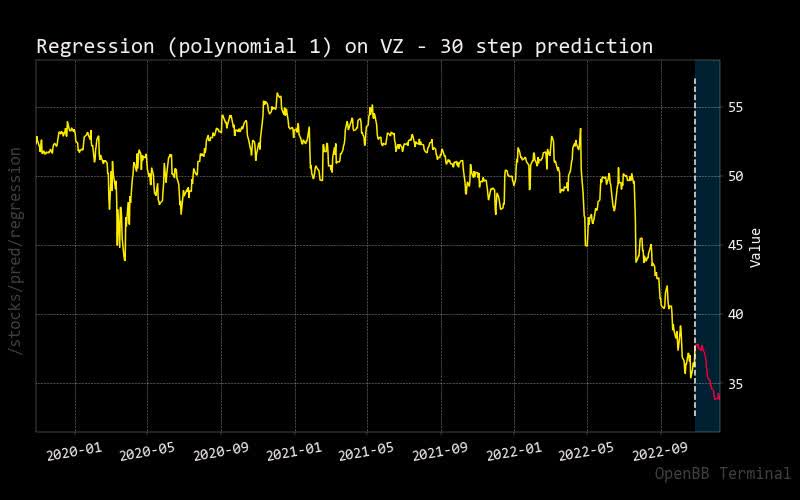
Conclusion
Based on stock performance alone, Verizon is not worthy of holding based on poor fundamentals, flat growth potential, and fragile technical analysis. The positive for this company is its high dividend income over the next few years. I prefer to focus on stock performance return versus holding just for higher dividend income. Because of this weakness, I could only see this stock being a sell rating despite wanting to have it for its dividend income.
Be the first to comment