


hh5800
In this analysis of ON Semiconductor (NASDAQ:ON) (hereafter referred to as “onsemi”), we covered the company following its recently announced expansions for its SiC business. We analyzed the growth of its SiC business and estimated its revenue share as a % of its Power Solutions Group (‘PSG’) segment (51% of total revenues) based on management guidance and its long-term supply agreements. Furthermore, we compared the company’s SiC products against competitors to determine whether it has a competitive advantage. Lastly, we analyzed the company’s capex intensity as a % of revenue with the planned expansions in East Fishkill and the Czech Republic and forecasted its FCF margins.
PSG Segment Growth Supported By SiC Growth
From the company’s previous earnings briefing, management stated that its SiC long-term supply agreement had reached $4 bln over the next 3 years, a significant increase from $2 bln in our previous analysis, an increase of 100%. Moreover, the company raised its target “to triple last year’s silicon carbide revenue in 2022 and exceed $1 billion in revenue in 2023”. In its latest earnings briefing, management reaffirmed its SiC revenue targets.
We remain on track to triple our SiC revenue in 2022 and deliver $1 billion of revenue in ’23 based on committed revenue from LTSAs
– Hassane El-Khoury, President & Chief Executive Officer
|
onsemi SiC Projections ($ mln) |
2021 |
2022F |
2023F |
2024F |
2025F |
2026F |
|
SiC Revenue |
80 |
239 |
1,000 |
1,300 |
1,690 |
2,197 |
|
Growth % |
200% |
318.8% |
30.0% |
30.0% |
30.0% |
|
|
Other PSG Revenue |
3,360 |
3,982 |
4,680 |
5,453 |
6,300 |
7,215 |
|
Growth % |
18.5% |
17.5% |
16.5% |
15.5% |
14.5% |
|
|
Total PSG Segment |
3,439 |
4,221 |
5,680 |
6,753 |
7,990 |
9,412 |
|
Growth % |
22.7% |
34.6% |
18.9% |
18.3% |
17.8% |
|
|
SiC Revenue as % of Total PSG Revenue |
2.3% |
5.7% |
17.6% |
19.3% |
21.2% |
23.3% |
Source: ON Semiconductor, Yole Development, Khaveen Investments
Thus, we based our SiC revenue forecast in 2022 based on management guidance as it was on track to triple its 2021 revenue ($80 mln) and exceed $1 bln in 2023. Moreover, for 2024, we assumed a growth rate of 30%, thus its next 3 years’ revenue is in line with management’s guidance of $4 bln in revenue commitments. The company’s SiC business is part of its PSG segment (7% of revenues in 2021). We based our forecast for its remaining PSG segment revenue on its historical average growth rate of 18.5% but tapered by 1% as a conservative estimate through 2026.
With that, we expect the company’s SiC revenue growth to support its PSG segment growth due to its higher growth rate. Based on the table, we see its SiC revenue as a % of PSG segment revenue increasing from 2.3% in 2021 to 23.3% by 2026 with the higher growth rate of the SiC revenue growth at a 5-year forward average of 122% compared to other PSG segment revenue growth of 17%.
Competitive Advantage in Terms of Product Breadth but For Lower Performance Products
In our previous analysis, we determined that the company has a competitive advantage over competitors with the highest SiC product portfolio breadth based on the number of products but at a performance disadvantage with a max product Volts of 1200V.
We compared the company’s SiC portfolio and updated our comparison between the top 4 largest SiC companies.
|
Company |
Number of SiC Products |
Volts (Range in V) |
RDS(‘on’) (mΩ) |
Number of Products (650-1199V) |
Number of Products (1200-1699V) |
Number of Products (1700V<) |
|
STMicro (STM) |
63 |
Up to 1700 |
8.8 – 1300 |
25 |
34 |
4 |
|
Wolfspeed (WOLF) |
64 |
Up to 1700 |
15 – 1000 |
33 |
27 |
4 |
|
Infineon (OTCQX:IFNNY) |
63 |
Up to 1700 |
7 – 1000 |
26 |
34 |
3 |
|
onsemi |
87 |
Up to 1700 |
12 – 160 |
45 |
40 |
2 |
|
Average |
69 |
32 |
34 |
3 |
Source: Company Data, Khaveen Investments
Based on the table above, onsemi still has the highest portfolio breadth among competitors with the highest number of SiC products (87) followed by Wolfspeed (63). In terms of performance, onsemi has improved following the launch of its 1700V SiC products. Though, we believe all of the top 4 companies have a similar performance advantage with a maximum product volt reaching up to 1700V. Besides that, in terms of RDS(‘on’) as highlighted in our previous analysis, onsemi’s products have a “lower range of 12-160mΩ which we believe indicates its greater product efficiency”.
In terms of product breadth for products between 650V to 1700V, on semi has the highest number of products for each range. However, it has the lowest number of products at 2 while the highest is tied between ST Micro and Wolfspeed (4).
All in all, we believe since our May coverage of onsemi, the company’s SiC product portfolio has improved with a better performance with its new 1700V products but is similar to the max range of the top 4 competitors. Though, we believe the company’s competitive advantage remains as its superior portfolio breadth compared to competitors with a higher number of SiC products but for lower performance chips below 1700V.
Increasing Capex Intensity
According to the company in its latest earnings briefing, the company guided its increasing capex intensity. This is as it focuses on increasing its SiC production support its revenue commitments. Also, the company recently acquired its East Fishkill fab for a cost of $430 mln with $330 mln to be paid by the end of 2022.
We continue to ramp our silicon carbide production and invest in 300-millimeter capability to support our long-term growth we expect our capital intensity to be in the mid- to high-teen percentage range.
– Thad Trent, Chief Financial Officer
|
Onsemi Capex ($ mln) |
1Q 2022 |
2Q 2022 |
3Q 2022 |
4Q 2022F |
|
Capex |
173.8 |
218 |
271 |
315 |
|
Revenue |
1,945 |
2,085 |
2,193 |
2,082 |
|
Capex as % of revenue |
8.9% |
10.5% |
12.4% |
15.1% |
Source: ON Semiconductor, Khaveen Investments
In Q3 2022, the company’s capex as a % of revenue had increased to 12.4% from 10.5% in the prior quarter and 8.9% in Q1 2022. Based on the midpoint of management’s capex guidance of between $300 mln to $330 mln from its earnings briefing, we estimated its capex intensity to increase to 15.1% based on our revenue forecast in Q4 2022, which is in line with management’s guidance as stated above.
|
Onsemi Capex ($ mln) |
2015 |
2016 |
2017 |
2018 |
2019 |
2020 |
2021 |
Average |
|
Adjusted Capex |
272.2 |
212.9 |
395.7 |
514.8 |
630.0 |
483.6 |
492.0 |
-361.83 |
|
Adjusted CapEx/Revenue |
7.8% |
5.4% |
7.1% |
8.8% |
11.4% |
9.2% |
7.3% |
7.8% |
Source: ON Semiconductor, Khaveen Investments
In the table above, the company’s 10-year average capex as a % of revenue was 7.8% and a 5-year average of 8.8%. Thus, this further highlight its increasing capital capex in 2022. Moreover, the company is expanding in the Czech Republic with a planned investment of $300 mln in 2023 after spending $150 mln since 2019. Thus, we forecasted the company’s total capex in 2023 based on our estimated 2022 capex as a % of revenue of 11.8% with the increasing capex intensity as well as factored in planned expansions of $300 mln in the table below.
|
Onsemi Capex Forecast ($ mln) |
2022F |
2023F |
2024F |
2025F |
2026F |
|
Capex |
978 |
1,192 |
1,531 |
1,739 |
1,969 |
|
Revenue |
8,304 |
10,122 |
11,546 |
13,118 |
14,853 |
|
Capex For SiC Expansions |
300 |
||||
|
Total Capex |
978 |
1,492 |
1,531 |
1,739 |
1,969 |
|
Total Capex as % of Revenue |
11.8% |
14.7% |
13.3% |
13.3% |
13.3% |
|
FCF Margin |
20.7% |
11.8% |
16.1% |
16.2% |
16.2% |
Source: ON Semiconductor, Khaveen Investments
ON Semiconductor, Khaveen Investments
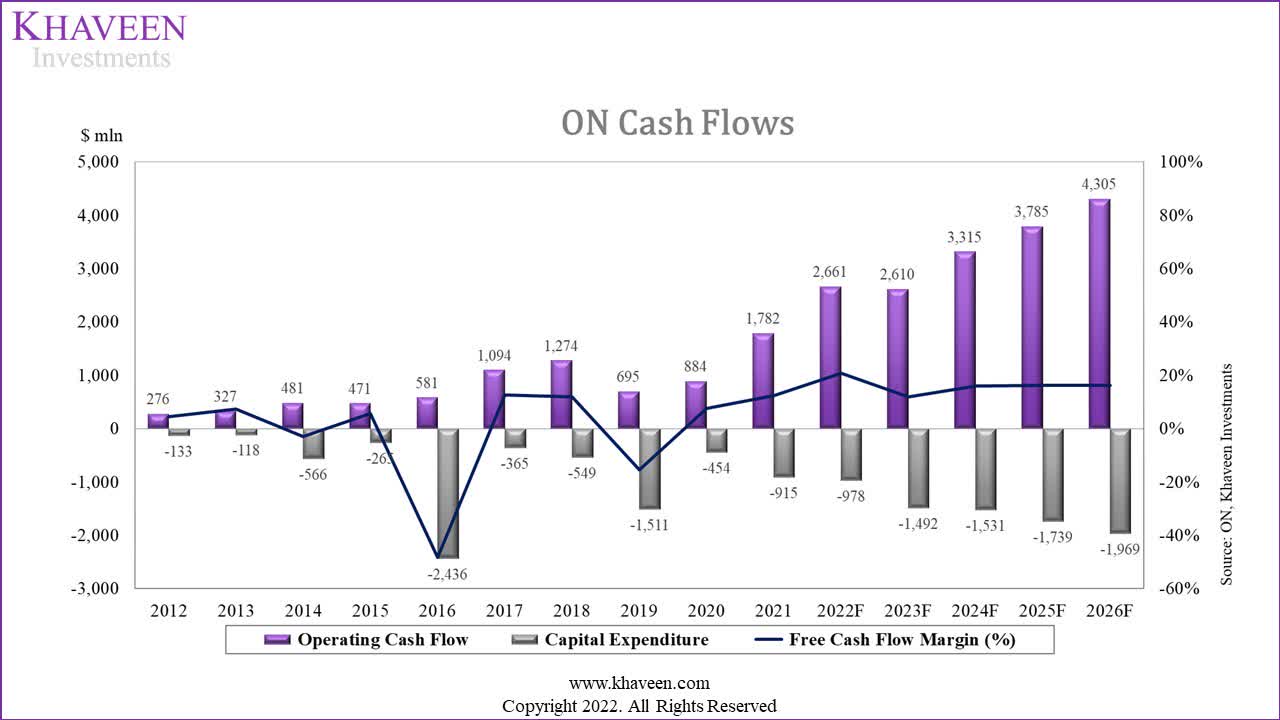
Based on our revenue forecasts, we estimated its capex as a % of revenue to be 11.8% in 2022 and 14.7% in 2023 which is in line with management guidance of “mid- to high teens”. In 2024 and beyond, we estimated its capex based on a 2-year average capex as a % of 13.3%. With that, we see its capex intensity increasing to a 5-year average capex as a % of revenue of 13.3% compared to its 10-year average of 7.8%. In terms of its FCF margins, we modeled it with a 5-year forward average of 16.2%.
Risk: Increasing Competition
As onsemi focuses on SiC growth and capacity expansions, its competitors are also expanding capacity. For example, we previously covered Wolfspeed where we highlighted its aggressive planned expansions across North Carolina. We estimated its supply growth to be higher than its demand growth through 2026. Whereas other competitors such as STMicro has begun construction of a SiC substrate plant in Europe as it aims to source 40% of its substrates internally by 2024.
Thus, we believe the company could face increasing competitive pressures as its competitors aggressively expand production.
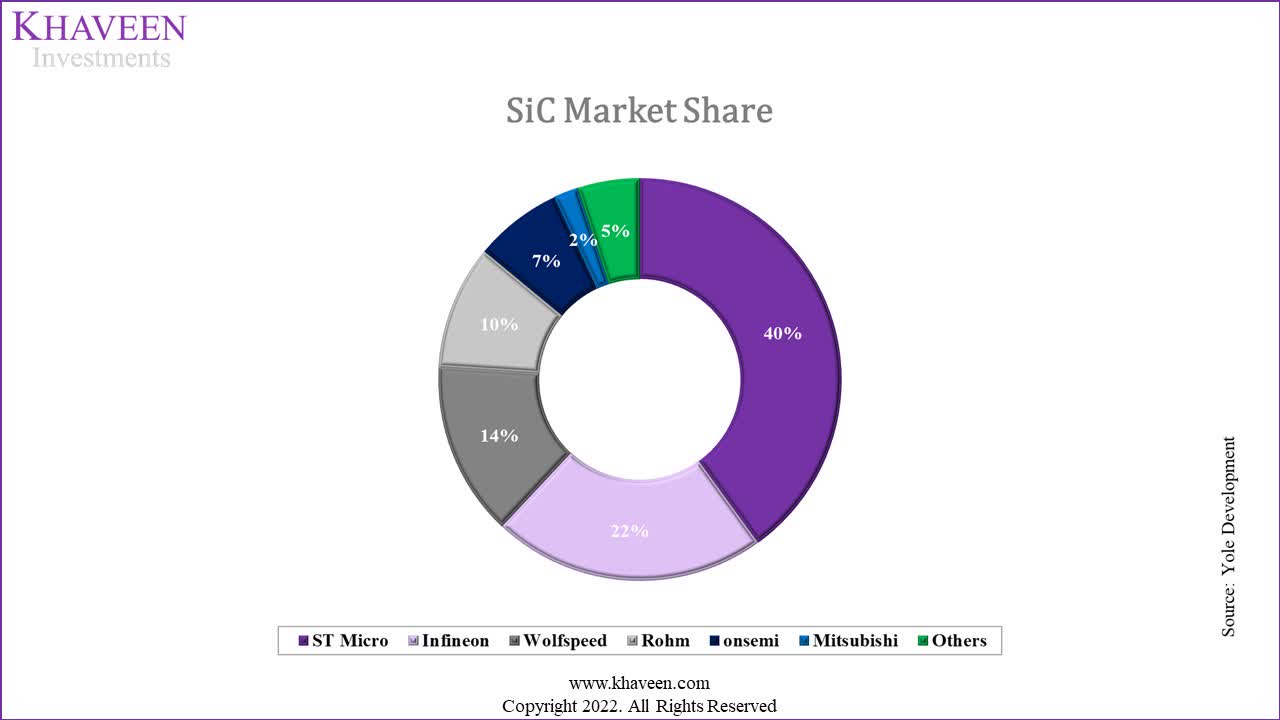
Yole Development, Infineon, Khaveen Investments
Verdict
Overall, we expect the company’s power semicon segment growth to be driven by its SiC business growth at a 5-year forward average of 122% compared to other PSG segment revenue growth of 17% and its SiC revenue as a % of PSG segment revenue increasing from 7% in 2021 to 23.3% by 2026 supported by its $4 bln long-term agreements. Furthermore, we determine that the company’s competitive advantage is its superior product portfolio breadth instead of a performance advantage despite it introducing its new 1700V which is on par with the max performance of its competitors. Lastly, we see its capex intensity increasing at a 5-year average of 13.3% compared to its 10-year average of 7.8% but we see its FCF margins remaining strong at a 5-year average of 16.2%.
Khaveen Investments
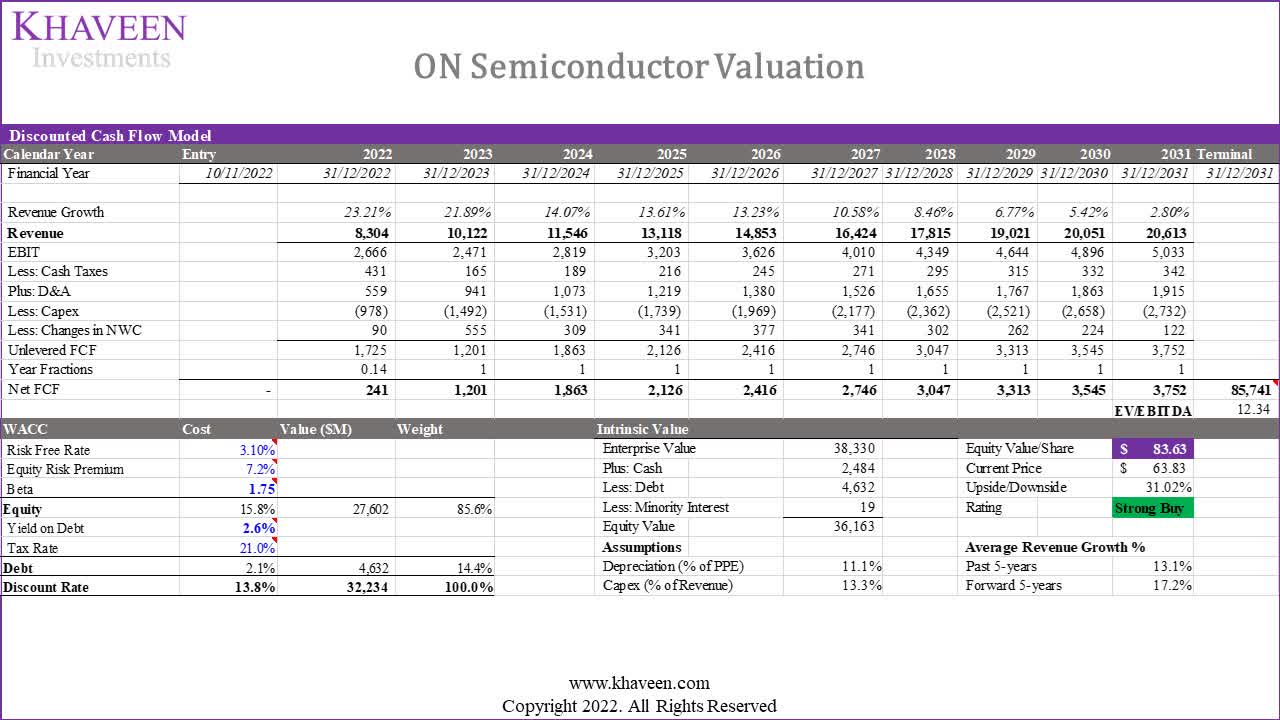
We updated our valuation from our previous analysis. We’re modeling a higher forward 5-year average growth of 17.2% compared to 7.3% previously and obtained a higher price target of $83.63 which is an upside of 31.02%, lower than our previous upside of 31.4% as the company’s stock price had reached our price target rising by 23% since our last coverage, thus we maintain a Strong Buy rating with a higher price target following our updated revenue projections factoring its SiC growth.
Be the first to comment