

Ninoon
Omega Healthcare Investors (NYSE:OHI) reported Q3 earnings on 11/3/22. OHI has been a controversial REIT as many have speculated that the dividend would need to be reduced due to problematic latencies regarding payments from several of their operators. The impacts of the pandemic have taken a toll on nursing homes and assisted living facilities, and OHI has been in the process of operator restructurings to mitigate its downside risk. The bear thesis has called for a dividend cut due to non-payments, but each quarter in 2022, OHI has paid its quarterly dividend of $0.67 and posted a funds from operations (FFO) beat. The 2022 FFO consensus estimate is $2.93; in 2023, OHI is expected to increase the FFO generated by 4.1% ($0.12) to $3.05. While OHI hasn’t recovered to its pre-pandemic highs, it’s been a consistent high-yielding income play that has provided a continuous stream of cash flowing into its shareholder accounts.
Seeking Alpha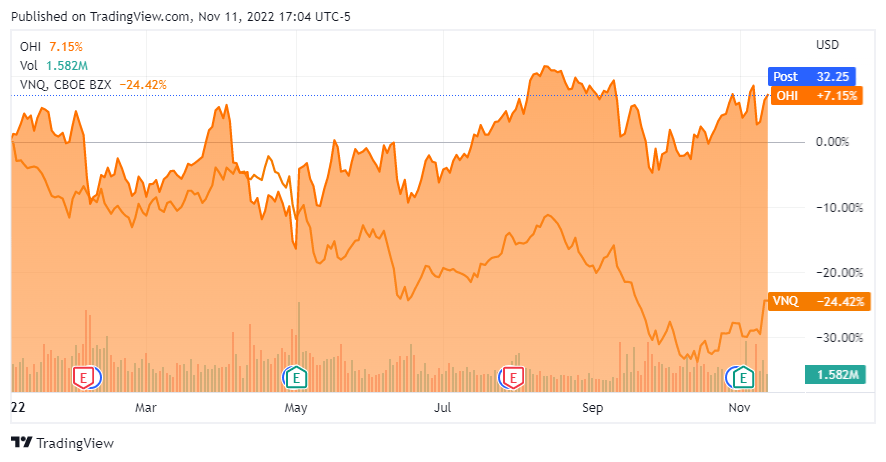
Omega Healthcare could trade sideways for years and the dividend would be more than enough to keep me interested.
I invest in REITs with a primary focus on income generation and a secondary focus on capital appreciation. As the population ages, nursing homes and assisted living facilities will be imperative to supporting the elderly. Regardless of the lingering effects of the pandemic, I am not concerned about their viability in the future, as the need for their services won’t be eradicated. OHI is a leader in the field, and I am confident that this trend will remain well into the future, which should lead to many additional dividend payments finding their way into my accounts.
I purchased my first block of shares for $31.57 at the end of 2017 and dollar cost average at the beginning of 2018 when shares fell to $27.38. Excluding the dividends, my out-of-pocket cost is $29.95 per share. By reinvesting the dividends, my share count and my future projected income has increased by 48.72%. My initial investment has grown by 58.11% in roughly 5 years. OHI is paying another quarterly dividend on 11/15, which I plan on reinvesting. I am projecting that my share base and future projected income will increase by 2.10% based on OHI’s current share price.
Omega Healthcare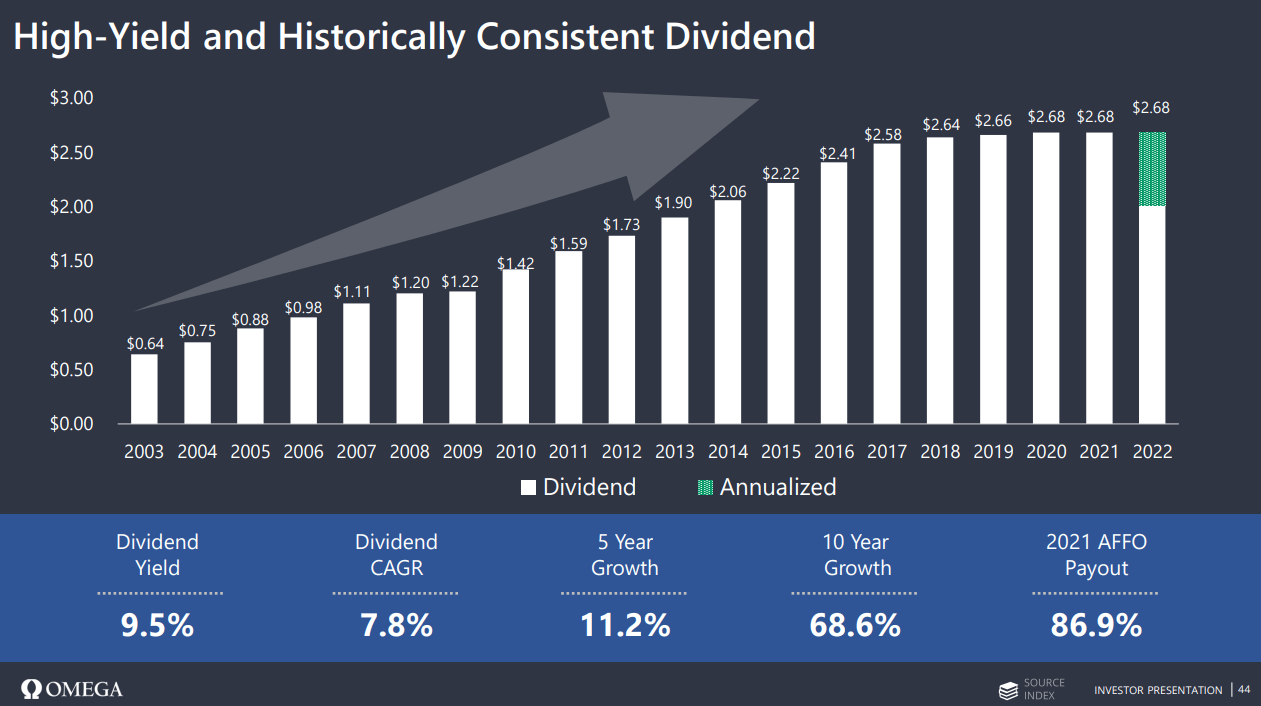
OHI didn’t cut or reduce the dividend during the height of the pandemic when other REITs were forced to, and since the pandemic, OHI has paid $0.68 per share for each quarterly payment. OHI is trading down roughly -28.33% from its pre-pandemic highs of $44.65, yet my investment is working out quite well. As long as OHI continues to deliver large amounts of income to its shareholders through its dividend, my future projected income would continue to increase. Even if OHI trades sideways, my overall investment should also increase. With 1-year CDs offering over 4.25%, there aren’t many income investments that are enticing as equities require a level of risk tolerance. Since I can receive 4.25% risk-free, I need at least 6-7% from a REIT to get really interested. OHI’s yield exceeds 8%, and my personal investment has shown just what can happen over a period of time from reinvesting the dividends. I will be looking forward to the upcoming dividend payment so I can increase my share count and wait for the next quarterly dividend payment.
Omega Healthcare delivered for its shareholders in Q3 2022 and it should mitigate the bear case
OHI delivered stronger than expected earnings as they provided a top and bottom line beat. OHI generated $0.76 of Adjusted FFO while the consensus estimate was $0.74, and its revenue came in at $239.4 million while the consensus estimate was $215.9 million. OHI’s funds available for distribution came in at $173 million, and OHI declared another $0.67 quarterly dividend keeping its annual payout of $2.68 intact.
While numbers are important, the commentary around operations and its fellow operators was what many investors wanted to see. OHI completed $28 million in real estate acquisitions and funded $19 million in capital renovation and construction projects that are in progress. OHI also sold 4 facilities for $51 million in cash and invested $40 million in a new loan that generates 12% in interest.
OHI provided updated information on some of its operators. Agemo continued to miss rent and interest payments under its lease and loan agreement, and OHI didn’t produce revenue from this tenant in Q3. OHI sold 2 facilities that were previously leased to Agemo in connection with OHI’s lease and loan agreement with Agemo. In Q4, OHI sold an additional 19 facilities leased to Agemo, which generated $316 million in proceeds. In the back half of 2022, OHI will have sold 21 facilities that were leased to Agemo for $359 million in gross proceeds.
In March of 2022, there was another operator which represented 2.4% of the Q1 contracted rent agreements that did not pay their March obligations to OHI. OHI had placed this operator on a cash basis of revenue recognition during the second quarter and wrote off $8.3 million of straight-line rent receivables through rental income. During Q3, OHI was only able to recognize the cash received in the third quarter of $2.5 million for revenue, AFFO, and FAD purposes and is continuing its portfolio restructuring discussions with this operator.
In June of 2022, another operator, which accounted for 2.2% of OHI’s Q2 contracted rent and interest obligations, underpaid the contractual rent amount due under its lease agreement by $0.6 million. OHI drew the full amount of the operator’s $5.4 million letter of credit and applied $0.6 million of the proceeds to pay the unpaid portion of June’s rent and held the balance in a cash account. In Q3, this operator continued its partial payments causing OHI to apply $3.3 million of the cash collateral against the unpaid rent during this period. OHI has placed this operator on a cash basis of revenue recognition during the third quarter of 2022 and wrote off approximately $10.5 million of straight-line rent receivables and lease inducements through rental income. OHI is also continuing portfolio restructuring discussions with the operator.
On the Q3 conference call, Taylor Pickett (OHI CEO) provided considerable context around these restructurings. He implied that working with these operators through the portfolio restructurings will have minimal to no impact on its asset values or long-term cash flows. OHI has completed 11 quarters in what they are calling the Covid-Era and specified that there is a pathway to exit the pandemic with limited financial damage. OHI’s Q3 funds available for distribution (FAD) came in at $0.71, which is just below its pre-covid Q1 2020 FAD of $0.74. To protect OHI and the long-term value proposition for shareholders, management has sold $1.6 billion of assets allowing them to exit underperforming facilities and strengthen its metrics. OHI then deployed the $1.6 billion of capital toward asset purchases, construction, loans, and leverage-neutral stock buybacks. Over the past 32 months, OHI has worked diligently to face adversity head-on and maintained the ability to pay its large dividend quarterly. Mr. Pickett shared that OHI foresees 12-16 months of on-going COVID-related issues regarding its operators but is confident that OHI is in a solid position to return capital to its shareholders through its dividend and deploy growth capital throughout its portfolio.
OHI is still attractively valued and is an interesting income play in the Healthcare REIT space
I have been tracking OHI against its peer group in its price to Funds From Operations (FFO), EBITDA to Total Debt, and Dividend Yield for some time. OHI still looks attractive to me from these metrics. I will be using the following companies to compare OHI against:
OHI’s peer group trades at an 11.4x price-to-FFO ratio. When it comes to REITs, the price-to-FFO metric is my favorite comparison tool because I like to see what price I am paying for a REIT FFO. Since all dividends are paid from FFO, I want to make sure I am not overpaying for a REITs ability to produce FFO. OHI trades at a 11x price-to-FFO ratio indicating that it is slightly below the peer group average.
Steven Fiorillo, Seeking Alpha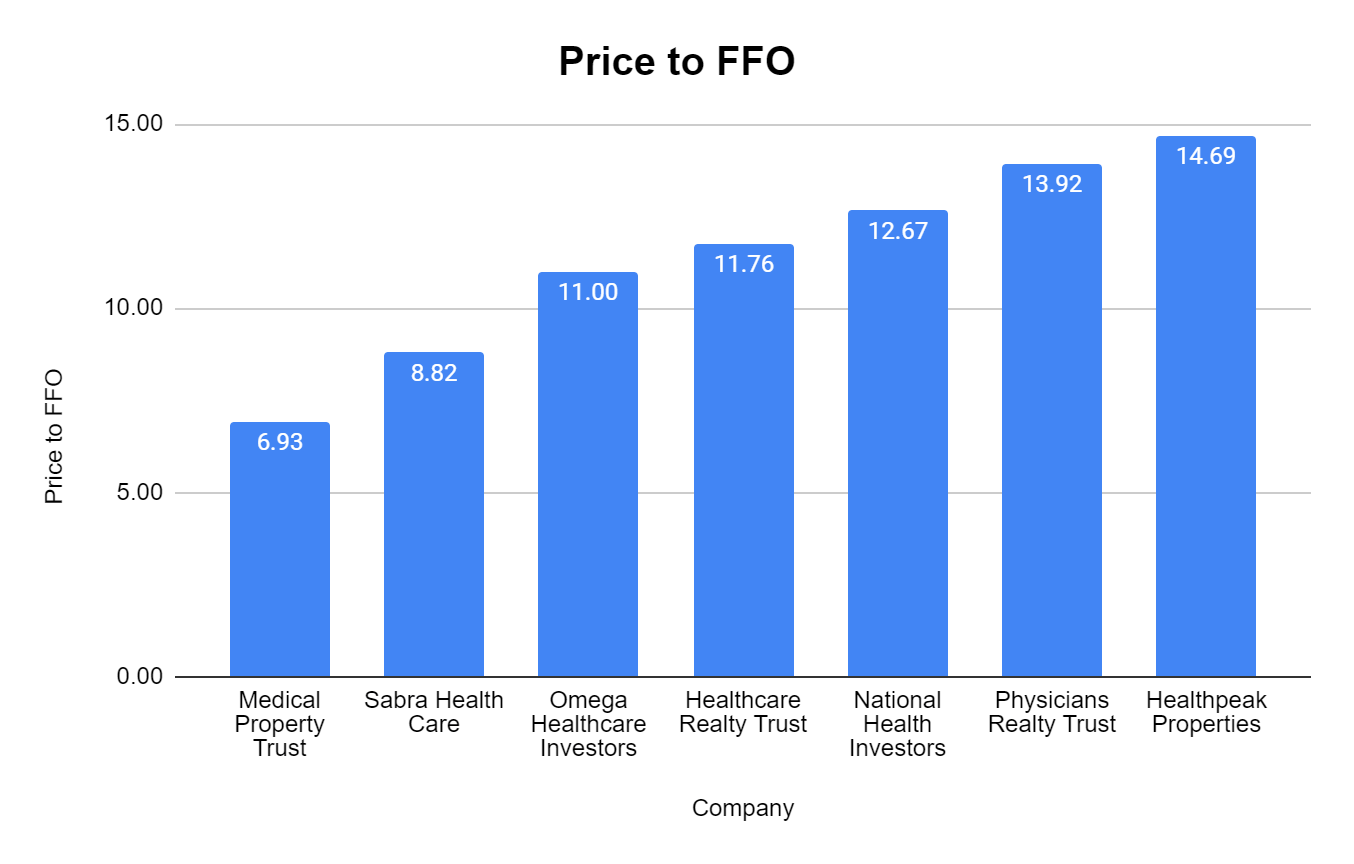
Looking at the EBITDA to Total Debt ratio, OHI looks to be in excellent condition. OHI trades at a 6.3x multiple of EBITDA to total debt which indicates that OHI can eliminate all its debt with 6.3 years of its EBITDA. The peer group average is 7.9 years, and OHI has the 2nd lowest multiple.
Steven Fiorillo, Seeking Alpha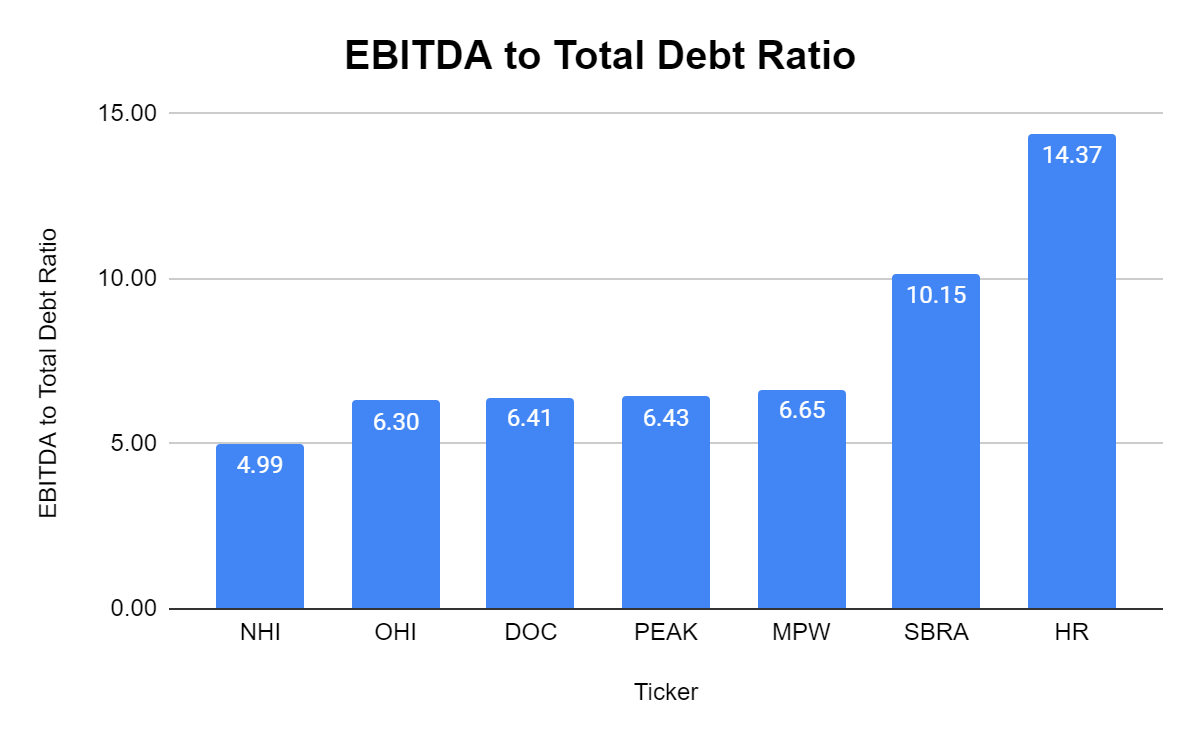
REITs are ultimately income investments for me, so the dividend yield and FFO payout ratio are important. OHI has a dividend yield of 8.32%, which is significantly above the peer group average of 7.14%. This is also well above what you could get on a 1-year CD or treasury. Being in the high single-digit range is a plus, and for me, it makes the volatility worth it. OHI also generates $2.93 of FFO per share and pays $2.68 for its dividend, which gives it a 109.33% FFO coverage ratio.
Steven Fiorillo, Seeking Alpha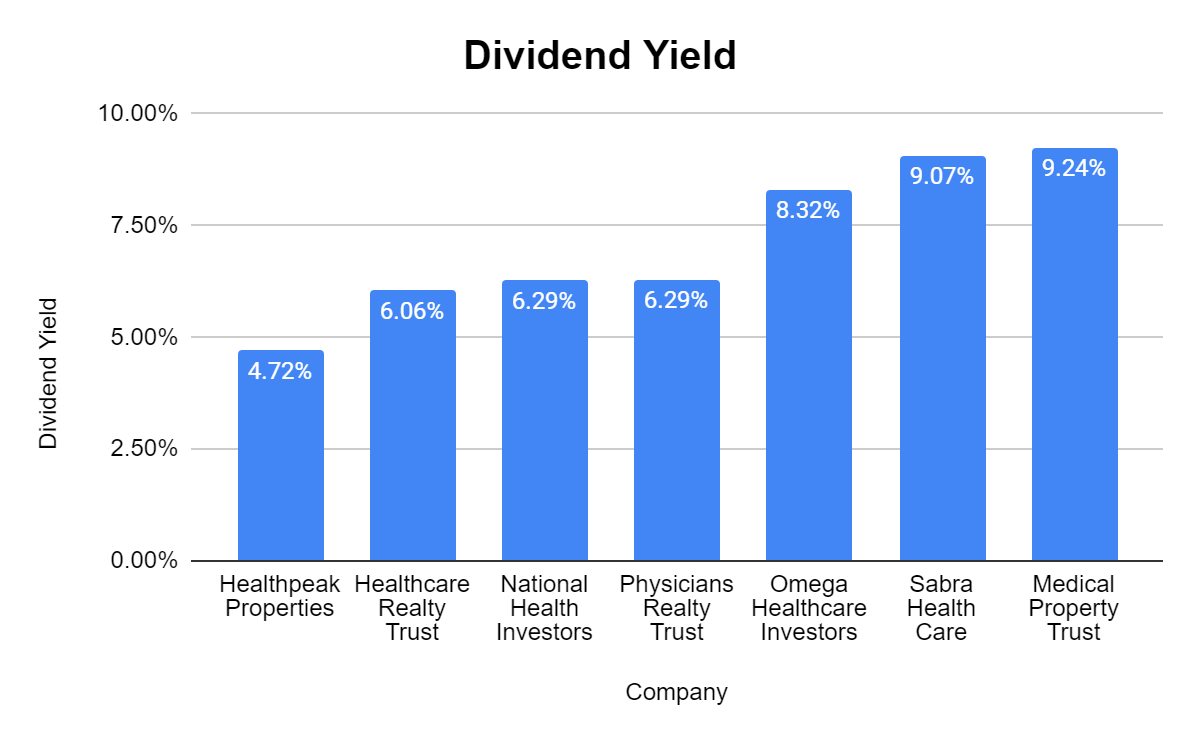
Conclusion
I have been a shareholder in OHI for just over 5 years, and over this period, its share price has fluctuated, but its dividend has been paid like clockwork. The Q3 conference call reinforced my confidence in OHI’s ability to generate enough FFO to continue paying its dividend without the fear of it being cut or reduced. I think OHI is still attractively valued compared to its peers considering its yield exceeds 8%. I plan on holding OHI for a very long time and reinvesting the dividends along the way. Over the next 12-18 months, I wouldn’t be surprised if OHI closes in on its pre-pandemic highs as ramifications from the pandemic are worked out throughout its portfolio on an operator basis.
Be the first to comment