4kodiak/iStock Unreleased via Getty Images
Charts created by writer from C Trader.
I read yesterday that the parents of Jeff Bezos skeptically loaned him $245,000 in the mid 1990’s to fund this visionary idea of creating the world’s largest internet marketplace at a time when a large proportion of human civilization didn’t even have a personal email address. Turns out this reported skeptical bet by Mr. and Mrs. Bezos was one of the biggest winners in history.
Before Amazon.com, Inc.’s (NASDAQ:AMZN) June stock split, this major equity was in a bearish three wave pattern that had initially topped out in its bullish structure at $3761 before creating a macro bearish wave one to $2661 which acted as support only to be broken through leading to a third wave target of $1572 if the wave three was to numerically copy wave one. What transpired was Amazon did hit the bearish Fibonacci 161 and land at the $2050 region. However, that is clearly in the past now and with Amazon announcing its 20 for 1 stock split in March of this year, the first since 1999 and fourth since the company went public in 1997, this major split completed in June and Amazon has since bottomed in its newly created price range at $101.43
Stock splits decrease a share price but increase outstanding shares and generally before making a decision on a stock split the company will have confidence that the business will continue to see strong performance. Studies have shown that companies that opt for a stick split see just that in the short term anyway.
Now we can move to the monthly chart to identify what macro wave patterns Amazon has been forming since its recent low at $101.
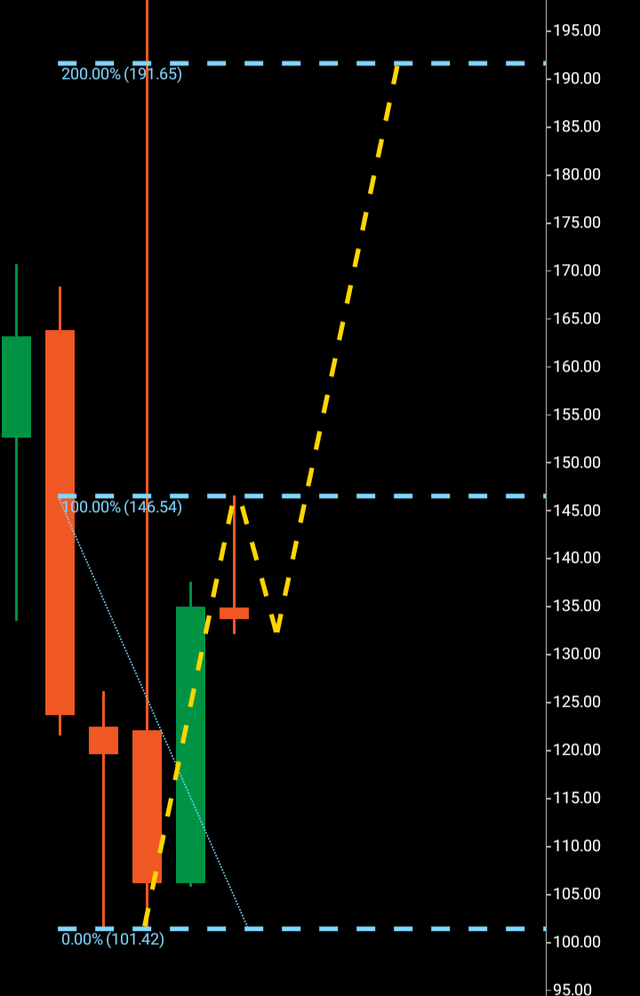
We can see a large monthly bullish candle that spans the majority of the perceived wave one $101-146. Normally I would prefer to see a large wick on the bottom of a wave one candle however there is wick action on the weekly candles which will suffice. Wick action on bottoms or tops of candles are imperative as they represent real buying and selling action and are a key factor to a price being driven higher.
When we move to the perceived wave two, we can see just that. A rejection from the $146 region is technically primed for beating. If this bearish rejection candle is to be beaten and a third wave is to break out upwards there are a couple of ways this could happen. Firstly, next month’s candle may open and chose not to retrace lower but to look to drive price higher immediately staying within the wave two confines of $130-$146.
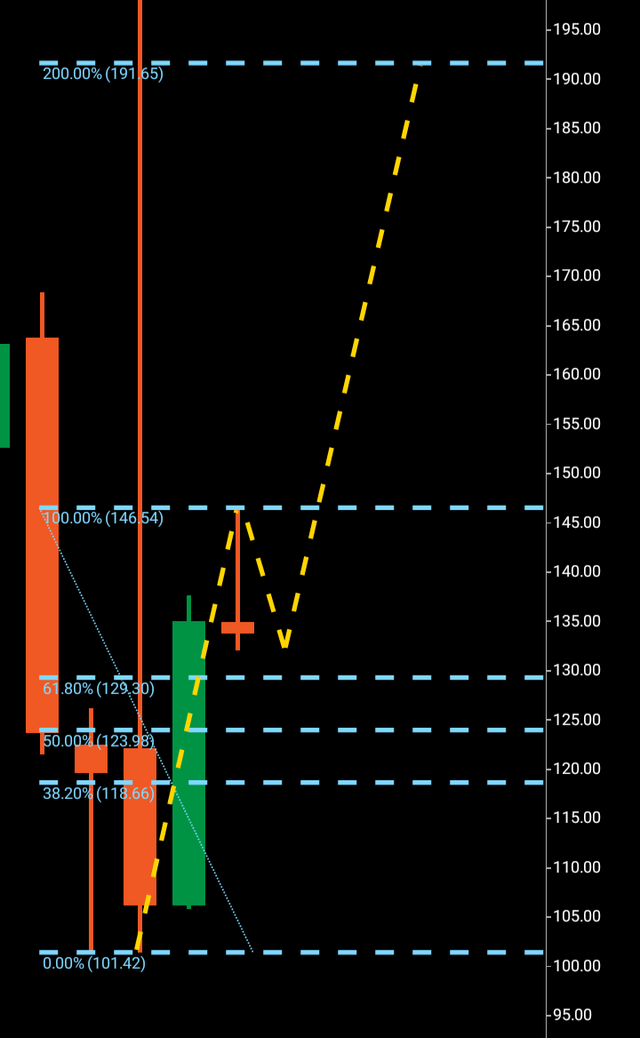
The second way it could look to complete the wave two is by retracing deeper into the wave one perhaps finding a Fibonacci level that it is comfortable turning around at before forming the third wave that drives price above the rejection $146.
Above we can see the Fibonacci levels that could potentially see a retrace to before Amazon chooses to break out above $146.
There is also the alternative that Amazon’s share price has greater numerical plans and this candle chooses to complete this month in a bullish structure that is not a rejection, signaling that Amazon’s wave one will grow larger before it finds rejection.
As of now there is a potential macro wave one and two formed with a third wave target of $191 should this wave one two pattern hold and a third wave form to push price above it. I would expect Amazon to push higher however it chooses to form the wave pattern, and if this formation holds and the third wave does break out, we could see $191 in the next 90-120 days.
About the Three Wave Theory
The three wave theory was designed to be able to identify exact probable price action of a financial instrument. A financial market cannot navigate its way significantly higher or lower without making waves. Waves are essentially a mismatch between buyers and sellers and print a picture of a probable direction and target for a financial instrument. When waves one and two have been formed, it is the point of higher high/lower low that gives the technical indication of the future direction. A wave one will continue from a low to a high point before it finds significant enough rejection to then form the wave two. When a third wave breaks into a higher high/lower low the only probable numerical target bearing available on a financial chart is the equivalent of the wave one low to high point. It is highly probable that the wave three will look to numerically replicate wave one before it makes its future directional decision. It may continue past its third wave target but it is only the wave one evidence that a price was able to continue before rejection that is available to look to as a probable target for a third wave.


Be the first to comment