

PonyWang/E+ via Getty Images
Business Description
NVIDIA Corporation (NASDAQ:NVDA) is a US based multinational technology company. It is thought that NVIDIA is the technology leader in the design of graphics processing units (GPUs). These semiconductor chips are used in several end-markets including high-end PCs for gaming, data centers, mobile computing and auto infotainment systems. Over the last few years, the company has been expanding its markets into artificial intelligence and autonomous vehicles. NVIDIA is the 2nd largest semiconductor company globally by market capitalization behind Taiwan Semiconductor Manufacturing Company (TSM).
NVIDIA purely designs, markets and sells its products. It does not directly manufacture semiconductors. It operates a so-called “fabless” model where it contracts 3rd parties to perform the various manufacturing steps to get its products to market. The key step of manufacturing the semiconductor wafers is performed both by Taiwan Semiconductor Manufacturing Company (TSMC) and Samsung Electronics (OTC:SSNLF) (OTC:SSNNF).
At the time of writing this report, NVIDIA had a market capitalization of US$465B, which makes it the 10th largest company on the S&P 500.
NVIDIA’s key markets include gaming, professional visualization, data centre and automotive.
The company currently has 2 reportable operating segments and the 2021 full year sales and margins are shown in the table below:
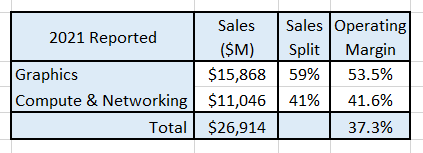
Source: Author’s compilation using data from NVIDIA’s 2022 10-K filing.
Global Semiconductor Market Size
Global demand for semiconductors has been in a long-term secular upswing as shown by the following chart:
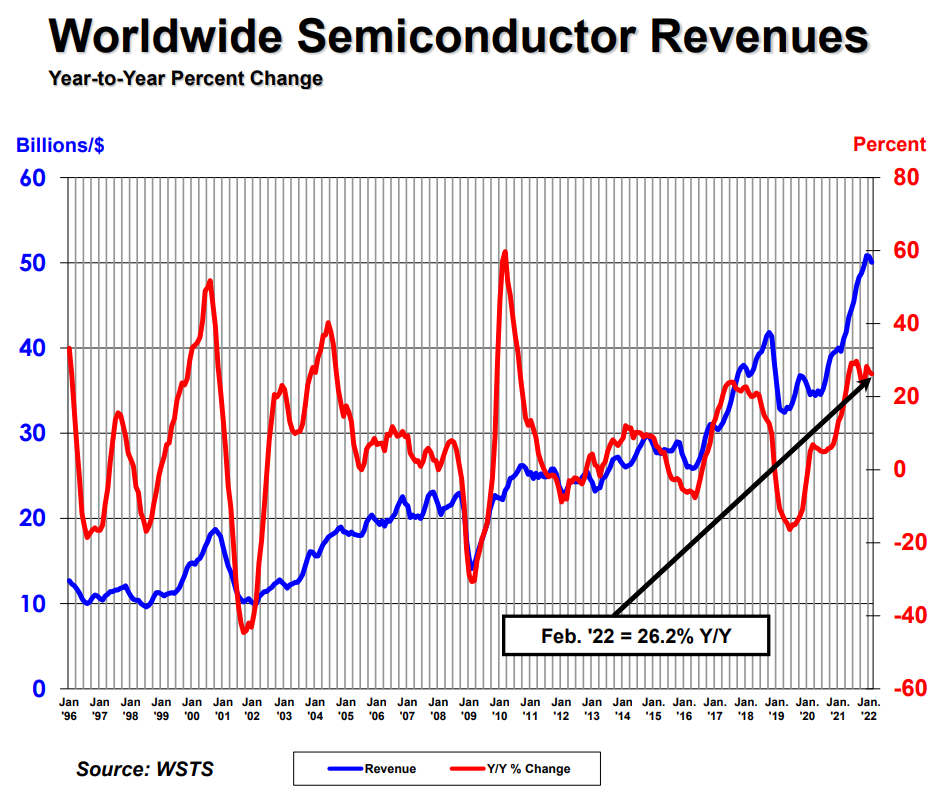
Source: World Semiconductor Trade Statistics
The World Semiconductor Trade Statistics (WSTS) estimates that the global market had approximate revenues of US$556B in 2021. This represents a year-on-year growth of 26% whilst noting that the 2020 growth rate was negatively impacted by COVID-19.
Although there has been secular demand growth for many years, the chart also shows that the sector can go through sharp cyclical downturns.
Forecast Segment Growth Rates
Global consulting company McKinsey is projecting that the global semiconductor industry will achieve one trillion dollars of revenues by 2030 with a compound annual growth rate of between 6% and 8%.
McKinsey is projecting that 70% of the forecast demand will be driven by the automotive, data storage and wireless industries as seen in the following chart:
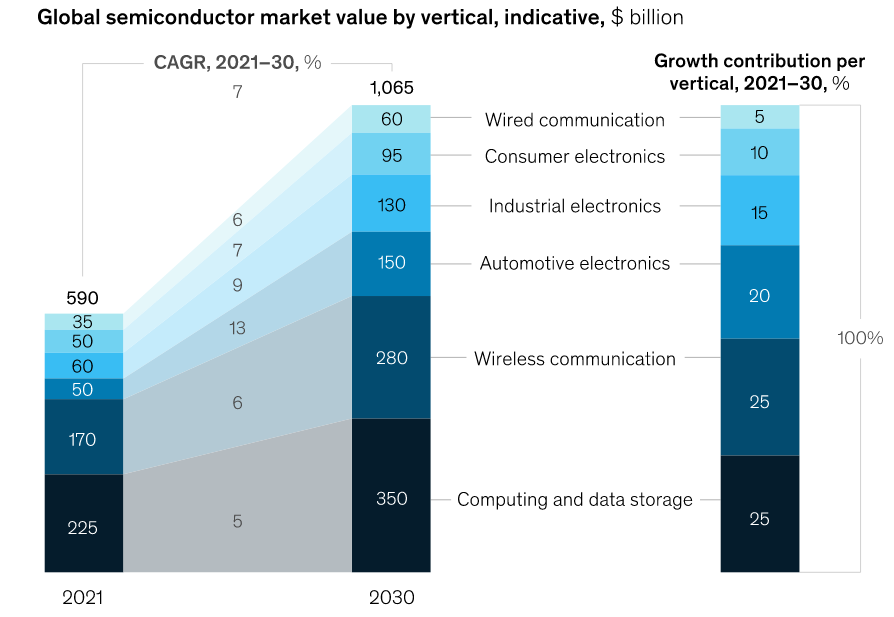
Source: McKinsey & Company, The Semiconductor Decade: A Trillion Dollar Industry, April 2022.
The key end use demand for semiconductors will come from:
- The Auto segment due to the growth in electric drivetrains as more new cars are converted from internal combustion engines to electric.
- Artificial Intelligence (AI) and cloud computing in the Computing and Data Storage markets.
- The Wireless Communication market as the continued demand for smart phones in the developing world along with the conversion to 5G in the developed markets.
Graphics Processor Unit Market Size
The GPU market is a subset of the semiconductor market. According to Advanced Micro Devices (AMD), its current addressable market is about $79B in size as shown by the following chart:
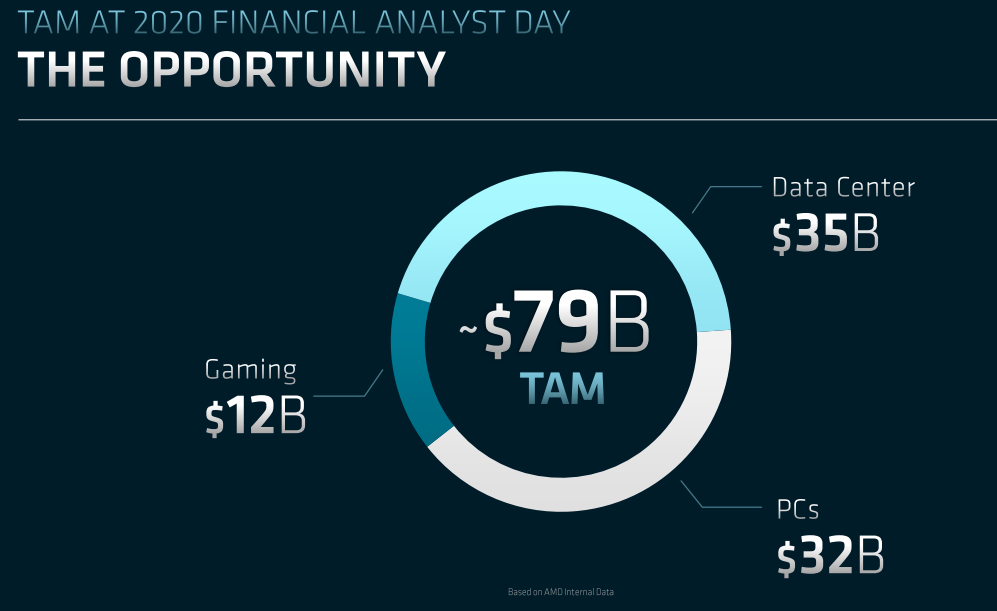
Source: AMD’s Analyst Day presentation, June 2022.
This estimate is quite similar to Intel’s (INTC) estimate which was disclosed at its Investors’ Day meeting (February 2022).
One of the more contentious issues in the current GPU market is how much of the total demand is being driven by cryptocurrency miners? GPUs are very popular amongst crypto miners (particularly Ethereum (ETH-USD)). NVIDIA’s management is reluctant to disclose what proportion of its GPU sales are to the crypto market and has recently been fined $5.5M by the SEC for failing to adequately inform investors about its crypto market revenues going back to 2018.
AMD believes that its total addressable market (TAM) can grow to $300B by the end of 2027 as shown in the following slide:
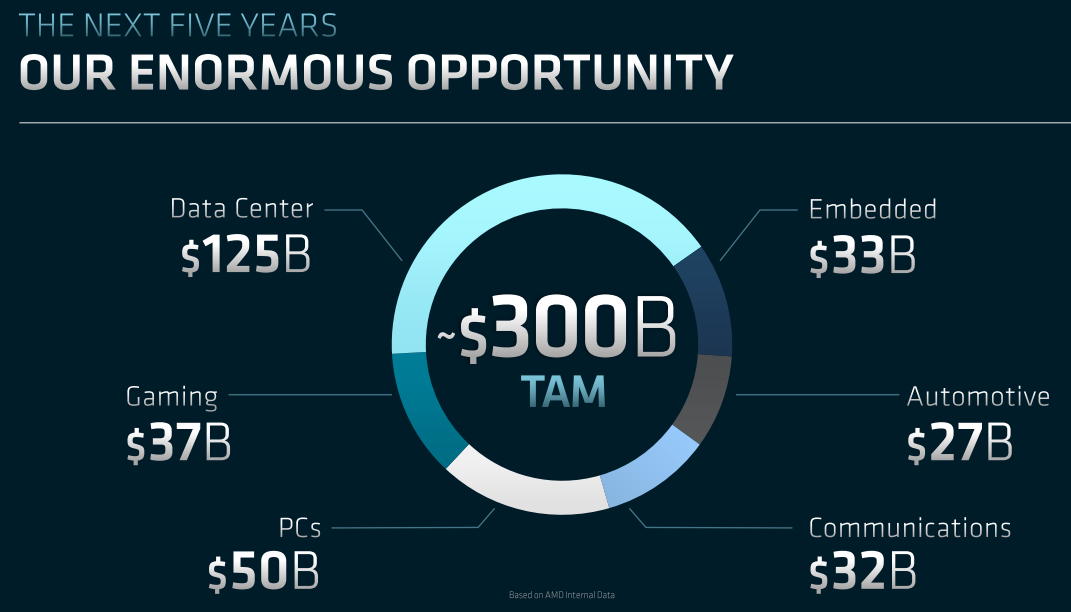
Source: AMD’s Analyst Day presentation, June 2022.
AMD’s TAM estimate is almost 40% higher than Intel’s estimate. It is not easy to line each of the estimates up in order to determine where the differences are (Intel has different names for the segments and some of the segments overlap). At the aggregate level, Intel believes that revenues will grow by 16% per year for the next 5 years whilst AMD believes that up to 30% compound growth is possible.
NVIDIA’s estimate of its future TAM is larger again at US$1 Trillion and hence its view of the potential growth is also much larger.
NVIDIA’s Strategy
NVIDIA built its business by developing the best graphics processing units predominantly used by the PC-based gaming market and then expanding its application into other markets. At the core of NVIDIA’s strategy is the focus on product innovation through research and development.
NVIDIA’s reinvestment (a combination of R&D expenditure and capital spending) into its business is shown in the following chart:
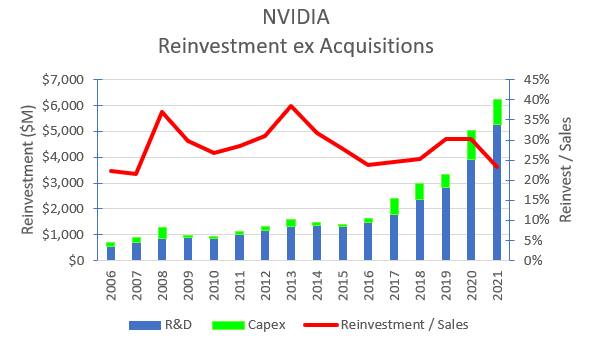
Source: Author’s compilation using data from NVIDIA’s 10-K filings.
NVIDIA has maintained an average Reinvestment to Sales ratio of 28% for the last 15 years.
NVIDIA has previously claimed that it was the market leader in “R&D intensity,” meaning that its R&D investment to Sales ratio was the highest amongst technology companies. At the end of 2021, this claim was no longer true as shown in the following table:
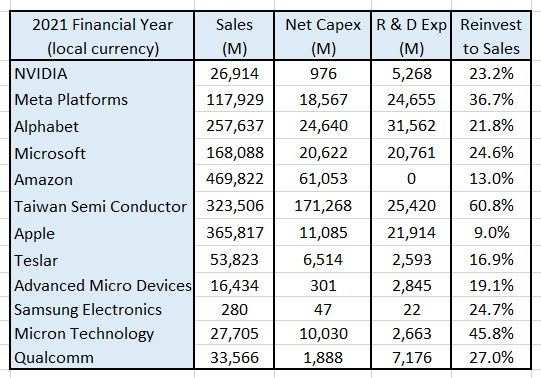
Source: Author’s compilation using data from GuruFocus.
The table was constructed by classifying reinvestment as the sum of expensed Research & Development plus net capital expenditure for the last financial year.
Although NVIDIA is no longer the leader in R & D intensity there are no signs either that it is significantly cutting back its reinvestment spending.
The output of NVIDIA’s research and development has been several hundred patents which have been used to develop new markets for its innovations. NVIDIA has focused on products where it can deliver dramatically improved performance relative to its competitors. This has enabled NVIDIA to expand from the relatively mature gaming and visualization markets into the expected higher growth / high performance computing markets such as Data Centers and Automotive which have a growing focus on AI.
The success of NVIDIA’s approach can be seen in the following chart which shows the company’s historical revenues by end market:
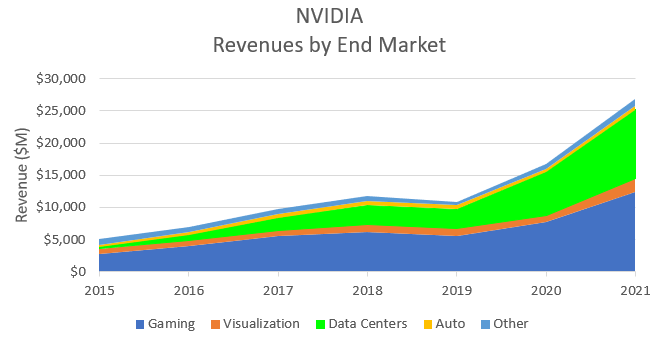
Source: Author’s compilation from NVIDIA’s 10-K filings.
It should be noted that NVIDIA’s Data Center revenue growth has increased significantly as a result of the inclusion of revenues from Mellanox Technologies which was acquired in April 2020 (annualised revenue of approximately $1,600 M).
The release of the GeForce RTX30 product in the 3rd quarter of calendar 2020 led to a step change in Gaming revenues.
At the end of 2021, for the first time, Data Center revenues exceeded Gaming revenues. This marks an important strategic evolution for NVIDIA as the company starts to focus on its next growth phase.
NVIDIA’s focus on Artificial Intelligence will drive its future strategy
NVIDIA’s strategy is to dominate the AI market. The opportunity presented by AI will enable the company to transition from being a GPU chip designing business to an AI hardware and software business.
NVIDIA has created a full suite of AI products which includes hardware, software (or operating system) and AI implementation skills (consulting).
This strategy transition is depicted in the following chart:
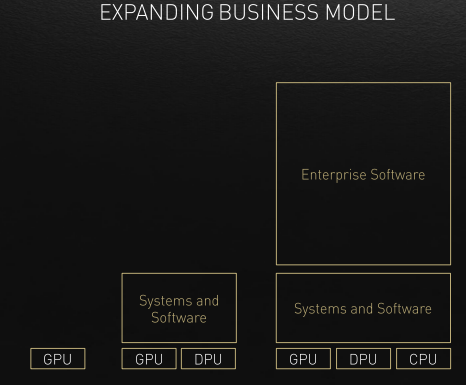
Source: NVIDIA’s Investor Day presentation, March 2022.
In the new business model, software becomes the biggest long-term opportunity because it represents multiples of hardware revenues. Software revenues are more “sticky” than one-off hardware revenues as they include annual licenses and subscriptions. This will also allow the potential expansion of margins (particularly gross margins) as software margins are typically much higher than hardware margins.
New strategy comes with a new total addressable market
As a result of the evolving business strategy, NVIDIA has developed a new total addressable market estimate. This is shown in the following table:
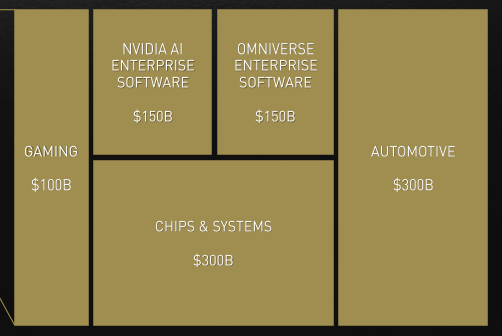
Source: NVIDIA’s Investor Day presentation, March 2022.
NVIDIA’s new TAM estimate of $1 Trillion has increased significantly from its previous estimate of $250 Billion. NVIDIA is clear to state that this is the size of its estimated market some years into the future and it is not the size of the market today.
I suspect that there is a reasonable amount of “blue sky” built into NVIDIA’s estimate particularly when compared to McKinsey’s sector growth estimates for the next 10 years.
Acquisitions have to date been a small component of NVIDIA’s growth
NVIDIA spent approximately US$8,500M on the Mellanox acquisition which has been its only material transaction in the last 10 years. Although in 2021 NVIDIA announced its intention to acquire Arm Limited, this transaction has since fallen through due to the negative market reaction (particularly from customers).
At this stage, I don’t foresee NVIDIA making any major acquisitions unless there is a significant plateauing in its revenue growth. In my opinion, there is not an insignificant probability that NVIDIA’s revenue growth may substantially decline whilst the company is forced to wait for its customer base to expand its market applications (particularly the Auto and the Internet of Things segments). This may prompt NVIDIA to once again dust off any potential acquisition plans it may have had in the past.
NVIDIA’s Historical Financial Performance
NVIDIA’s historical revenues and adjusted operating margins are shown in the chart below:
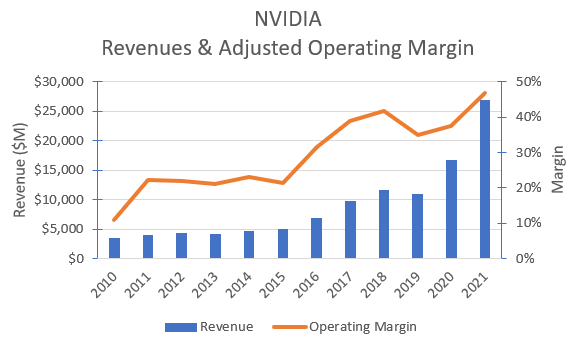
Source: Author’s compilation using data from NIVIDIA’s 10-K filings.
The operating margin has been adjusted for the impact of :
- One-off extraordinary expenses.
- Operating leases (converting the lease payments to debt and depreciation).
- Expensing of Research & Development (this expense has been converted back to a capital investment and a notional Research & Development asset was created with a 5-year expected life).
The chart shows that the last 2 years have been particularly good for NVIDIA. The Mellanox acquisition and the release of the GeForce RTX 30 product has significantly increased the company’s growth trajectory. I estimate that NVIDIA’s recent revenue growth is almost double the semiconductor sector average.
At the same time, NVIDIA’s adjusted operating margins have been expanding. I estimate that NVIDIA’s margins are in the highest decile for the sector.
NVIDIA’s Moat
My moat assessment for NVIDIA is shown on the following table:
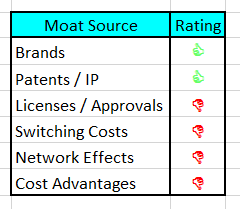
Source: Author’s compilation.
NVIDIA’s moat comes from its superior technology which is protected through numerous patents. Of course, it does not have the market all to itself. There are competitors who currently produce relatively inferior products in areas where performance is important. Although not necessarily a consumer brand, the NVIDIA brand is well regarded in the markets who value its products.
The strength of NVIDIA’s moat can be estimated by its return on invested capital which is shown in the chart below:
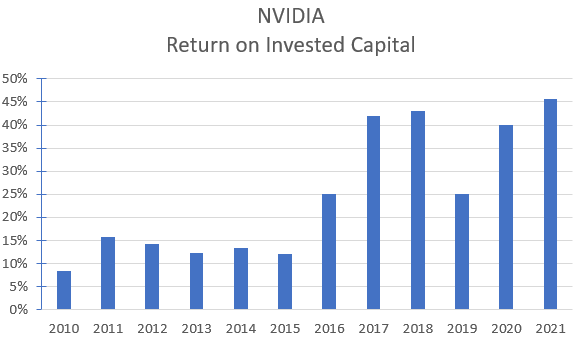
Source: Author’s compilation using data from NVIDIA’s 10-K filings.
It should be noted that NVIDIA pays a relatively low rate of effective tax on its income. Over the last 10 years, NVIDIA has paid an average effective tax rate of approximately 8% compared to Intel’s 21%. There are several reasons for this difference:
- NVIDIA has 67% of its sales outside of the US where tax rates are generally lower (or zero).
- NVIDIA gains significant tax benefits on its US R&D investments.
- NVIDIA is accruing a significant level of deferred tax benefits.
The low effective tax rate coupled to NVIDIA’s high operating margins (generated by its fabless model and the ability to generate higher prices for its products because of their superior performance) means that NVIDIA generates an extremely high return on invested capital. I estimate that the current return on invested capital is in the highest decile for the sector.
NVIDIA’s ROIC will decline significantly as its effective tax rate starts to rise. When the company’s rate of growth starts to decline, it is inevitable that the company will pay more tax over time and this will become a significant issue in the valuation of the company.
NVIDIA’s high and sustained return on invested capital is a clear indication that its moat is currently reasonably strong and should remain that way for some time, provided that its research and development continue to produce market-leading products and the company doesn’t over-pay for acquisitions.
NVIDIA’s Capital Structure
I have no significant concerns over NVIDIA’s current capital structure. The following chart shows the shift in the mix of its debt and equity over time:
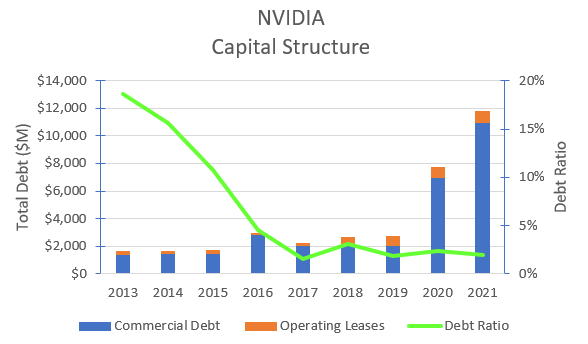
Source: Author’s compilation using data from NIVIDIA’s 10-K filings.
NVIDIA increased its debt significantly to fund the acquisition of Mellanox Technologies and it was increased again during 2021 (probably in anticipation of the Arm Limited acquisition).
With the Arm acquisition not proceeding, NVIDIA has deployed the additional debt raised during 2021 to buy back shares in the recently completed 1st quarter of this year. Almost $2,000 M was used to buy back stock during the quarter.
At the end of 2021, NVIDIA’s debt ratio was in the lowest quartile for companies in the semiconductor sector. The recent sharp decline in its share price has caused this ratio to increase towards the sector average, but at this stage there is no cause for concern given the size of NVIDIA’s free cash flows.
NVIDIA’s Cash Flows
The following table summarizes NVIDIA’s cash flows over the last 10 years:
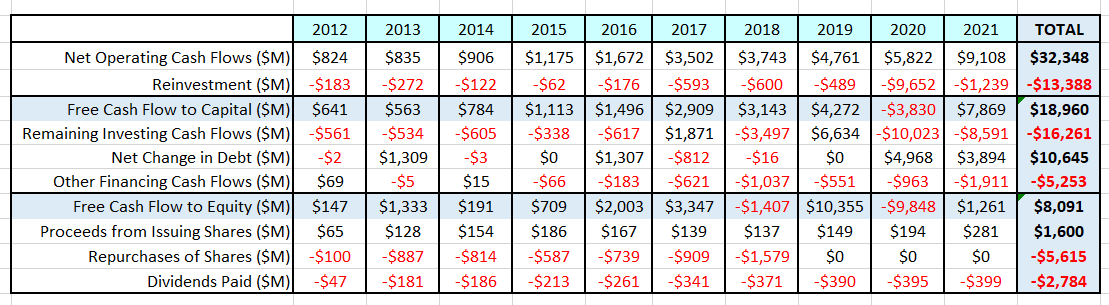
Source: Author’s compilation using data from NVIDIA’s 10-K filings.
In conjunction with the cash-flow table, it should be noted that NVIDIA has accumulated $21,208 M in cash and marketable securities. This is a potential source of cash for future acquisitions or for returning to shareholders over time.
As previously noted, NVIDIA raised debt in preparation for the acquisition of Arm Limited and when this transaction failed to complete, the additional debt has been used to partially fund a new round of share buybacks (which is not yet reflected in the table).
Prior to the acquisition of Mellanox Technologies, NVIDIA regularly used its excess cash to fund share buybacks. If there are to be no significant acquisitions in the future, then I see no reason for a regular buyback not to be reintroduced.
Recent Share Price Action
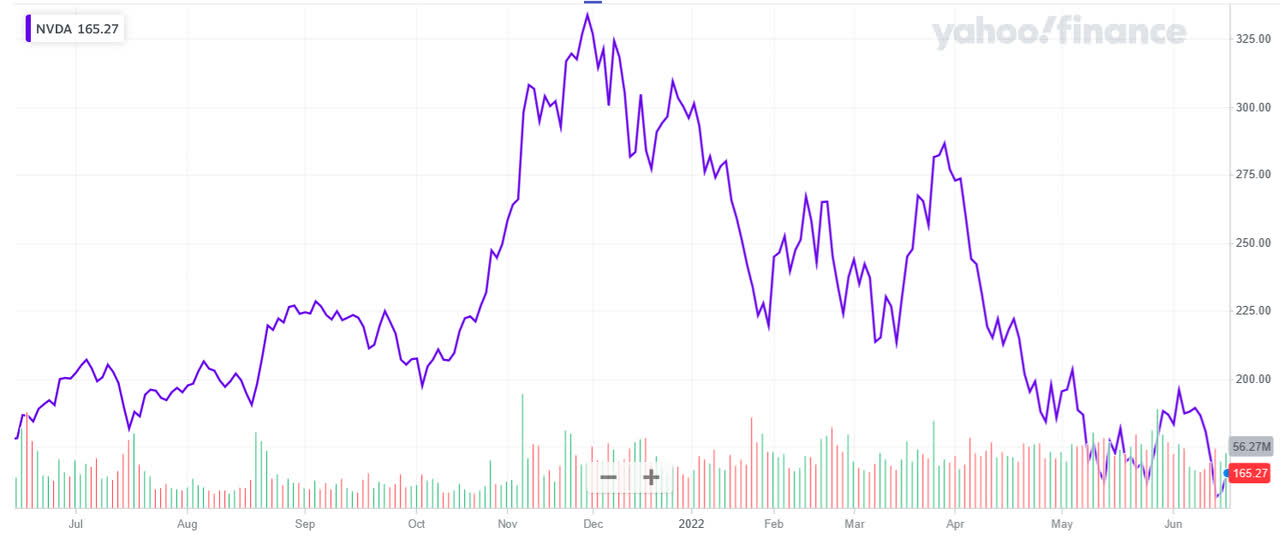
Source: Yahoo Finance
The price action shows that NVIDIA’s share price has been on a wild ride over the last 12 months. Investors have seen the share price decline by over 50% from the price peak in November 2021.
Historical Returns
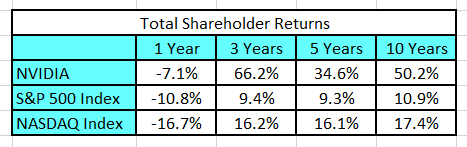
Source: Author’s compilation using data from Yahoo Finance
The data indicates that although NVIDIA’s shareholders have not done very well over the last year (but significantly better than the index). Notwithstanding this, the stock has been a wonderful investment for more than 10 years. It has outperformed the market by a wide margin.
Key Risks Facing NVIDIA
I see four key long-term risks facing NVIDIA:
- NVIDIA’s research and development investments fail to sustain its technology leadership which would allow competitors to gain a larger share of the market.
- US / China trade war – approximately 26% of NVIDIA’s revenues come from the Chinese market. A long-term dispute between China and the US would have a significant near-term impact on revenues until new non-Chinese supply chains were established.
- NVIDIA’s “fabless” operating model exposes the company to several supply chain risks including margin compression and potential production capacity constraints. NVIDIA is very dependent upon good relationships with its two major suppliers, Taiwan Semiconductor and Samsung. The geopolitical tensions between China and Taiwan are a major concern.
- New competitors will be attracted to this market given the exceptional levels of growth which are expected. This will place pressure on volumes, but more particularly on margins.
My Investment Thesis for NVIDIA
I last valued NVIDIA just over a year ago. At that time, my investment scenario had two distinct phases as the impact of the Mellanox Technologies acquisition was yet to be “washed” through the near-term revenue projections. I am now assuming that the one-off impacts of the Mellanox acquisition are complete.
My scenario for NVIDIA involves the company completing the transition from being a gaming and data center GPU technology supplier to becoming an AI / business enterprise software technology supplier.
There is ample evidence that NVIDIA has commenced this transition – we can see it in the year-on-year expansion of its reported gross margins. Software gross margins are typically much higher than semiconductor gross margins (I estimate that median sector gross margins are 60% for enterprise software and 43% for semiconductors).
Based on NVIDIA’s current end-use definitions, the following table summarizes my revenue projections for each segment in 10 years’ time. I have also included my estimate for the segment’s growth rate for the next 6 years:
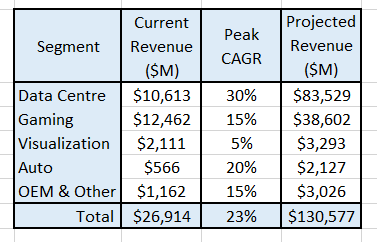
Source: Author’s model.
NVIDIA’s current reported gross margins are 64.9%, which is exceptionally high for a business which is predominantly hardware. In the near term, there is potentially room to further expand the gross margin as the product mix shifts more to software services, but it should be noted that NVIDIA’s current gross margin is already above the median gross margin for the application software sector.
Reported operating margins are a different matter. Typical application software operating margins are much lower than hardware (median sector margins are 8% versus 21%). There are several reasons for this – the software sector expenses a higher level of R&D compared to the semiconductor sector and there is a higher proportion of younger, loss-making software companies compared to the hardware sector.
I estimate that NVIDIA’s reported operating margins are in the highest decile of the semiconductor sector which reflects the relative high prices that NVIDIA can command from its customers. NVIDIA’s pricing power over time will inevitably decline as a result of increasing competition and through the natural tension between NVIDIA and its foundry suppliers (particularly during times of capacity constraint).
I expect that NVIDIA’s adjusted operating margins over time will decline from the sector’s highest decile to the 75th percentile over the long run – thus reflecting its strong market position.
I have not modelled any major interruptions to the foundry market, but I suspect that the political tensions between China and Taiwan may increase over time. If this impacted the output of Taiwan Semiconductor Manufacturing Company, it would have major ramifications for NVIDIA.
By traditional measures, NVIDIA appears to require relatively little reinvestment to generate its revenues. This is because NVIDIA’s largest reinvestment, research and development, is expensed. Once we reorganize NVIDIA’s financial statements to better reflect research and development as an investment, then we get a clearer picture of the level of reinvestment that is required to support this business. To support NVIDIA’s strategy, I expect that current reinvestment levels will have to be maintained into the future.
Key Inputs into NVIDIA’s Valuation
- I expect revenues to grow by 22% ± 5% for the next 6 years before growth begins to decline to GDP (3.2%) at the end of year 10.
- Operating Margins (which have been adjusted for the impact of operating lease expenses as well as research and development expenses) are expected to be in a range of 35% ± 5% into perpetuity.
- Capital productivity (as represented by Δ Sales / Adjusted Net Capital) will be maintained at 1.0 ± 0.2 over the life of the valuation.
- The current Return on Invested Operating Capital (around 45%) will decline over time before settling at 12% ± 1% in perpetuity. This will be above the cost of capital and reflects the long-term strength of NVIDIA’s moat.
- I assume that the long-term tax rate for the company will gradually increase over time and will settle at 21% which reflects the current US marginal tax rate.
- I have used the Capital Asset Pricing Model (CAPM) to estimate the current cost of capital to be 9.7% (it is currently heavily influenced by the elevated implied equity risk premium associated with the recent equity market volatility as well as the company’s relatively low debt load). I expect that the mature cost of capital will be 8.0% ± 0.5%. The lower cost of capital reflects a long-run lower implied equity risk premium and a higher mature company debt load.
- I have used the company’s stated value of $1,308 M for the outstanding management options.
- I have generated a market value for NVIDIA’s equity investments using a Price to Book ratio of 3.49 (based on my estimate of the Sector’s current average).
Discounted Cash Flow Valuation
The output from my DCF model is:
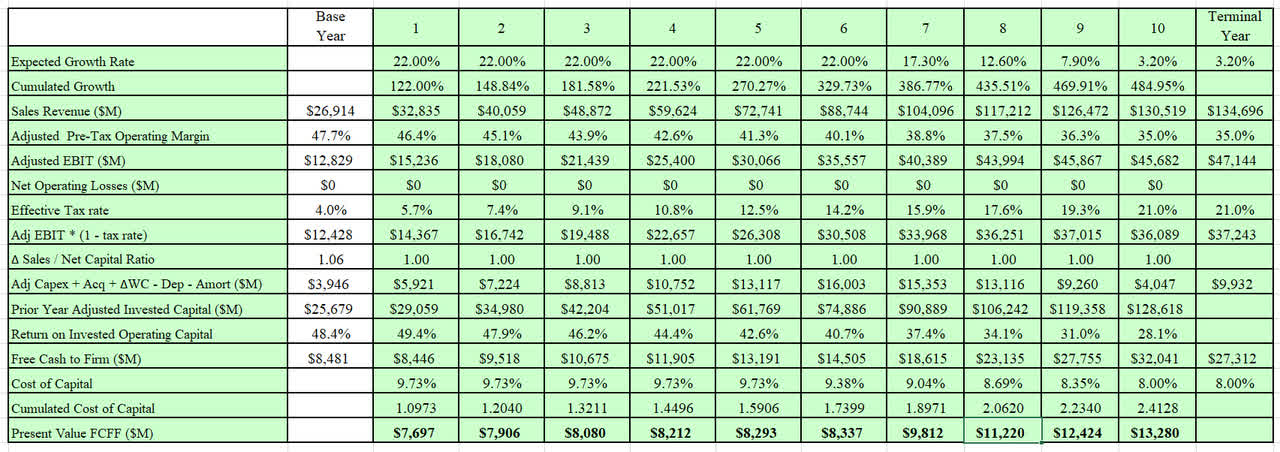
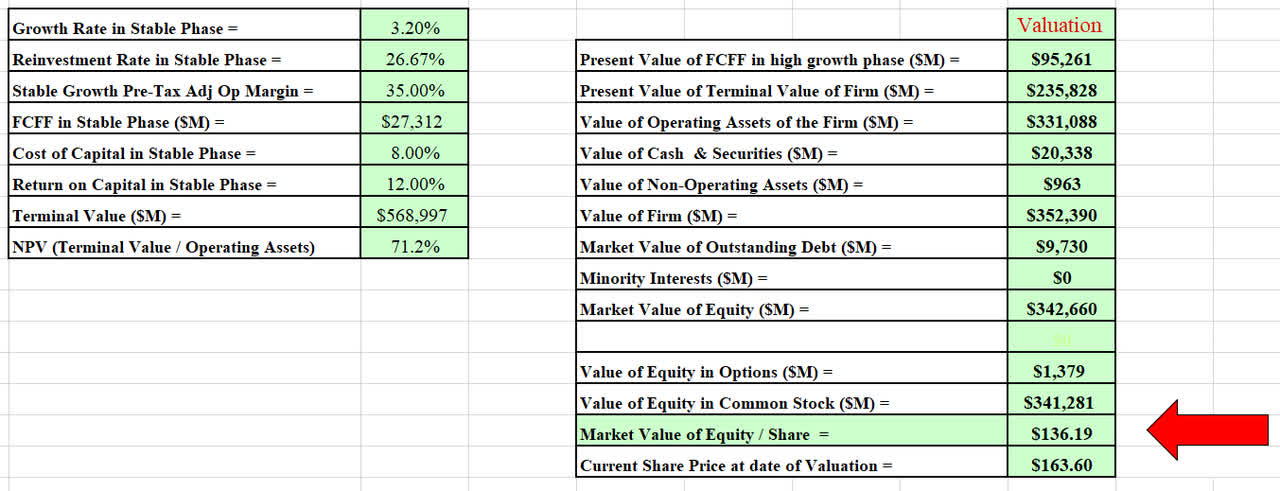
Source: Author’s model
I have also developed a Monte Carlo simulation for the valuation based on the range of inputs for the valuation. The output of the simulation was developed after 100,000 iterations.
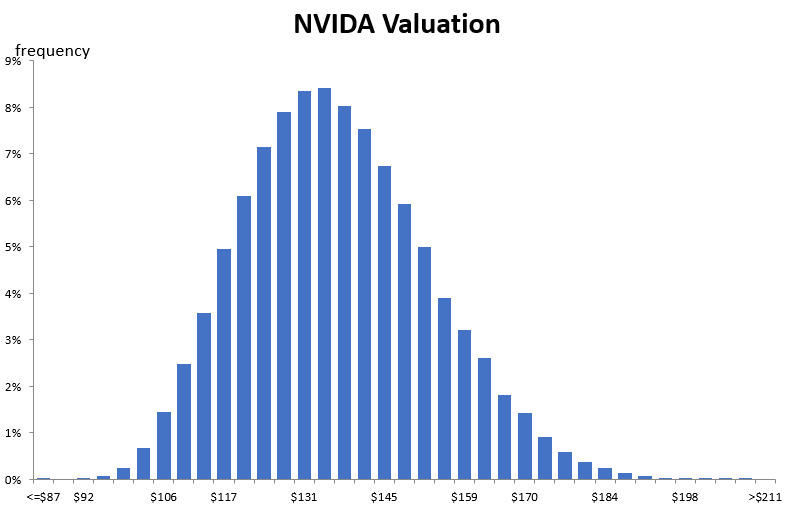
Source: Author’s model.
The Monte Carlo simulation not only indicates the extremes of the valuation, but it can be used to help understand the major sources of sensitivity:
- 69% comes from the revenue growth rate.
- 20% comes from the stable phase operating margin.
The simulation demonstrates that the key value driver in NVIDIA’s valuation is the forecast revenue growth and this represents the greatest source of risk in the valuation.
The simulation indicates that at a long-term discount rate of 8%, the valuation for NVIDIA’s equity per share is between $86 and $211 per share with an expected value of $137.
If my scenario was to play out, this would indicate that NVIDIA is currently expensive.
Inputs Required to Justify Current Market Price
To test what inputs would be required to justify NVIDIA’s current market price ($163), I have constructed the following table which shows the resulting valuation if either the terminal adjusted operating margin or the expected sales growth were changed:
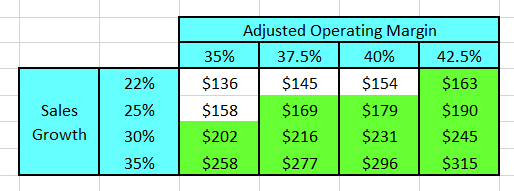
Source: Author’s model.
The table indicates that to justify the current share price, NVIDIA’s sales growth for the next 6 years must be greater than 25% compounding and the adjusted operating margin must be at least 35% in perpetuity.
Given that NVIDIA’s adjusted operating margin is currently 48%, I think that it is possible that margins could remain above 35% particularly if NVIDIA can sustain its technical superiority.
Now thinking about NVIDIA’s sales forecast. I have currently projected that NVIDIA’s sales growth will be between 17% to 27% for the next 6 years. Again, I think that this is possible, but there is a higher likelihood that NVIDIA does not achieve both extraordinary growth and sector-leading margins over the long term.
For these reasons, I conclude that NVIDIA currently appears to be expensive relative to its intrinsic value; but as my valuation curve demonstrates, there is not an insignificant probability that NVIDIA is currently fairly valued.
Is NVIDIA a Tier 1 investment?
For each company that I value I also assess what role this company could potentially play in my portfolio. The cornerstone of my portfolio is what I term “Tier 1” companies. These are the companies that I hold for the long term and where I invest most of my cash.
My high-level assessment for NVIDIA is:
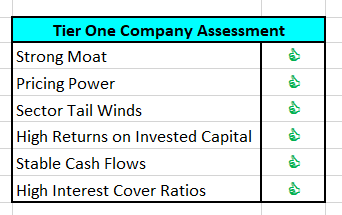
Source: Author’s assessment.
NVIDIA currently ticks all my boxes and is an excellent company. It is clearly a Tier 1 company and at the right price it would be an excellent addition to anyone’s portfolio.
Is NVIDIA currently a buy, hold or sell?
NVIDIA appears to be expensive at the current market price and I would not recommend purchasing the stock at these prices. I think that NVIDIA is currently a HOLD.
For investors who have ridden the stock from its record high price, I would advise to hold from here. You have missed the opportunity to take some profits. But it should be noted that although NVIDIA’s share price has already declined 50% from its all-time high price of $346 (after adjusting for stock splits), I would not be surprised if the price continued lower given the current general market weakness.
I am a believer in the NVIDIA story and so my investing plan for the stock currently involves using long dated at-the-money bull call spread options (LEAPS). My advice to investors is to be patient and wait for a price closer to my estimate of the intrinsic value before buying the underlying equity but if you feel the necessity to participate immediately, then use options. This is a reasonable way to invest in the company without committing significant amounts of capital in an uncertain investing environment.
Best wishes.
Be the first to comment