

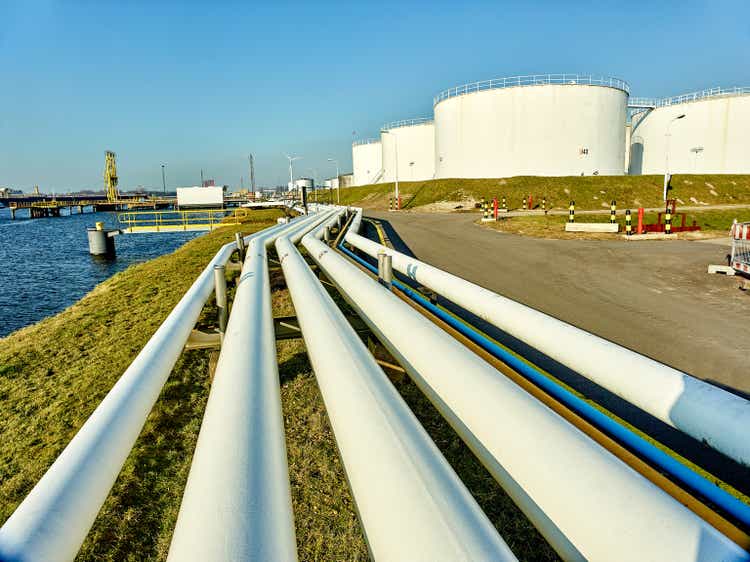
the-lightwriter/iStock via Getty Images
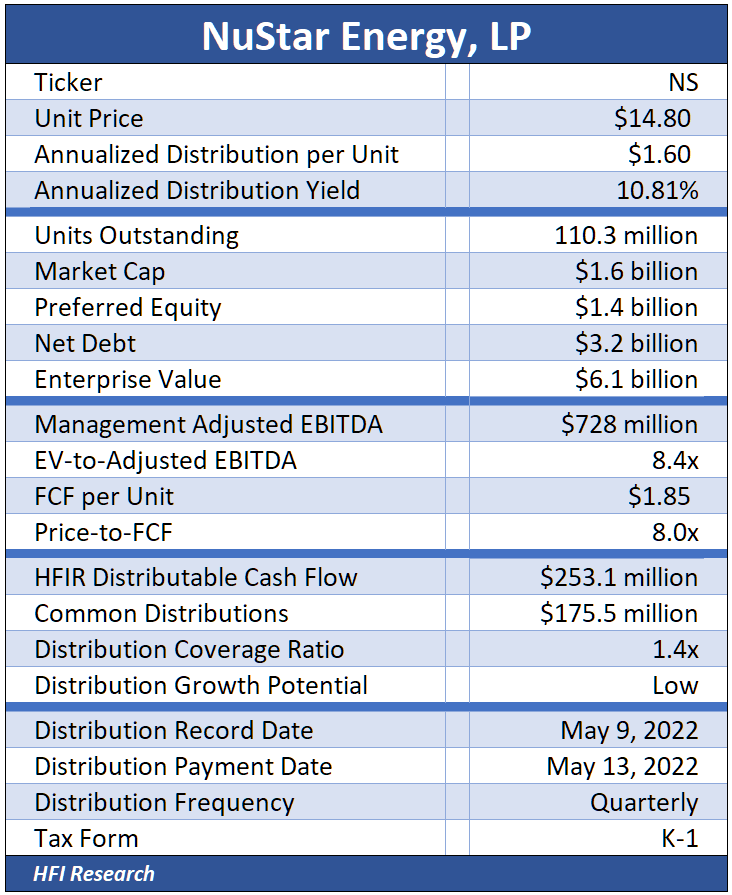
HFI Research
NuStar Energy L.P. (NYSE:NS) common units currently yield 10.8%, one of the higher yields among midstream equities. The units’ market price reflects the reality that the company is overleveraged and barely covers its distributions after capital expenditures. We have been critical of NS management for overspending, recurring impairment charges, distribution cuts, and other capital allocation moves that have put equity value at risk.
But for all managements’ faults as capital allocators, they have focused the company’s operations on high-quality assets, much to their credit. NS’s crude and refined products pipeline systems, storage facilities, growing Permian gathering and processing (G&P) system, and south Texas assets like its Corpus Christi export hub earn good returns and generate substantial cash flow. NS’s assets are shown in the map below.
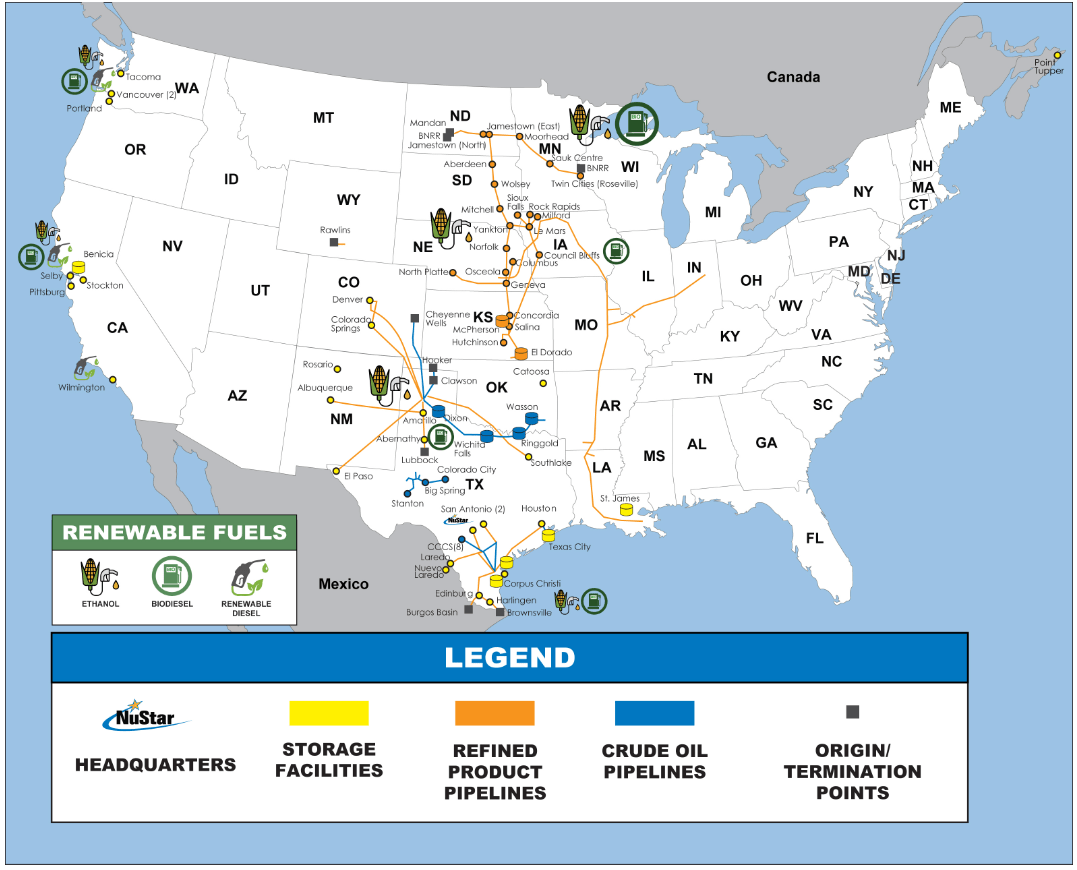
NuStar Energy (NS 2021 10-K)
If NS can successfully de-lever over the next few years, it may emerge from this period with the same high-quality assets, but also with comfortable common distribution coverage and attractive distribution growth prospects. Since the units are priced today as if the company will remain overleveraged, any sustainable positive change in its financial position can send its units much higher.
We see two fundamental catalysts we believe are likely to increase free cash flow, reduce leverage, and increase the unit price.
NS’s First Catalyst: Reduced Growth Capex
First, management has demonstrated it is serious about reining in growth capital expenditures. Today’s reduced growth capex will increase NS’s tiny cash flow surplus.
NS became overleveraged after its acquisition of Navigator Energy Services in May 2017, through which it acquired its Permian assets. To fund the acquisition, NS issued $550 million of debt, $539 million of preferred units, and $644 million of common equity. The acquired assets also saddled NS with significant capital spending obligations to grow its Permian G&P system. NS’s Permian system capital expenditures remained high as it constructed a mainline system in 2018 and 2019 and grew systemwide capacity from 220,000 barrels per day ((bpd)) in 2017 to 700,000 bpd in 2021. The growth was necessary to accommodate the system’s higher-than-average throughput growth, as shown in the chart below.
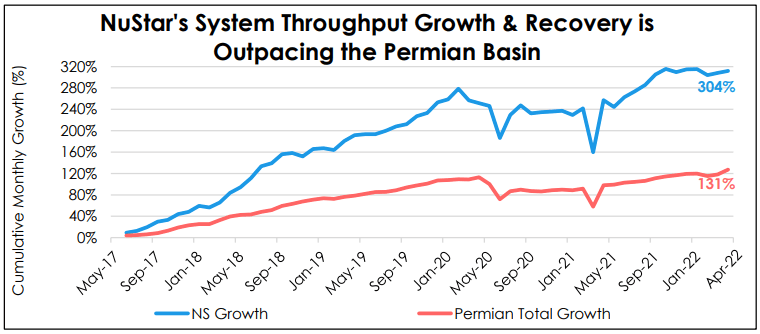
NuStar Energy (NS 2022 Energy Infrastructure Investor Conference Presentation, May 16, 2022.)
Aside from NS’s Permian buildout, the company spent heavily on its Northern Mexico transportation assets and Corpus Christi crude oil export facilities. NS’s total capex peaked in 2019 at $546 million.
However, in late 2019, management changed its tune. In December of that year, it guided to capex of $325 million in 2020, as shown in the slide below.
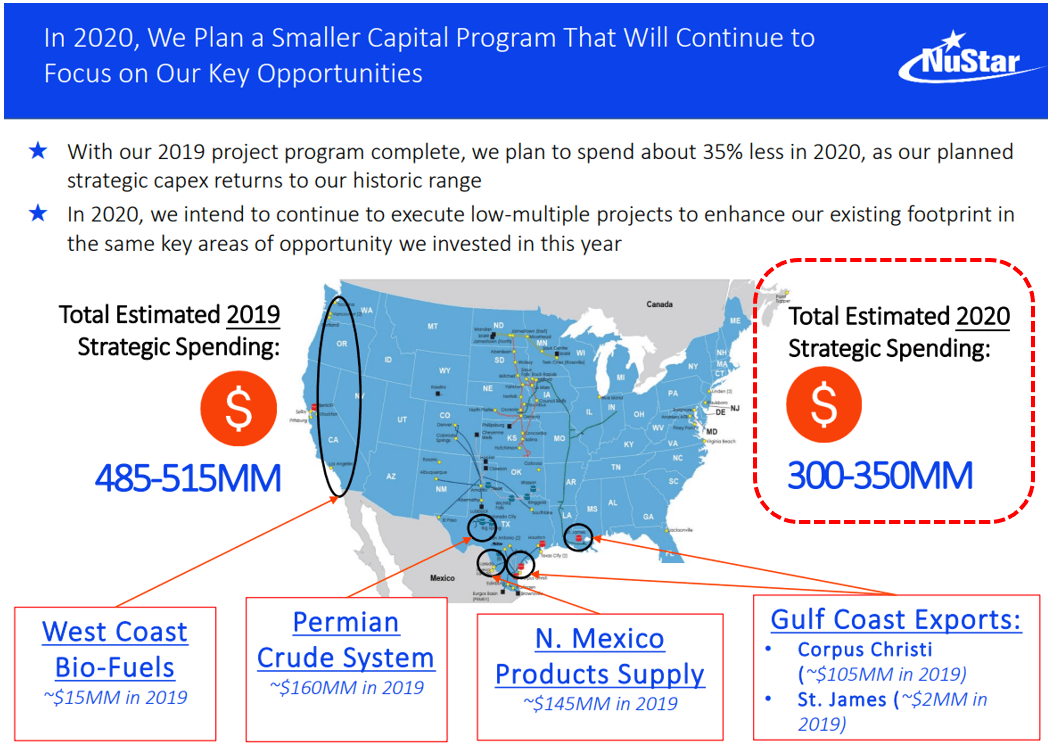
NuStar Energy (NS Wells Fargo Economics & Strategy 18th Annual Midstream and Utility Symposium Presentation, Dec. 11. 2019. Red-dotted line added by author.)
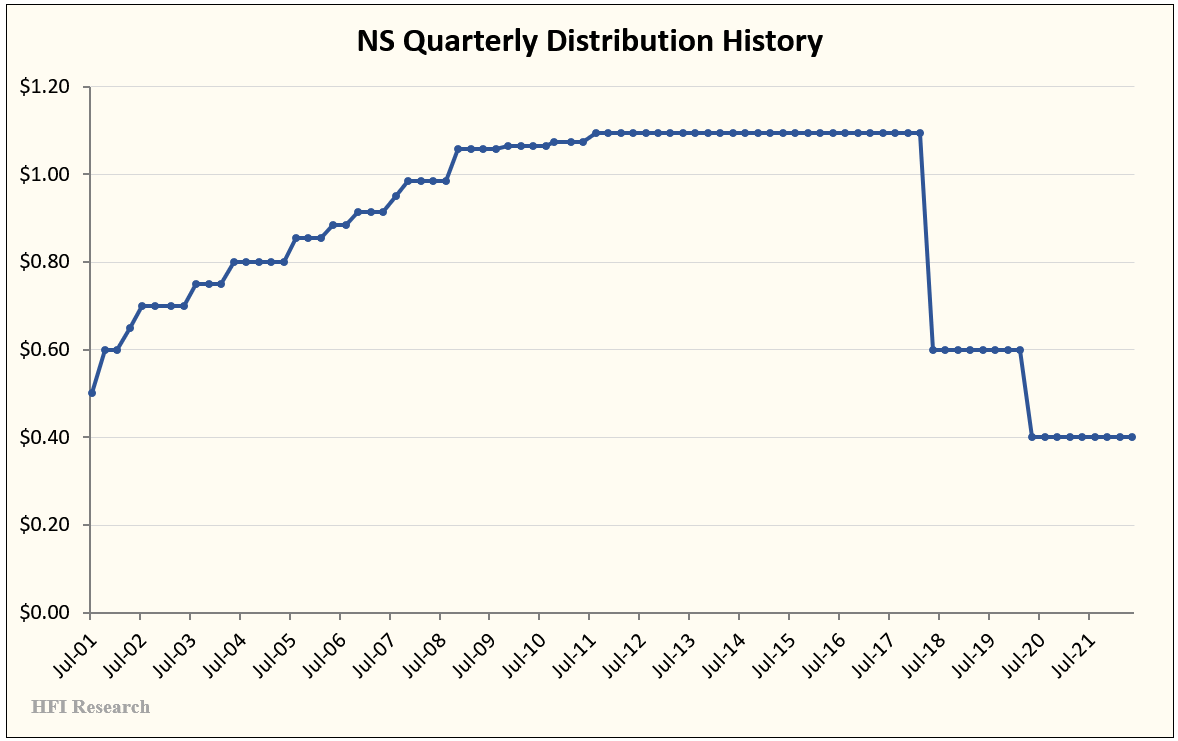
After Covid-19 hit, management slashed 2020 capex far more than initially budgeted. It ended up spending $209 million. In May 2020, NS also cut its distribution by one-third, as shown below.
HFI Research
Then in 2021, NS slashed capex further, to $181 million.
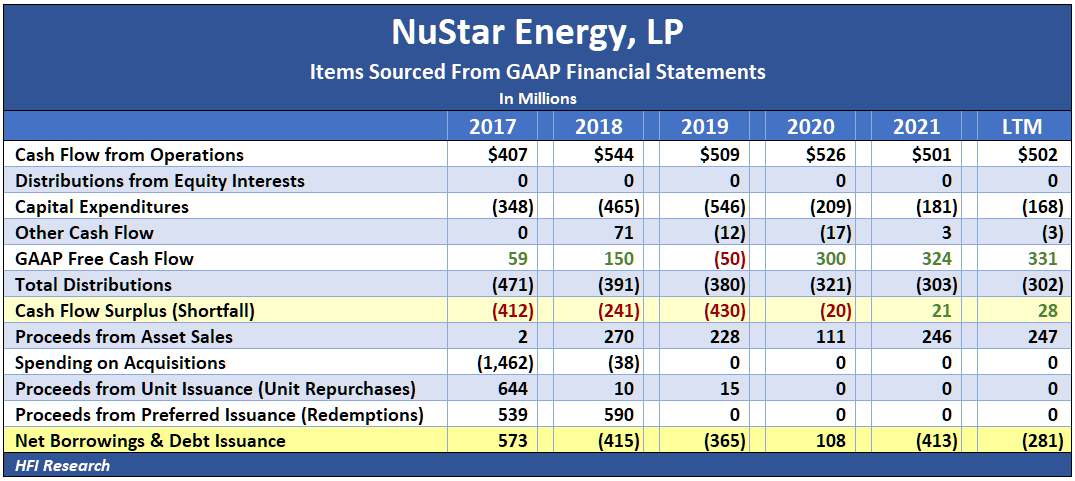
These measures boosted the company’s free cash flow and transitioned it from a steep cash flow deficit to a small cash flow surplus in 2021. It used this surplus cash and asset sales to pay down $428.5 million of debt.
NS’s improving cash flow picture from 2017 can be seen in the table below.
HFI Research
In 2022, management has guided for growth capex of $145 million, below 2020 and 2021 levels.
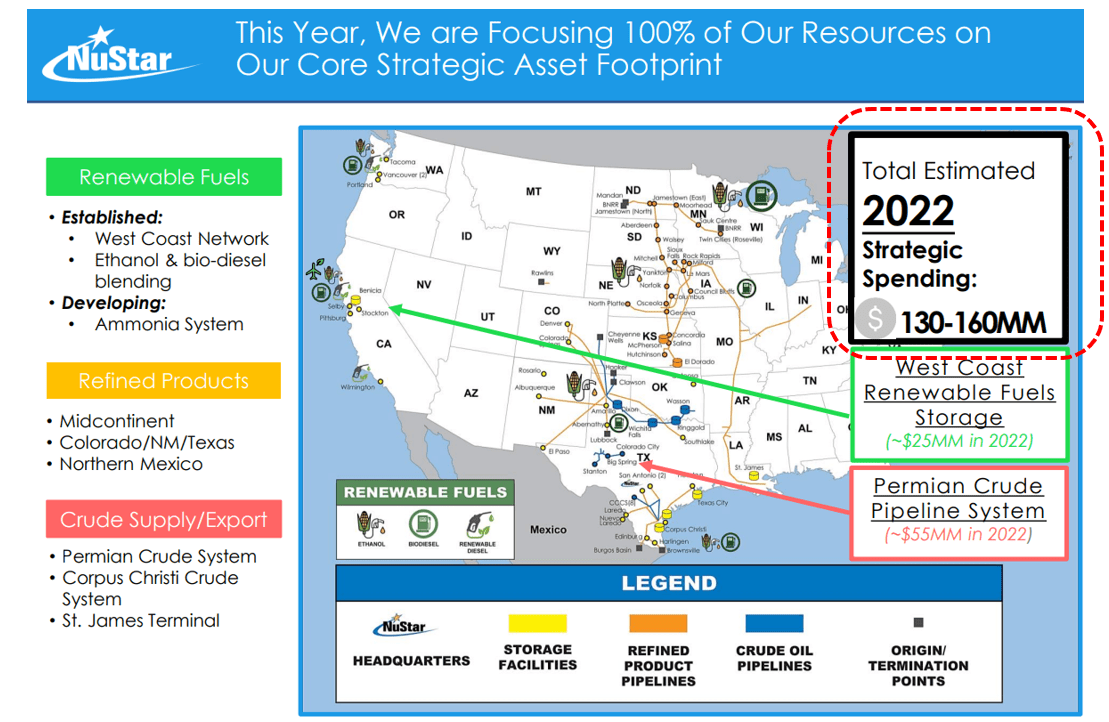
NuStar Energy (NS U.S. Capital Advisors Midstream Corporate Access Day Presentation, March 30, 2022. Red-dotted line added by author.)
We estimate that over the next few years, NS’s reduced growth capex and the resulting cash flow surplus will be one of two catalysts that allow NS to boost Adjusted EBITDA and pay down debt.
NS’s Second Catalyst: Rate Increases
Since NS’s long-haul pipelines are interstate liquids pipelines, they can adopt the FERC Index to set tariff rates. In recent months, NS filed rate increases with the FERC that became effective on July 1. NS increased its crude pipeline rates in the low-to-mid single-digit range. However, it increased rates on its North, East, and Central West refined product pipelines by the FERC Index’s maximum allowable rate of 8.7%. We estimate NS’s refined product pipelines account for slightly more than one-third of its Adjusted EBITDA, so the rates increases will have a significant impact on companywide results by boosting Adjusted EBITDA and free cash flow, reducing leverage, and setting the stage for a quicker pace of debt paydown in the years ahead.
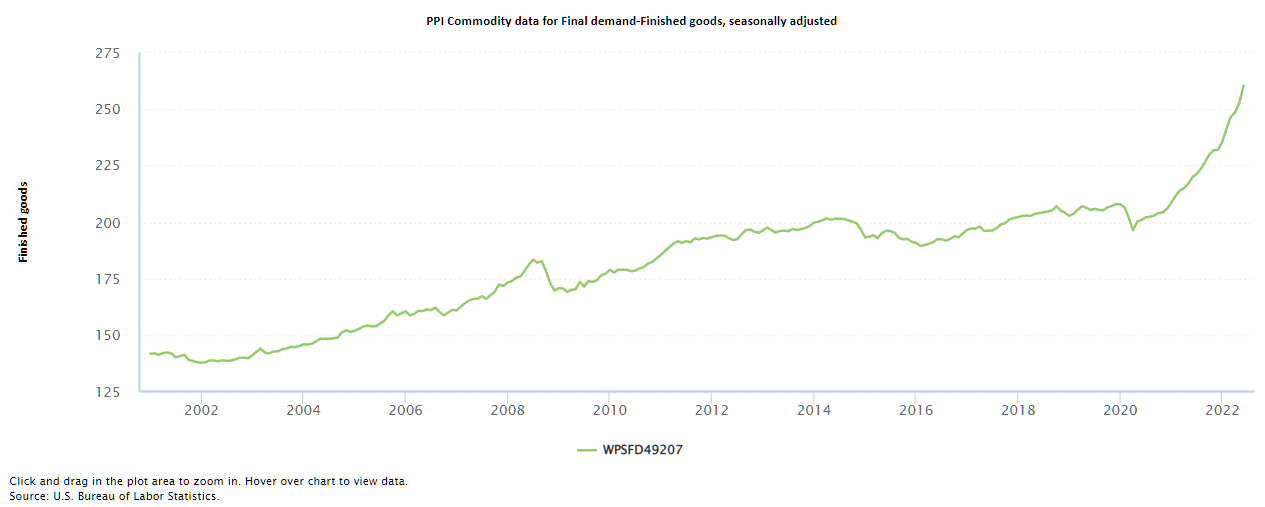
NS’s recent rate increases will have an immediate positive impact on second-half 2022 Adjusted EBITDA. However, they also signal that NS is in a position to increase rates again by reference to next year’s FERC Index next year on July 1, 2023. The FERC Index is based on the Producer Price Index for Finished Goods (PPI-FG), which has been dramatically outstripping the more widely-cited Consumer Price Index. In June, for instance, while the CPI increased by 3.3%, the seasonally-adjusted PPI-FG increased by a whopping 18.4% over its year-ago level. The historic run-up in the PPI-FG over the past two years can be seen in the chart below.
BSM
On a year-over-year basis, the change in the PPI-FG is likely to come down over the coming months. Still, a price increase in the mid-to-high single digits appears likely for next year’s reset. This would have positive implications for NS’s results in 2023 and 2024.
The rate increases will offset the adverse impact of continued increases in the SOFR lending rate, which NS’s Series A, B, and C preferred distribution rate will be tied to over at least the next few years. They will also offset the adverse impact of NS’s Series D Preferred distribution rate stepping up from its current 10.75% yield to 13.75% in 2023.
Other Positive Factors For NS Equity
Aside from the two catalysts discussed above, NS equity has other factors in its favor. For one, the company’s liquidity position is strong. It features $897 million of cash and revolver availability. Also, NS has no debt maturities until 2025, as shown in the slide below.
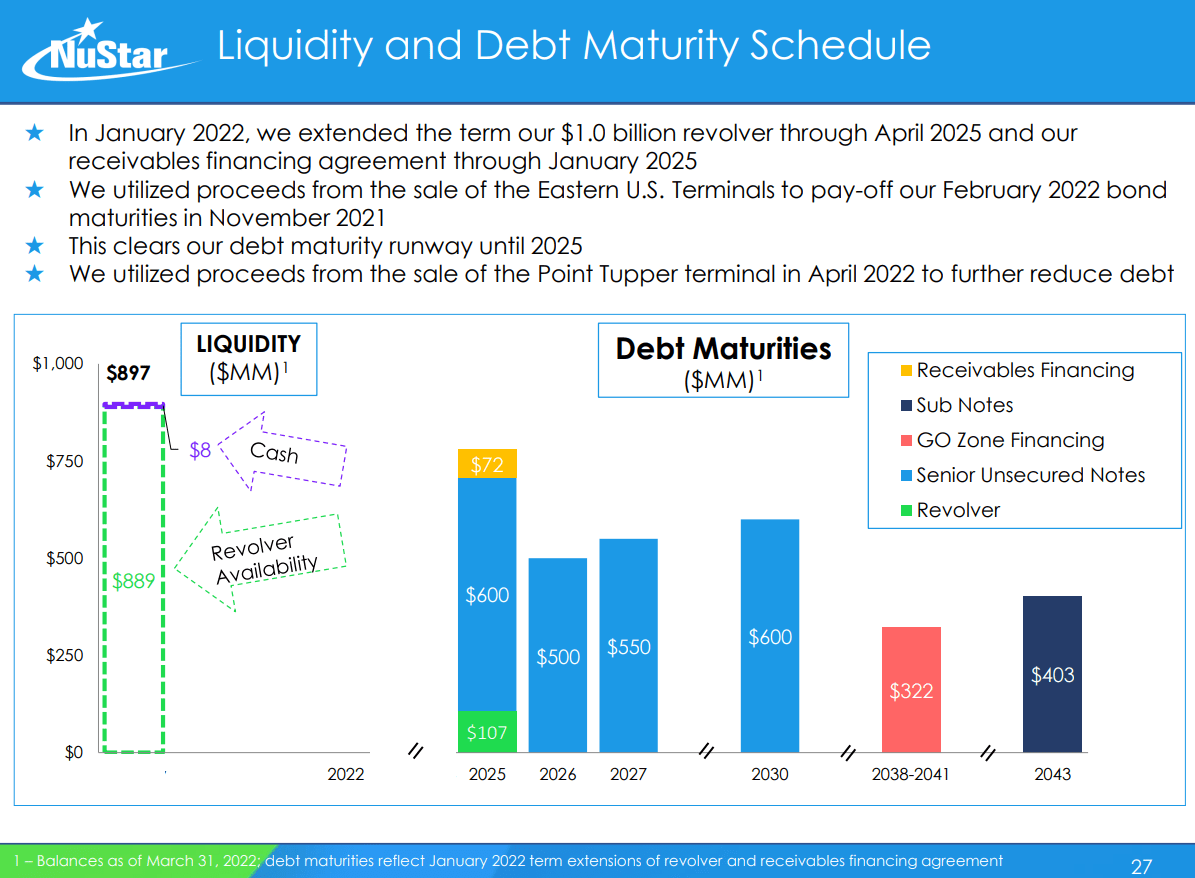
NuStar Energy (NS 2022 Energy Infrastructure Investor Conference Presentation, May 16, 2022.)
In addition, NS’s Permian G&P system is set for growth in 2022 and beyond, as management discussed in its first-quarter earnings conference call shown below.
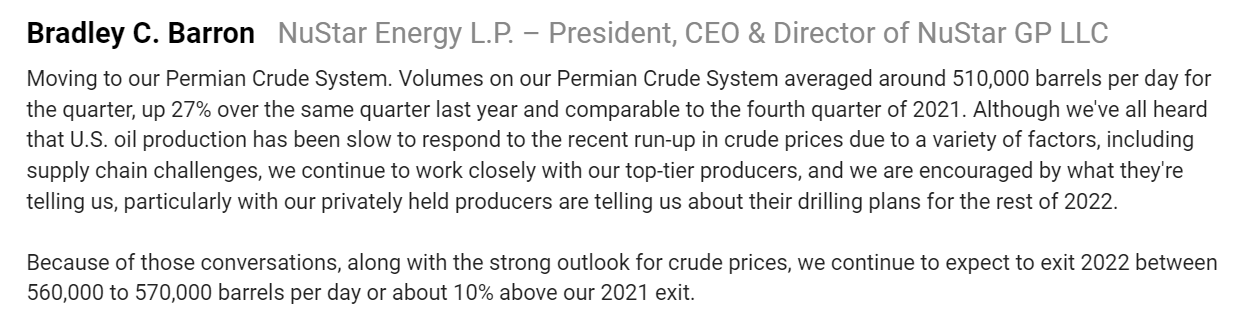
Thomson Reuters
Assuming NA generates decent returns on its Permian assets, increased customer activity will further bolster cash flows over the coming years. This can accelerate deleveraging.
Lastly, additional asset sales are also possible. For example, NS management appears committed to its renewable assets. However, given the high transaction prices for renewables assets, they could fetch a high EBITDA multiple and help NS de-lever.
Risks To NS Equity
Equity owners should be aware that NS won’t be able to significantly increase its common distribution until leverage comes down or its Series D Preferreds are redeemed and replaced with obligations with lower interest rates.
We don’t see much operational risk, as the long-haul pipelines and Permian G&P system operate with stable throughput.
Rather, the biggest risk to NS equity owners stems from management’s capital allocation. The leverage reduction we anticipate will allow NS to refinance its nearest debt maturity in 2025. By 2028, it should have no problem redeeming the $678.6 million of its high-yielding Series D Preferreds.
Management details its capital allocation plan in the following excerpt from NS’s 2021 10-K:
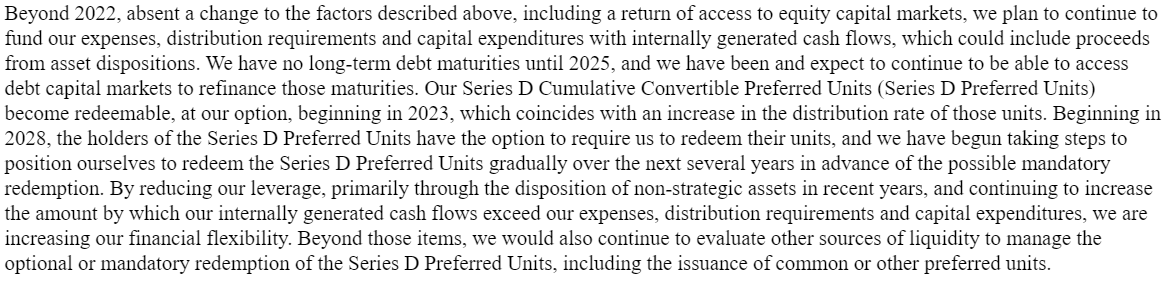
NuStar Energy (NS 2021 10-K, pg. 19.)
We believe management plans to pay down debt and reduce leverage to the point that the Series D Preferreds can be replaced by lower-cost debt, likely before 2028. Alternatively, it could replace the Series D with another preferred issue.
We hope management doesn’t resort to dilutive measures like issuing convertible preferred or common units, but of course, these can’t be ruled out. In light of management’s poor capital allocation track record, we believe a dilutive capital raise is the single greatest risk to equity owners.
The other significant risk to equity owners would be if the PPI-FG turns negative for a sustained period. We view this as more of a risk in 2025 and beyond. It could arise if the Fed gets aggressive with fighting inflation and sends it lower. This would cause NS’s crude oil and refined product pipeline rates to decrease, which of course would hinder the company’s ability to deleverage.
NS Units’ Huge Total Return Upside
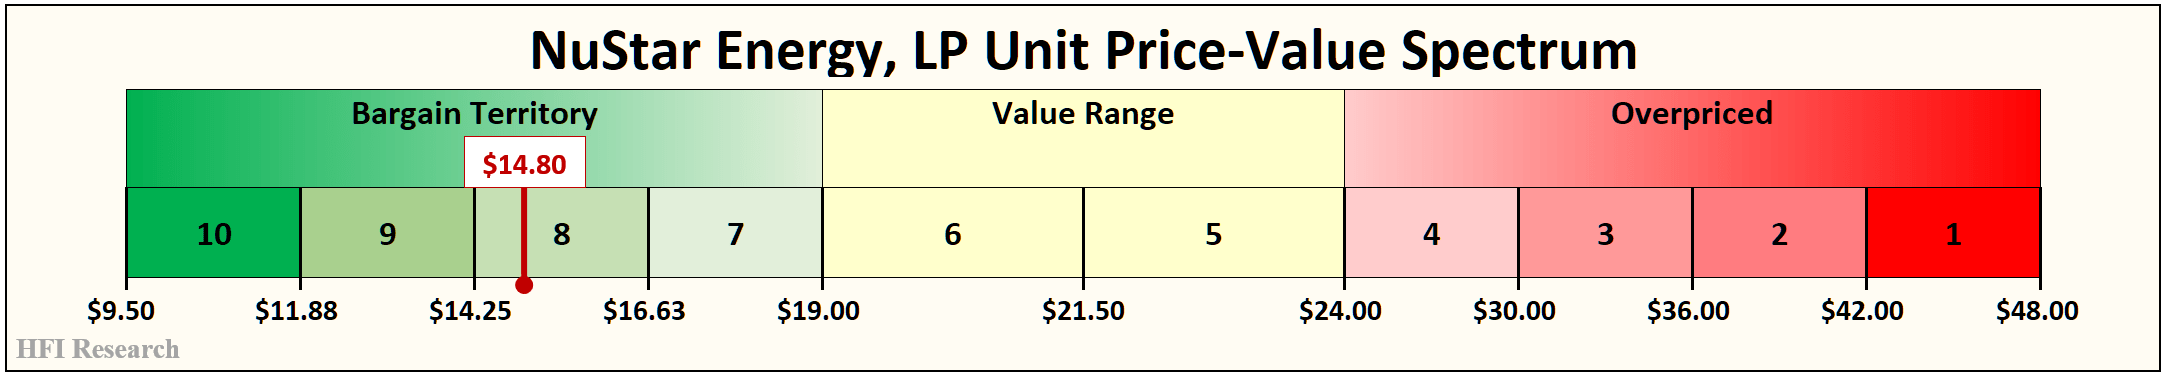
We value NS units in the range of $19 to $24. Our price target is the midpoint, or $21.50, which represents 45.3% upside from the current price.
HFI Research
As deleveraging occurs, total return upside can be far greater, as shown in our valuations below.
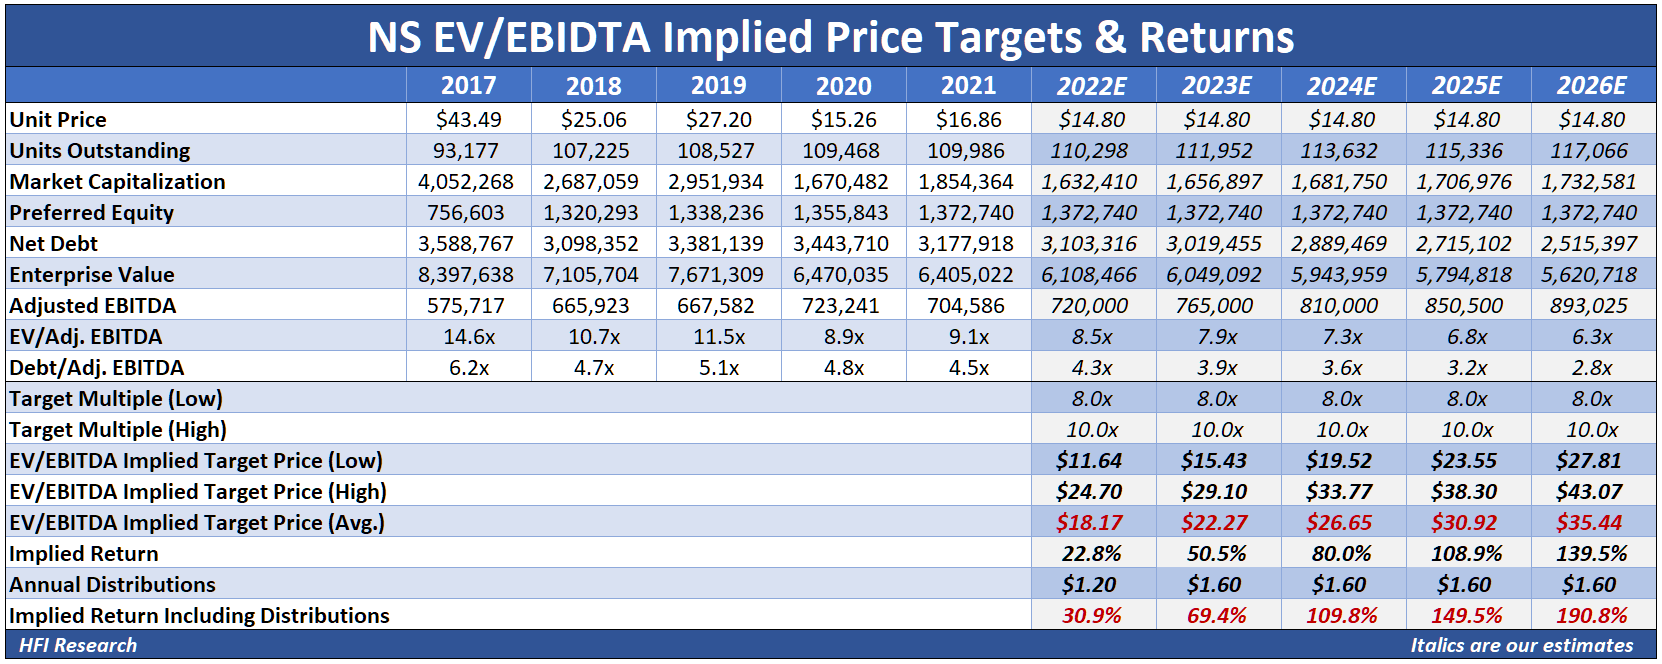
In our valuations, we assume that Adj. EBITDA and operating cash flow increases by 6.3% in 2023, 5.9% in 2024, and 5.0% thereafter due to rate increases. We don’t assume any benefit from capital projects recently put into service. We also assume 2022 maintenance capex of $150 million, far above management’s reported “reliability” capital expenditures, due to the significant ongoing capital needs of NS’s Permian G&P system. Maintenance capex increases by 5.0% each year. Meanwhile, the unit count grows by 1.5% per year, and distributions stay flat at their current annual rate of $1.60 per unit.
Our valuations also assume that the floating rates on NS’s Series A, Series B, and Series C Preferreds increase their combined distributions by $8.0 million in 2023. As for the Series D Preferred, we assume its scheduled interest rate rest increases its distribution by an additional $17.7 million in 2023.
Our EV/EBITDA valuation indicates the units are worth $18.17 in 2022. Including distributions, their implied total return is 30.9%. That implied total return increases to 190.8% by 2026. This is one of the higher 5-year implied total returns in our coverage universe.
HFI Research
Our estimates show that NS’s leverage ratio falls to a comfortable 3.6-times by the end of 2024, at which point more attractive options should open up to management for addressing the company’s debt and onerous preferred obligations.
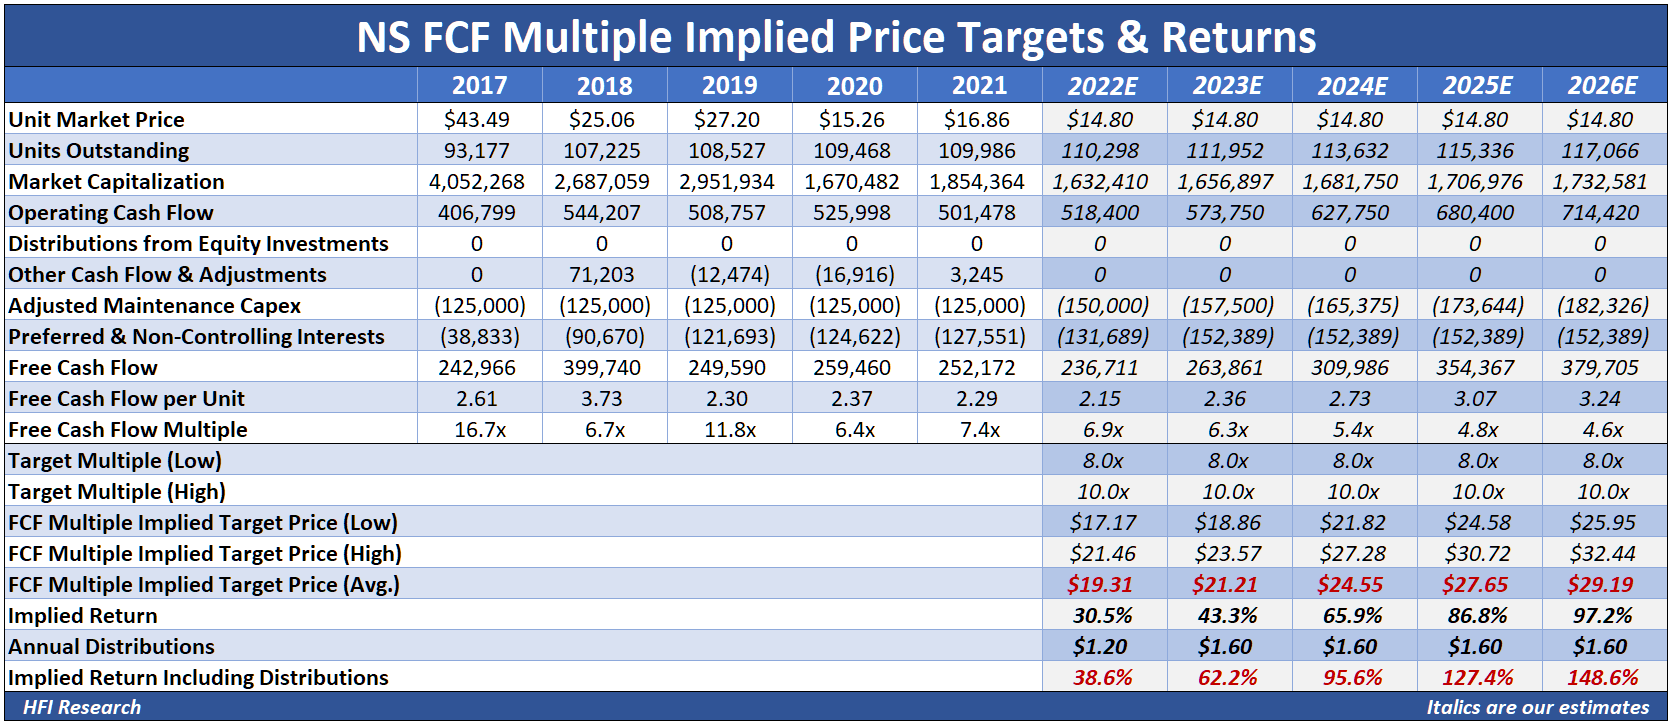
Next, our free cash flow valuation assumes that after $180 million of common distributions, NS’s cash flow surplus grows each year from $57 million in 2022 to $200 million in 2026. These growing annual surpluses increase the safety of its common distribution. We assume that each year, management allocates NS’s cash flow surplus toward paying down debt.
Our free cash flow valuation indicates that NS units are worth $19.31 in 2022, which implies a 38.6% total return after distributions. The implied total return increases to 148.6% in 2026.
HFI Research
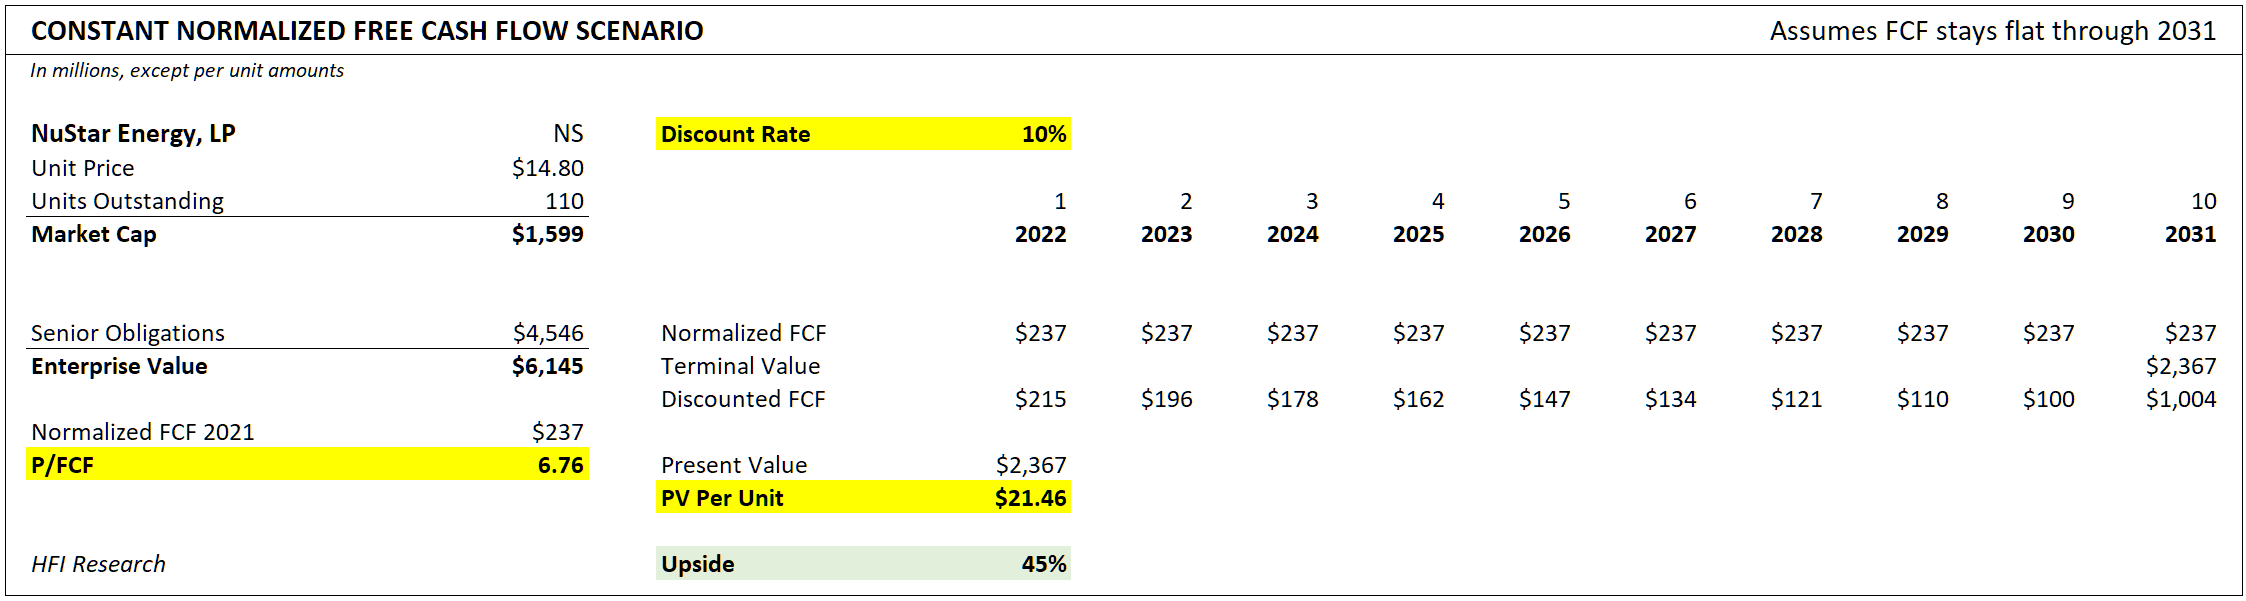
Lastly, our discounted cash flow valuation, which assumes 2022 free cash flow stays flat for ten years, values NS units at $21.46, implying 45% upside from their current price of $14.80.
HFI Research
Conclusion
NS equity value and common distribution are poised to become safer over the next few years. Moreover, as the company deleverages, the potential upside is enormous. We rate NS units a Buy. Assuming management can execute in a non-dilutive manner, we believe equity owners who buy today can benefit from many years of capital appreciation and distribution increases that lie ahead.
Be the first to comment