

DieterMeyrl/E+ via Getty Images
Inflation that exceeds a healthy level of around 2% per year can be a terrible thing. It erodes your spending power, raises essential household obligations such as energy and food prices, and requires you to work longer hours to earn the same amount of money you used to earn only a short while ago. It’s our job to recommend stocks to our readers, and today’s article is geared toward “investing in inflationary environments.”
Newmont Corporation (NYSE:NEM) is widely known as the largest gold mining company in the world, and it’s my top inflation-hedge pick for the rest of 2022. The stock exhibits all the qualities required to fight inflation and present excess returns as a low-risk; Here’s why.
Inflation – An Overview, What’s Changed, and Newmont’s Role
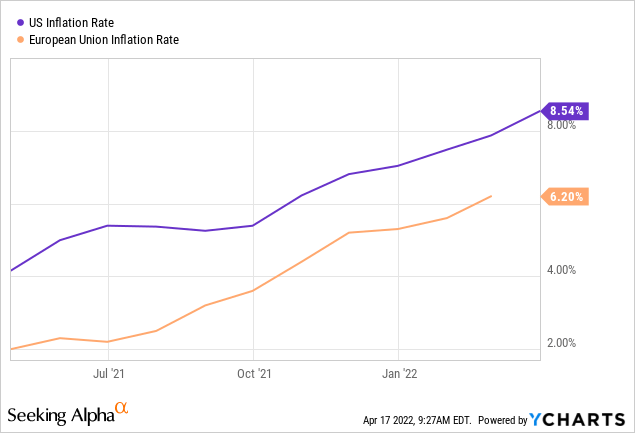
The inflation we’re all experiencing is due to push and pull factors, which is unique. We had pandemic lockdowns accompanied by stimulus, which provoked a surge in spending while supply tapered downwards, and that’s largely why we’re at an inflation rate of 8.54%. Adding to that is the most recent geopolitical tensions with Russia, which have exacerbated push inflation, especially in non-core areas such as food and energy.
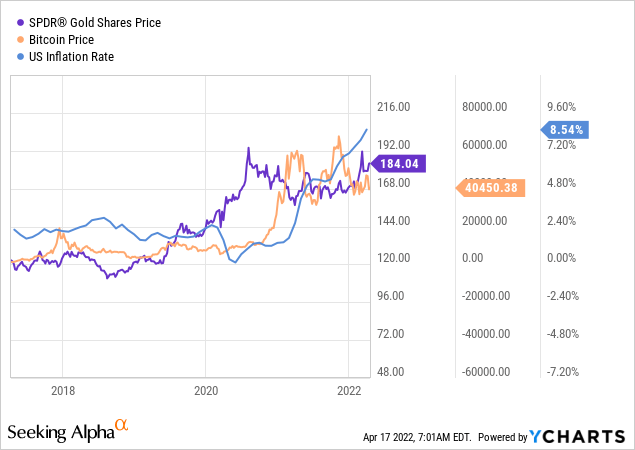
It’s unlikely that inflation will find calm anytime soon, so I checked up on some correlations this past weekend to see what the commonly known inflation hedges are doing. Much was made of Bitcoin’s properties as a hedge against inflation, but it’s clear that it’s gold that’s resurfacing as an inflation hedge. This prompted me to seek a “best-in-class” gold stock to present our readers with.
I wanted to do a scatterplot in Excel that would explain the correlation with the help of Solver, but the data cleansing process would’ve been too time-consuming. Thus, I rather opted to run a regression model in Portfolio Visualizer and pulled it onto Excel to make it more presentable. I decided to test the correlation between Newmont’s stock and two ETFs, namely PIMCO 15+ Year US TIPS ETF (NYSEARCA:LTPZ) and PIMCO 1-5 Year U.S. TIPS ETF (NYSEARCA:STPZ), which are inflation-linked bond ETFs. The correlation analysis shows us that Newmont’s stock exhibits a positive correlation to inflation in the short and long duration, suggesting that it’s a valid option as an inflation hedge.
Portfolio Visualizer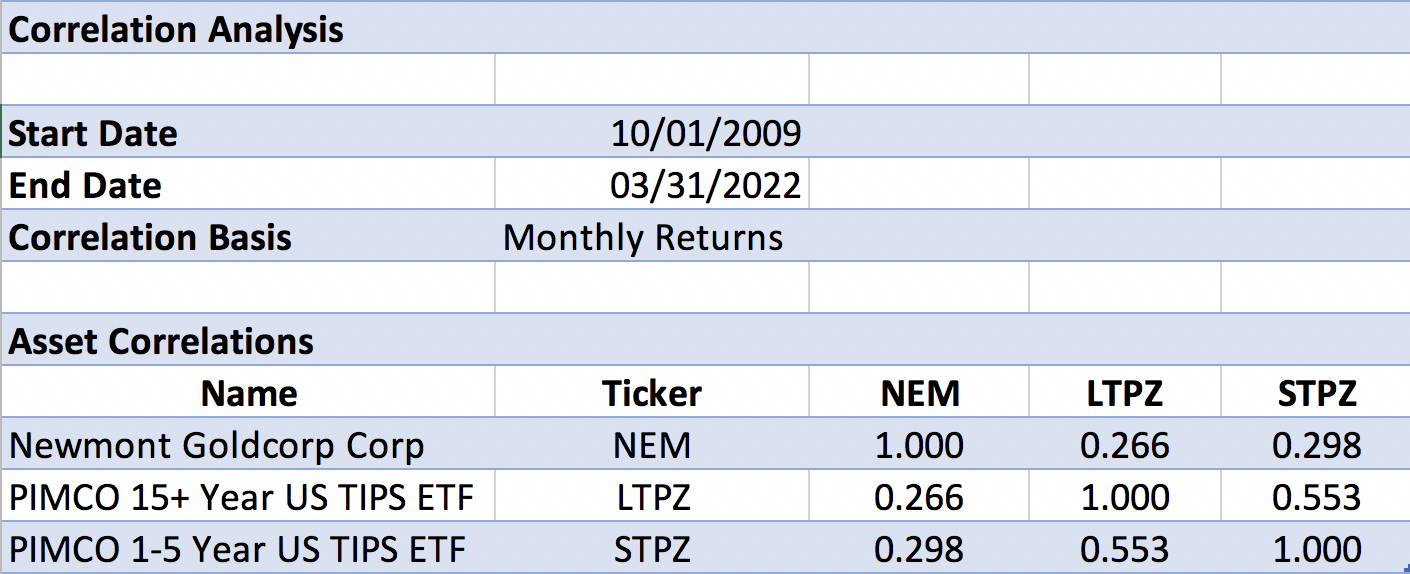
Newmont’s Key Drivers
Earnings & Operations
Newmont released its fourth-quarter and year-end results in February and beat its earnings estimate by 1 cent per share. The firm yielded significant results from its nine world-class assets across the globe. The company’s Australia segment had a strong showing with its Tanami project’s high-grade minerals, more than offsetting the challenges posed by Covid-19 lockdowns. Tanami and Boddington contributed to 1181 thousand ounces of gold produced in the firm’s Australia segment during the past financial year, a 3.48x increase from 2020.
Furthermore, Newmont’s operations in the Americas prospered as well. The Peñasquito mine in Chile delivered strong mill performance while Musselwhite acted as the cornerstone for quarterly results. The company’s North American segment delivered 1598 thousand ounces of gold during its full year, a 3.95x year-over-year increase.
Finally, Newmont’s operations in Africa seem to be catching steam with its Akyem, Ahafo, and Subika mines, all contributing to an annual production of 862 thousand ounces, a 3.52x increase from the previous year.
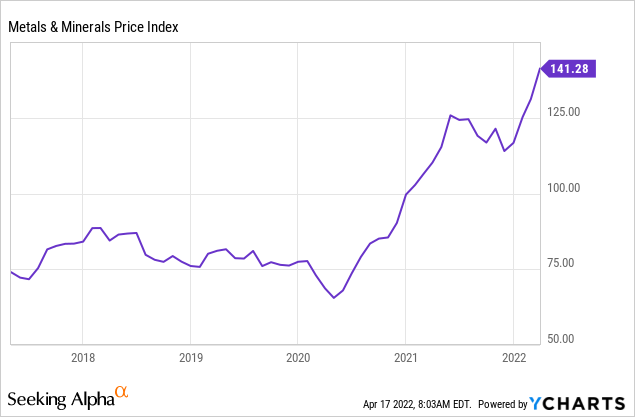
On a company-wide basis, Newmont boded increases in annual financial performance with its revenue increasing by 6.3%, Adjusted EBITDA by 7.06%, and Adjusted Net Income by 10.79%. This leaves Newmont in a strong position moving into its 2022 financial year as metals prices remain elevated (see chart below) and pandemic lockdowns continue to subside.
Newmont Earnings Presentation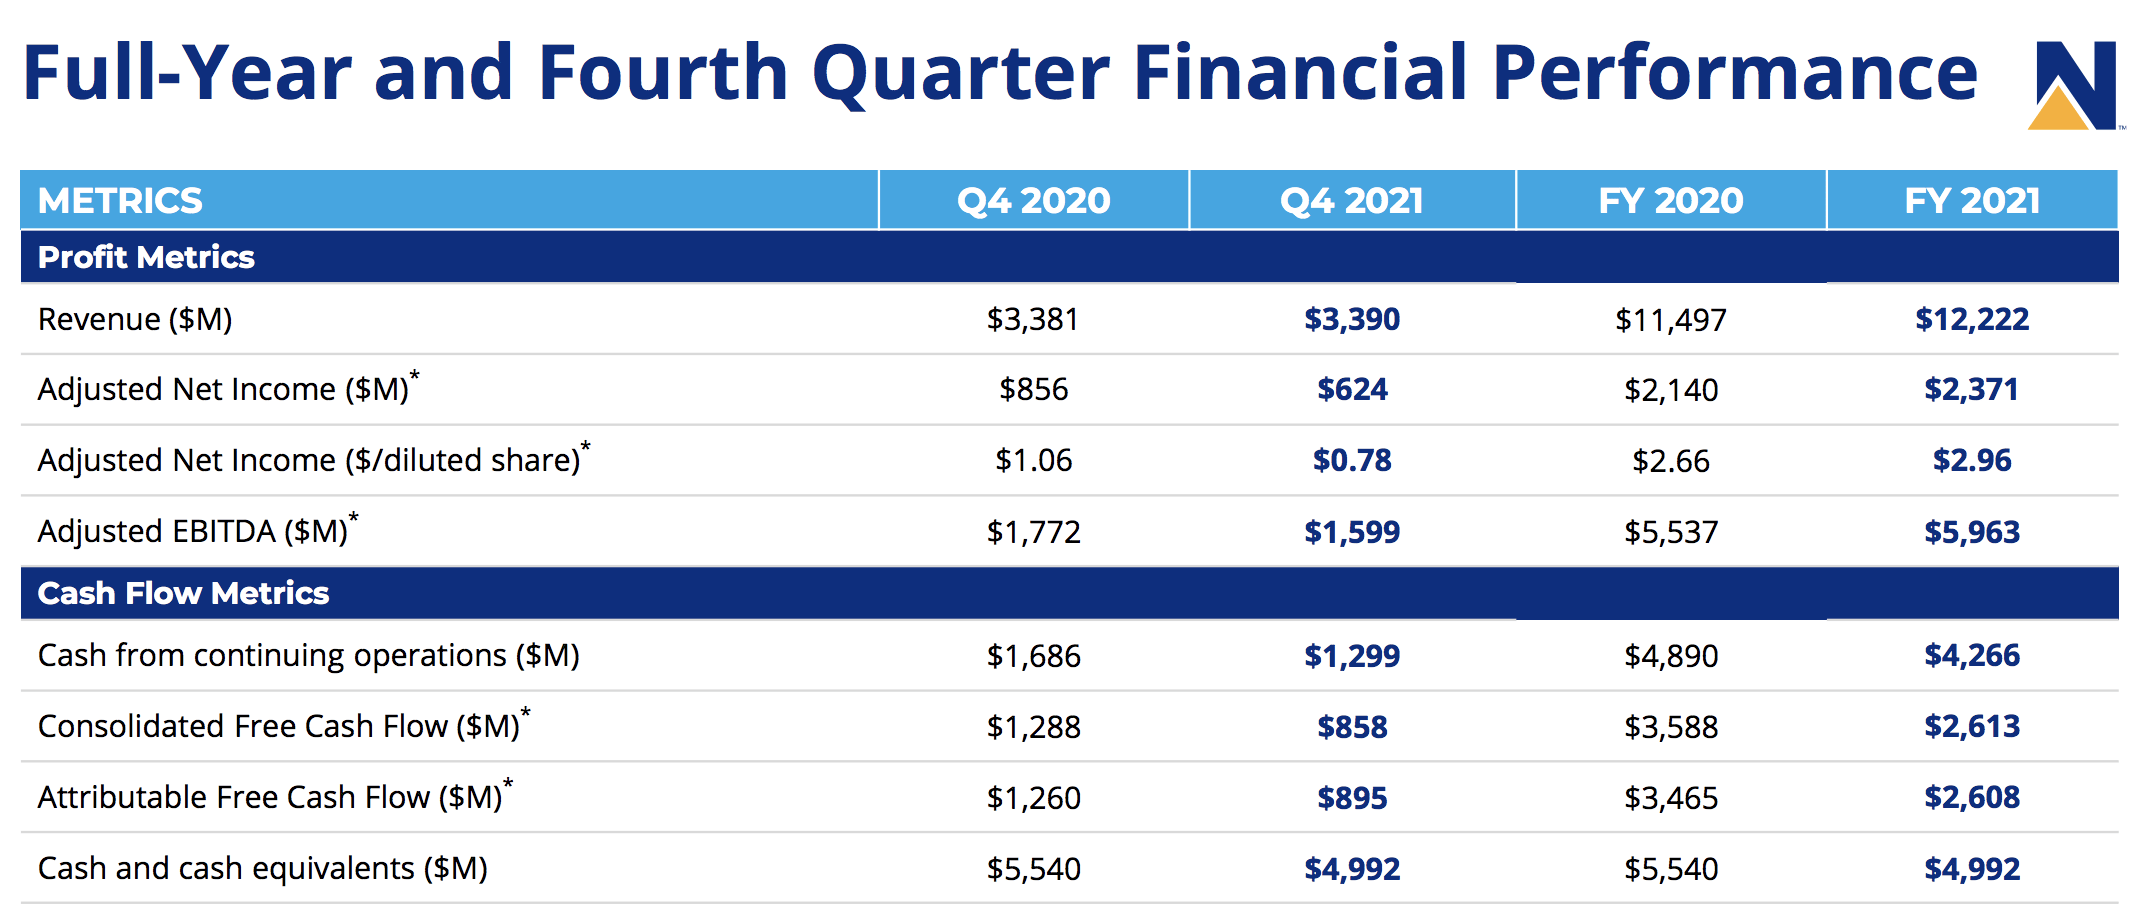
Key Operational Metrics
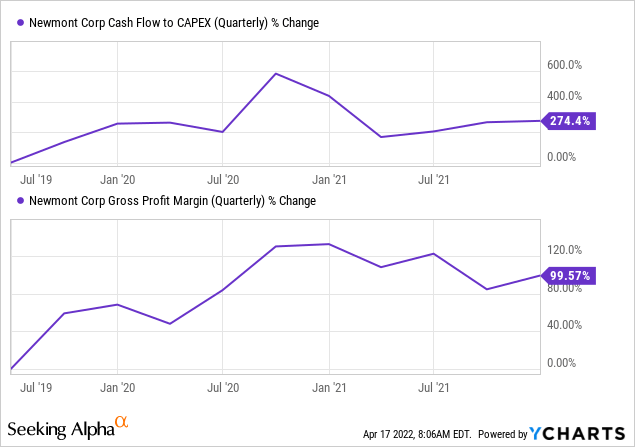
Newmont’s cash flow has grown tremendously versus its CapEx during the past three years. CapEx is a big deal to mining companies as their re-investment rates on maintenance aren’t cheap, and Newmont’s managed to maintain well while proliferating their cash flows. Additionally, Newmont’s been investing heavily in global expansion, such as its exploration investment in Peru to dig up South America’s largest gold mine, Yanacocha. From a shareholders’ perspective, it’s encouraging to see it invest aggressively yet produce substantial cash flows.
Newmont’s gross margins have also increased by a staggering 99.57% in the past three years, providing evidence of economies of scale, which has been made possible by its position as the world’s largest gold producer.
Operationally speaking, Newmont is robust, which tells me that it’s providing its investors with the necessary diligence and commitment.
Pricing The Stock
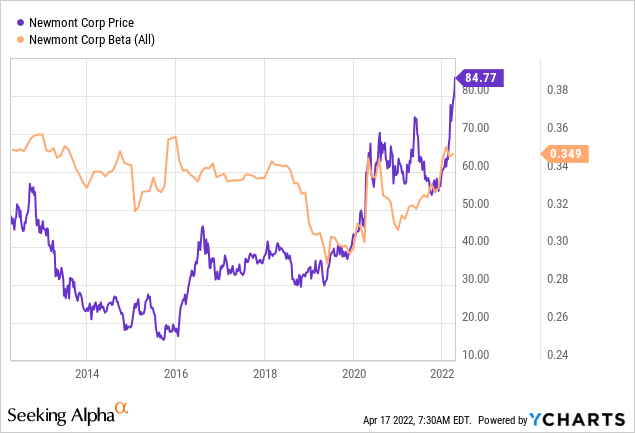
Pricing a stock refers to the expected return on an asset in an efficient stock market. I enjoy using pricing metrics as they explain a stock’s return in different market circumstances and the risk at that as well. To start off, Newmont’s Beta coefficient of 0.349x means that the stock is roughly 2.87x less risky than the S&P 500. That’s quite impressive, considering its stock has also outperformed the S&P 500 index during the past 5-years.
I used Portfolio Visualizer to run a Carhart four-factor model, which explains a stock’s historical overall annualized alpha over the S&P 500, its alpha over the index in a momentum market, its alpha in a value-driven market, and its alpha in a size driven market.
My findings were that Newmont performed in the following way from January 2000 until April 2022.
- Outperformed by 2.69% when the broader market is in a state of momentum.
- Outperformed by 2.60% in a value-oriented market.
- Underperforms the market when small-cap stocks outperform large-cap stocks.
Portfolio Visualizer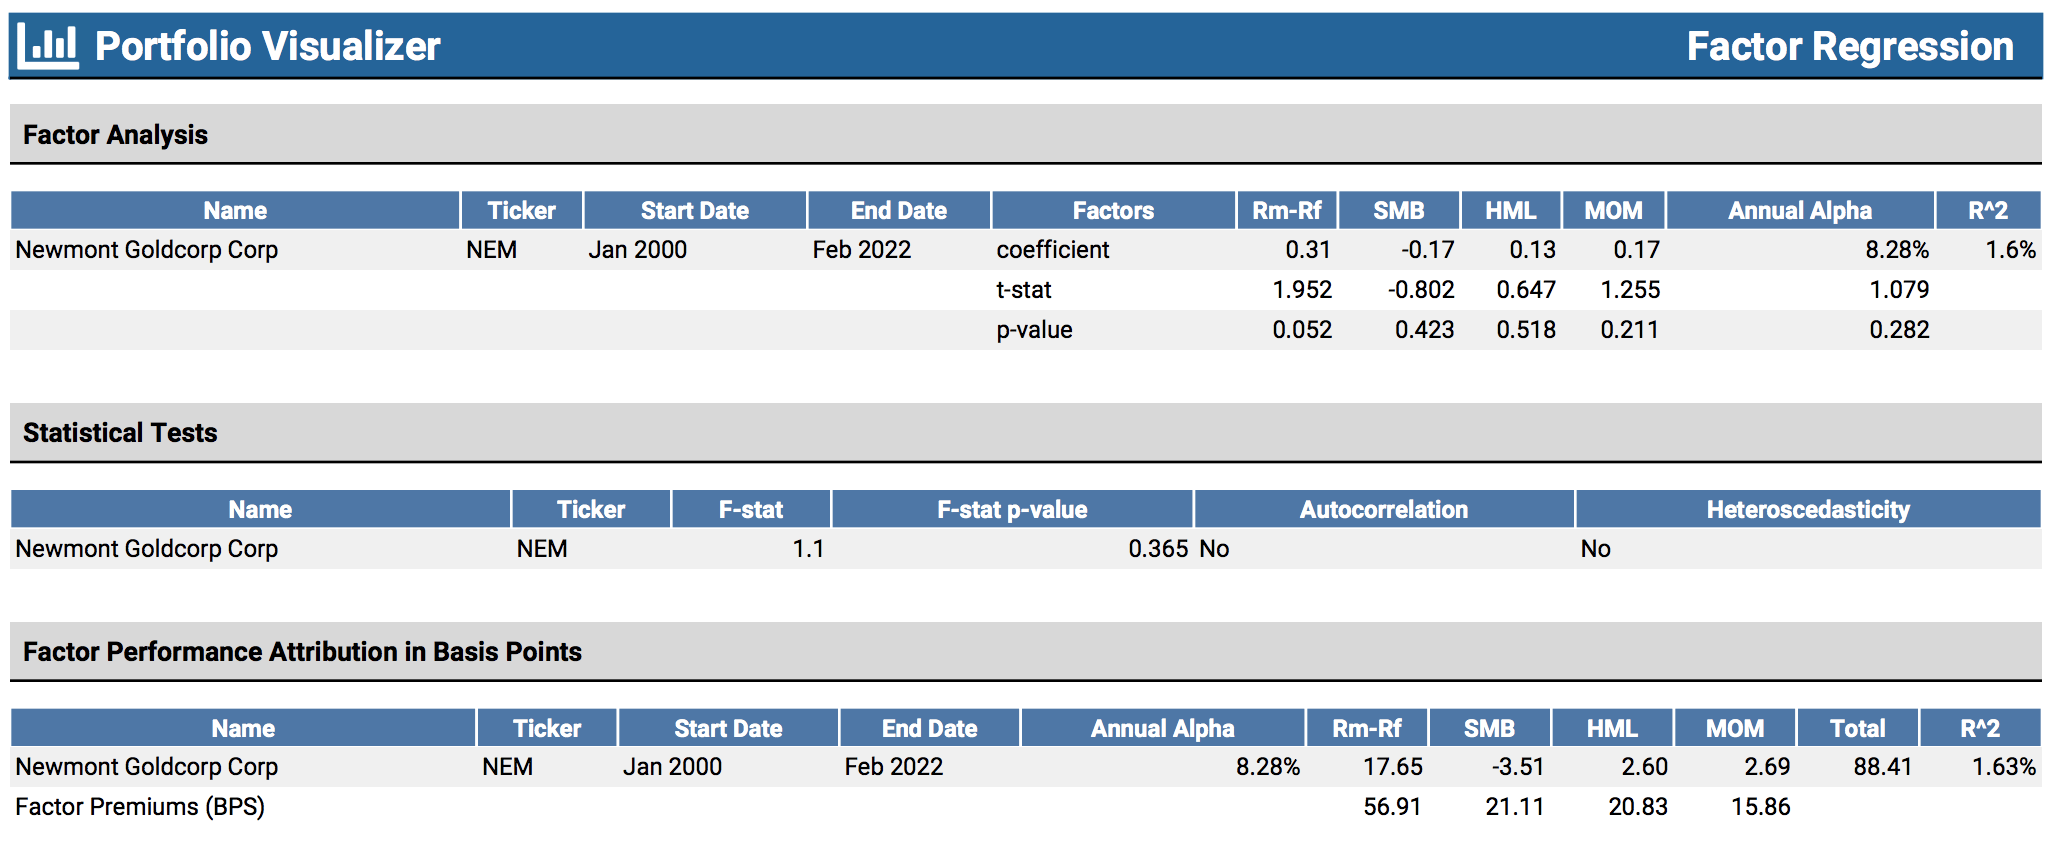
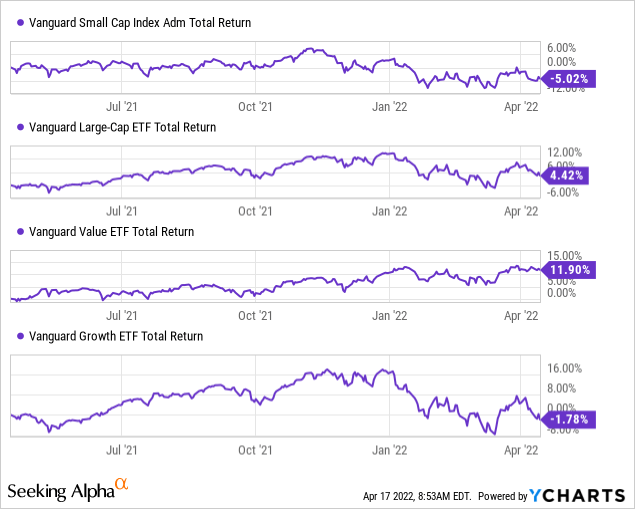
Although not representative of the entire stock market, the ETF charts below support the claim that we’re in a large-cap value market at the moment. This leaves Newmont’s stock with a lot of support moving forward if the Carhart model is anything to go by. And in addition, it somewhat substantiates the claim that large-cap value outperforms small and large-cap growth during high inflationary periods.
Dividend Analysis
Newmont’s one of the top 50 dividend payers on the S&P 500. The stock presents shareholders with tremendous value with a dividend payout ratio of 74.58% at a forward yield of 2.60%. The company’s capacity to sustain such dividend payments is certainly intact if one considers its $4.28 billion in cash from operations and 6.30x cash per share. Additionally, Newmont’s interest coverage ratio of 7.53x and its dividend coverage ratio of 1.45x suggest that distributions could be sustained for quite some time.
Seeking Alpha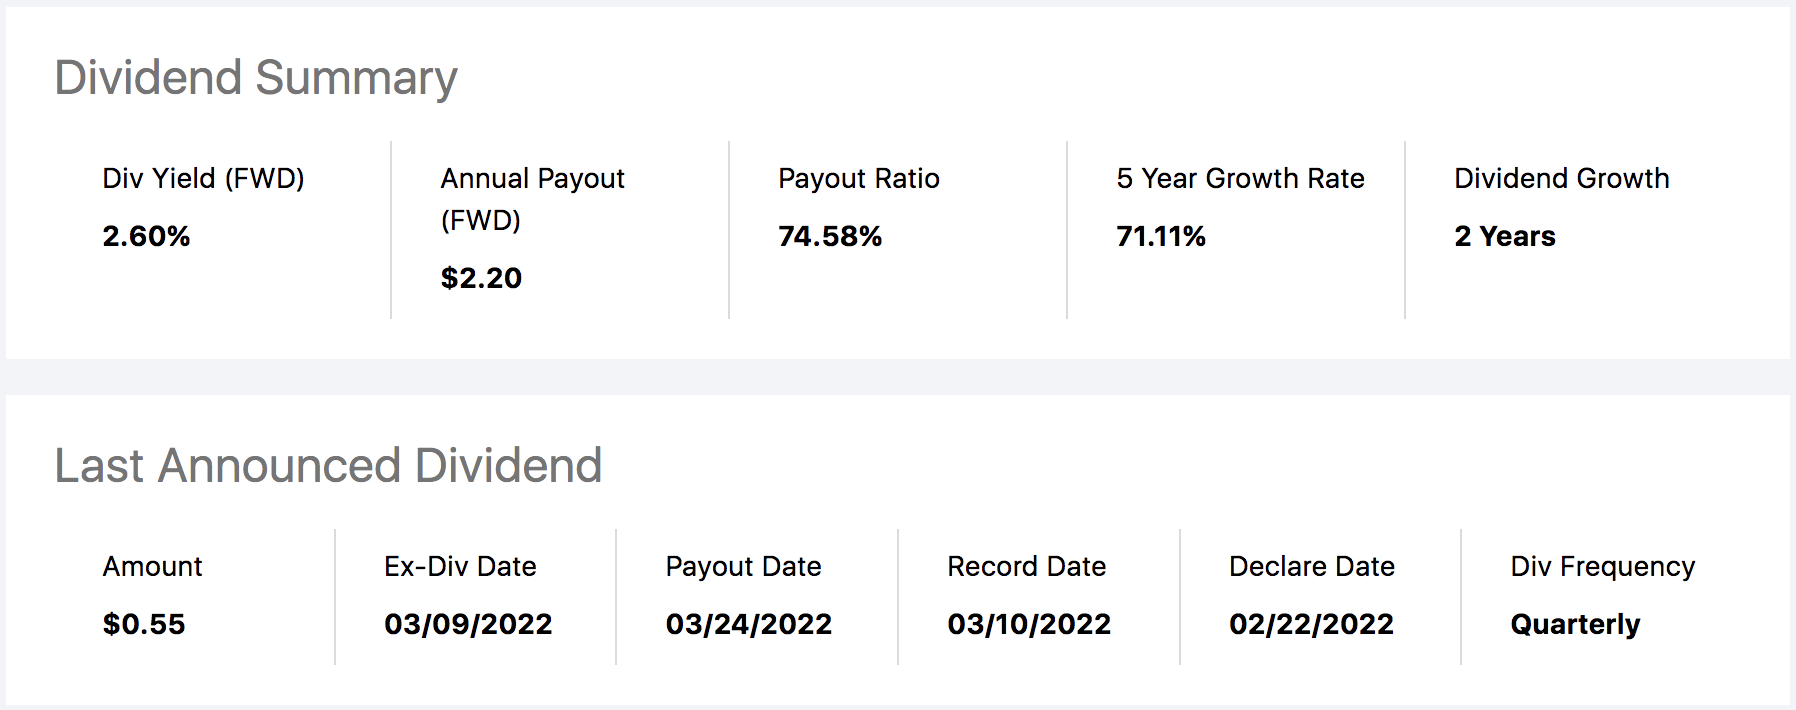
Possible Risks
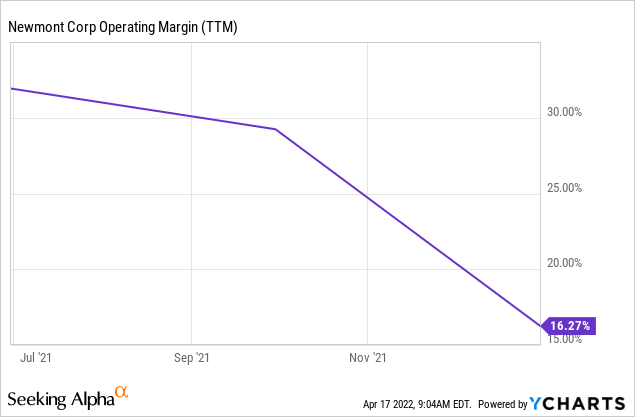
Starting from the bottom upwards. Newmont’s operating margins and cash from continuing operations came in a bit light last year. The firm’s operating margins have declined due to higher variable and fixed costs amid growing global inflation. This provides evidence that even the primary sector, which is often the best positioned to fight inflation is struggling to sustain its profit margins. Newmont’s cash from continued operations also came in 14.6% lower in the previous financial year than it did in 2020, leaving it with a disparity between its organic cash inflows and its income statements’ success.
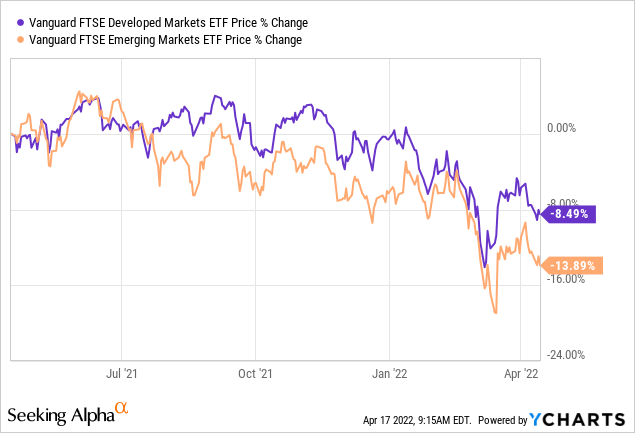
Suppose one takes a bird’s nest view rather than looking at Newmont’s idiosyncratic features; it’s safe to say that the broader market is in a tizzy with global indices mainly in the red zone. There’s been much geopolitical tension as well as talk of another “Omicron Esque” variant that could hit the globe this year. The issue with stocks is that risk-off diversification into an asset such as Newmont doesn’t matter because nearly all assets decline in a down market with serious magnitude.
The Bottom Line
Newmont stock holds a positive correlation to TIPS bonds, which are inflation-linked. The company has profited from rising metals prices, which could persist as push inflation looks set to stay. Furthermore, Newmont’s stock exhibits good qualities from a pricing and dividend perspective. It’s a well-rounded asset and a “best-in-class” investment if you’re seeking to hedge inflation.
Be the first to comment