

Alfio Manciagli/iStock via Getty Images
The Q1 Earnings Season for the Gold Miners Index (GDX) has finally begun, and the first company to report is Newmont (NYSE:NEM). From a headline standpoint, gold production was 8% lower, but this was not surprising given the lower Nevada production pre-reported by Barrick (GOLD). Fortunately, a higher gold price picked up some of the slack, and while costs were up in the period, Newmont maintained solid AISC margins. At a share price of $78.00, I see limited short-term upside for Newmont from current levels. Still, given its high-quality business model and attractive yield, I would view sharp pullbacks as buying opportunities.
Newmont – Nevada Gold Mines Operations (Barrick Gold Presentation)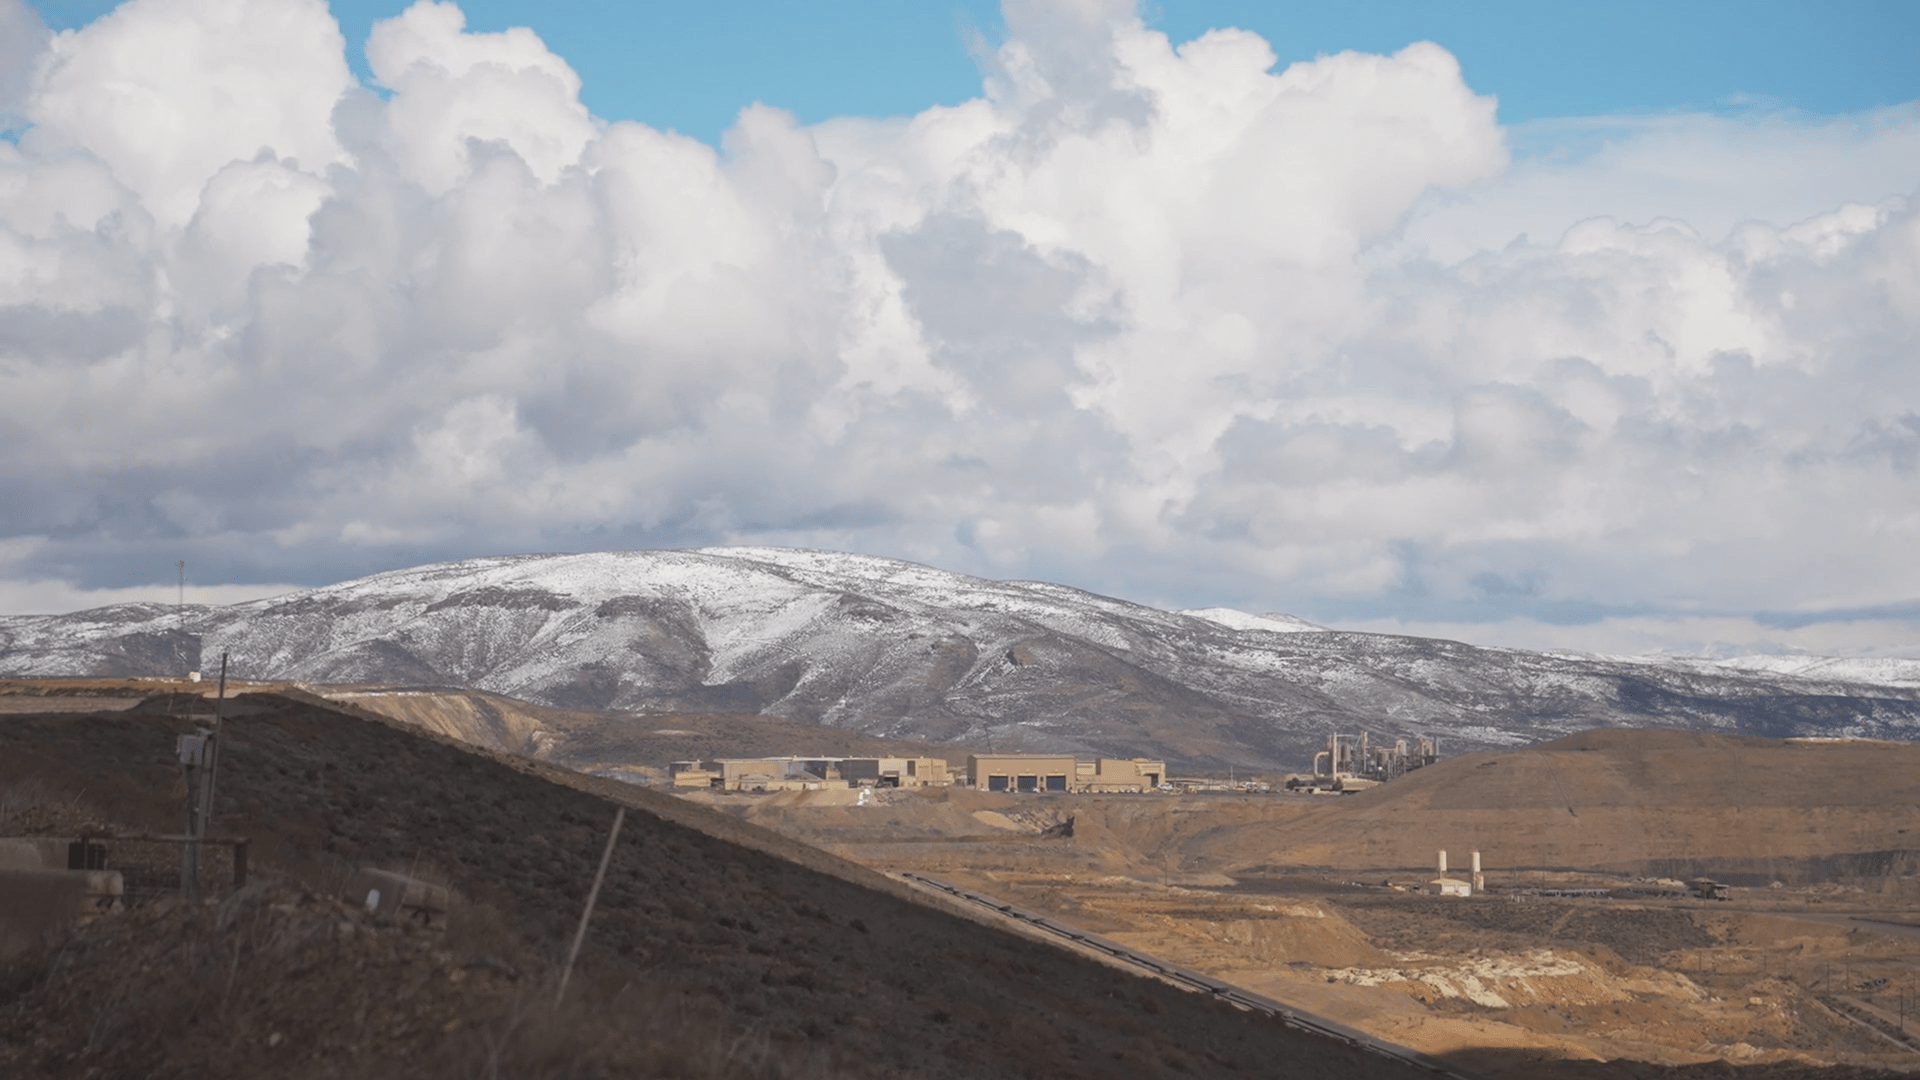
This week, Newmont released its Q1 results, reporting quarterly production of ~1.34 million ounces of gold and ~350,000 gold-equivalent ounces [GEOs]. This translated to an 8% decline in gold production and a 10% increase in GEO sales, with higher GEO sales helped by better grades at the company’s massive Boddington and Penasquito mines. While the results may appear disappointing, with total production down year-over-year, these results are satisfactory, in my view. This is because they’re tracking roughly in line with guidance despite headwinds brought on by Omicron, which led to elevated absenteeism levels for some miners that have pre-reported their results. Let’s take a closer look below:
Production
Looking at the chart below, we can see that Newmont’s quarterly gold production dipped 8% year-over-year to ~1.34 million ounces of gold, its lowest quarter of production since Q2 2020, which was severely impacted by COVID-19. However, while this was certainly a weaker quarter, Newmont practically stole the remaining ~48% interest in the Yanacocha Mine, in my view, paying just over$100/oz on gold reserves and less than 0.50x NPV (5%) at spot prices, while picking up all the upside for free.
Newmont Quarterly Gold Production (Company Filings, Author’s Chart)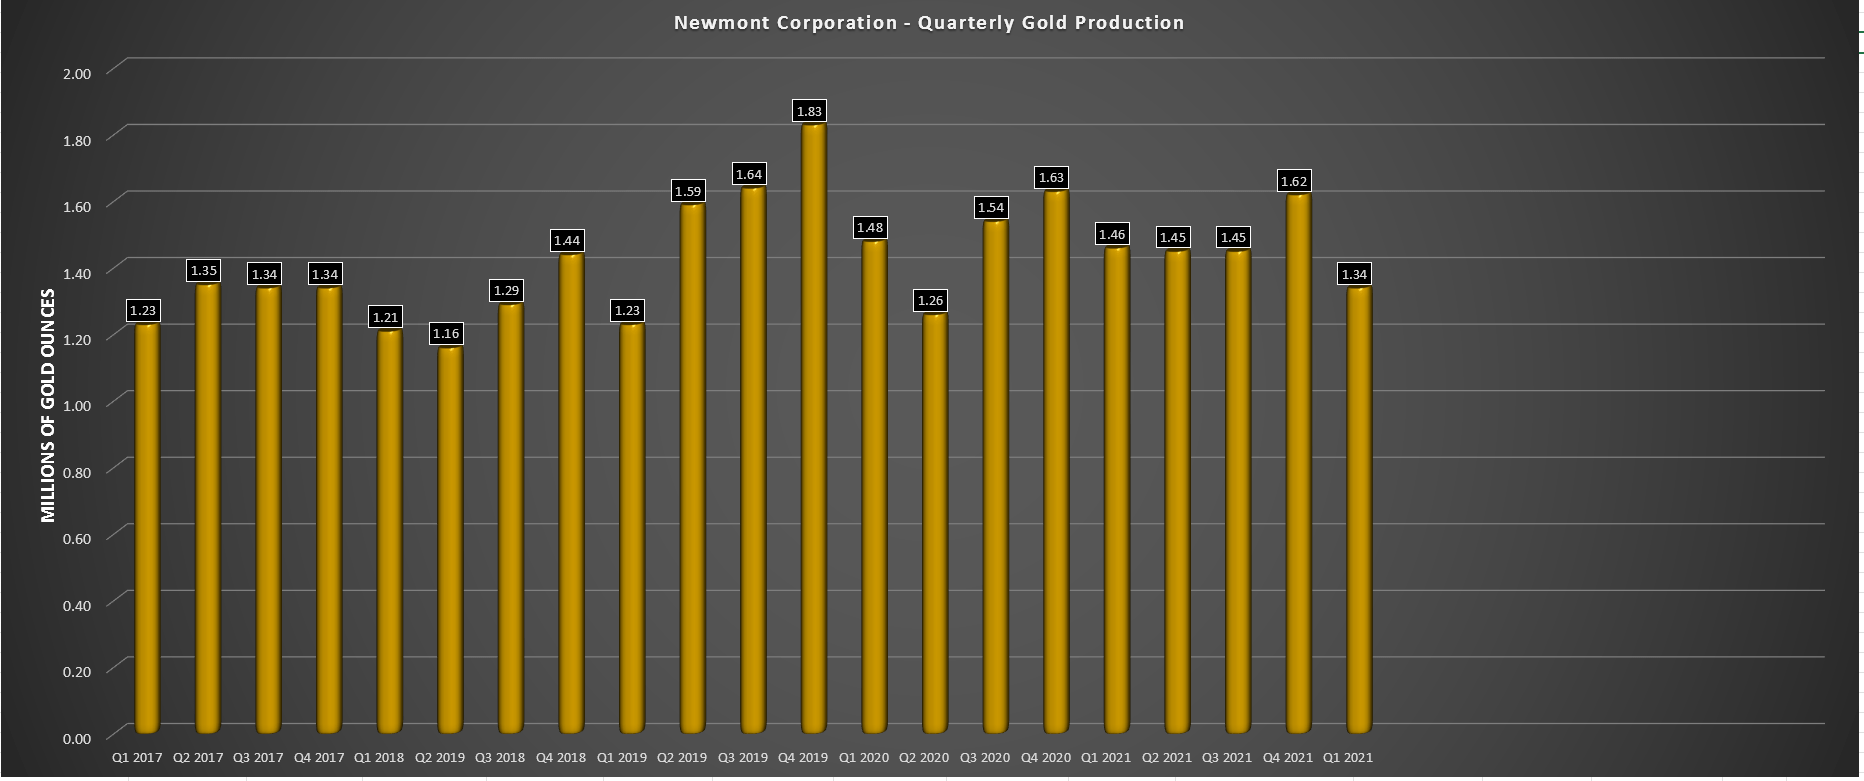
While this will provide a slight lift in production this year based on its increased ownership (~48% – 100%) of the mine, it will provide a massive boost in production later this decade. Notably, this production upside will come at industry-leading costs, with the project expected to add 500,000+ GEOs per annum at all-in sustaining costs below $800/oz (2027-2031). Meanwhile, there is the potential to extend the mine life well beyond 2040 with its second and third phases, and Yanacocha will also add copper production. Added exposure to this metal later this decade will provide a nice boost to Newmont’s production mix when copper prices continue to hover above $4.50/lb.
Yanacocha Production Profile (Company Presentation)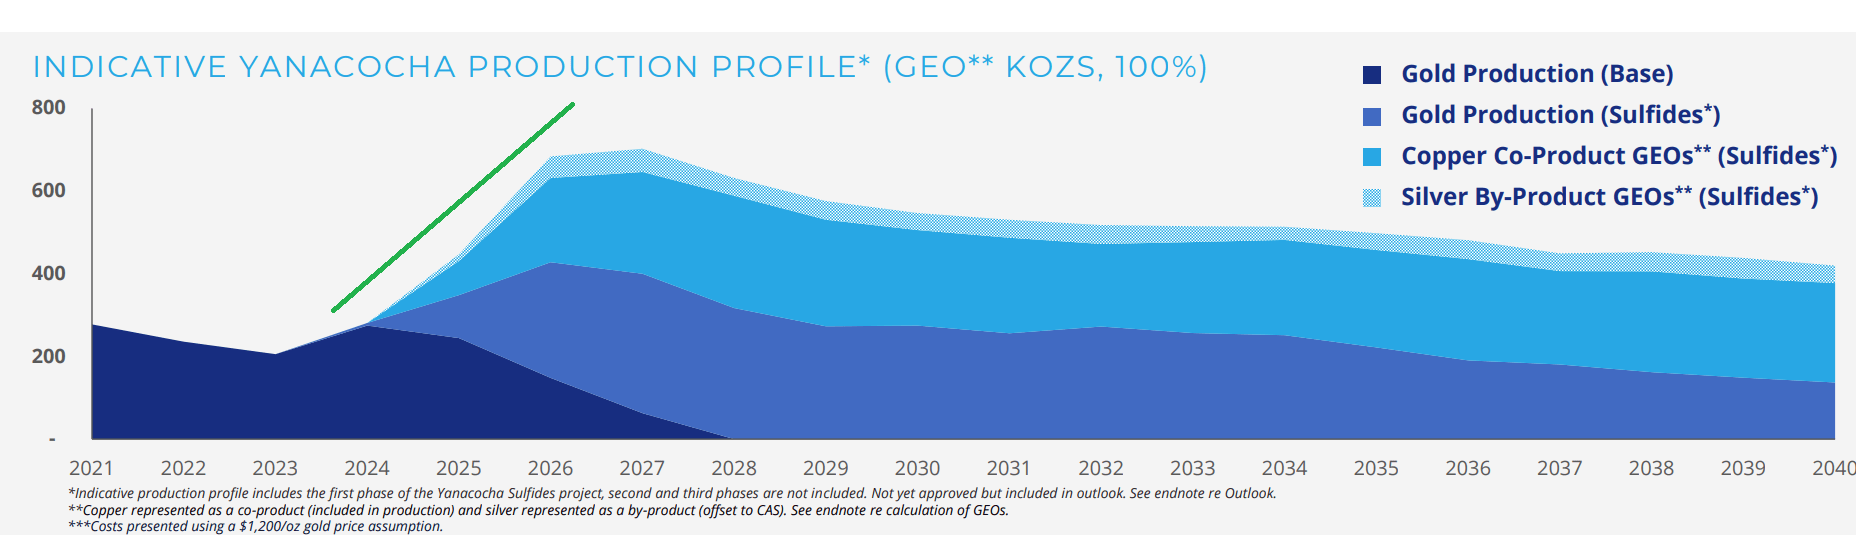
Circling back to the gold operations, all of Newmont’s operations saw lower production in Q1 on a year-over-year basis, except for its Boddington Mine in Australia and Cerro Negro in Argentina. At Cripple Creek & Victor in Colorado, production fell sharply to just ~35,000 ounces due to lower leach pad recoveries and less ore milled due to the mill shut down and temporary idling in the current year.
In Canada, at Musselwhite, Porcupine, and Eleonore, production fell more than 10% at each asset related to labor shortages due to COVID-19 (Musselwhite), lower grades and throughput (Porcupine), and lower grades and a build of in-circuit inventory compared to a drawdown in the prior year (Eleonore). Moving south to Mexico at Penasquito, production was 23% lower due to lower grades and lower recovery rates, partially offset by higher GEO production due to increased mill throughput.
Newmont – Quarterly Production by Mine (Company Filings, Author’s Chart)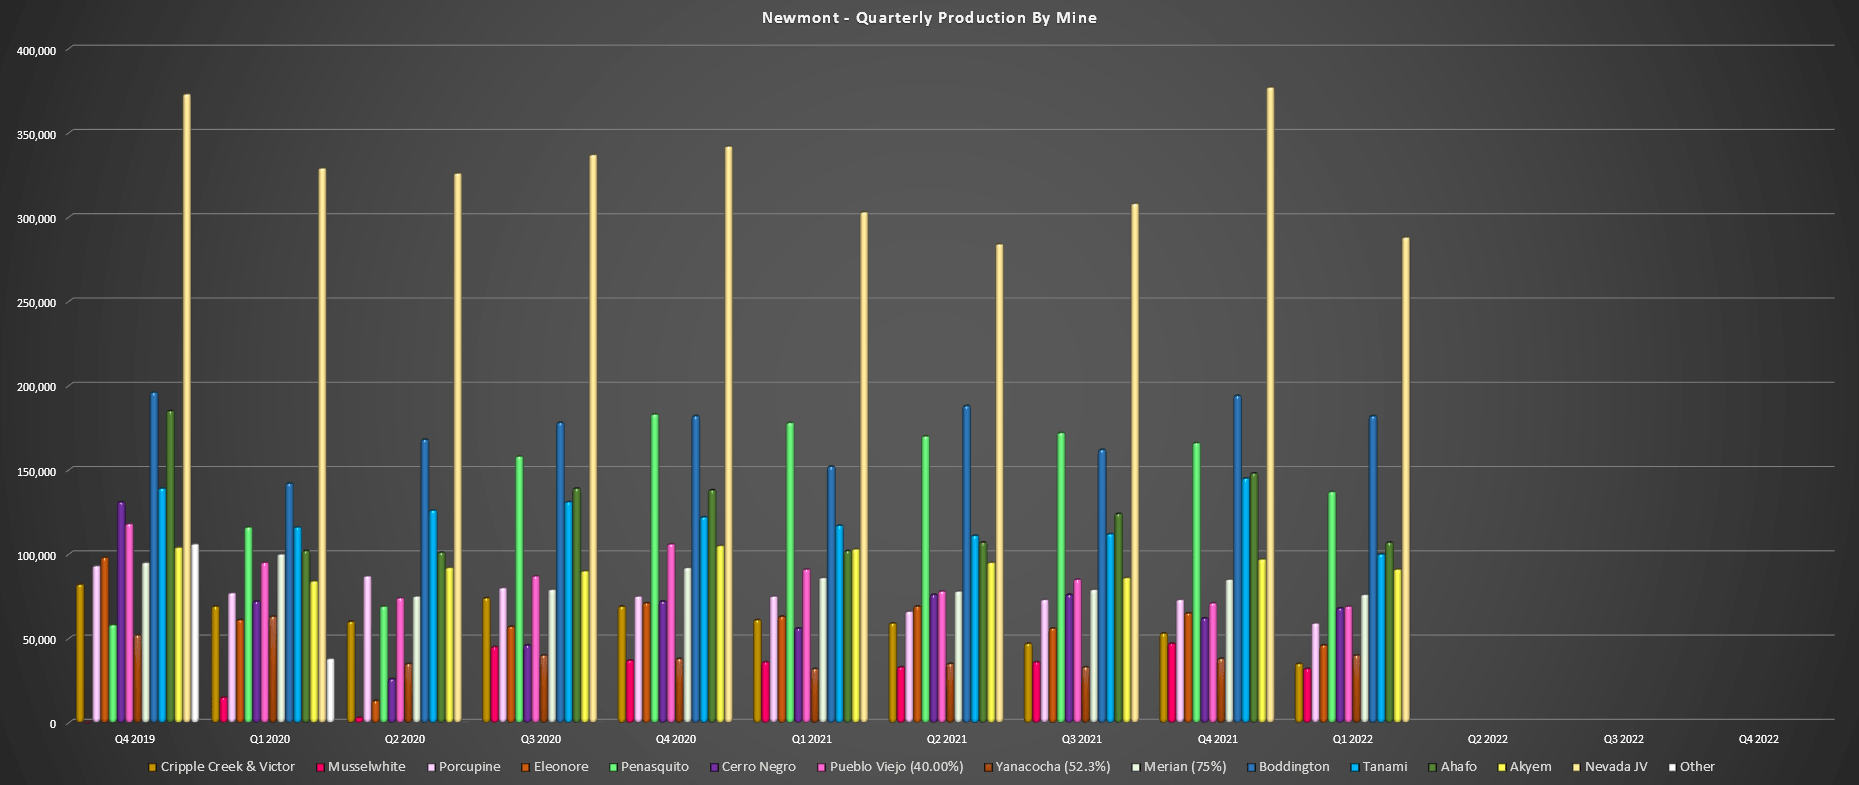
Elsewhere, in South America, production has rebounded nicely at Cerro Negro following a tough FY2020 due to COVID-19 headwinds, with four consecutive quarters of 60,000+ ounces produced. In Q1, the higher production (68,000 ounces vs. 56,000 ounces) was helped by higher grades milled. However, this was mostly offset by a much weaker quarter at Merian, with lower mill throughput and a drawdown of in-circuit inventory offsetting the higher grades in the period.
Finally, looking at two of the company’s two largest regions, Australia and the United States, results were mixed. In Australia, Boddington had an exceptional quarter, with production coming in at 182,000 ounces of gold, helped by higher grades, while GEO production also increased meaningfully. However, Tanami saw a 15% decline in production due to lower throughput, with just 100,000 ounces produced in Q1.
Nevada Gold Mines Operations (Barrick Presentation)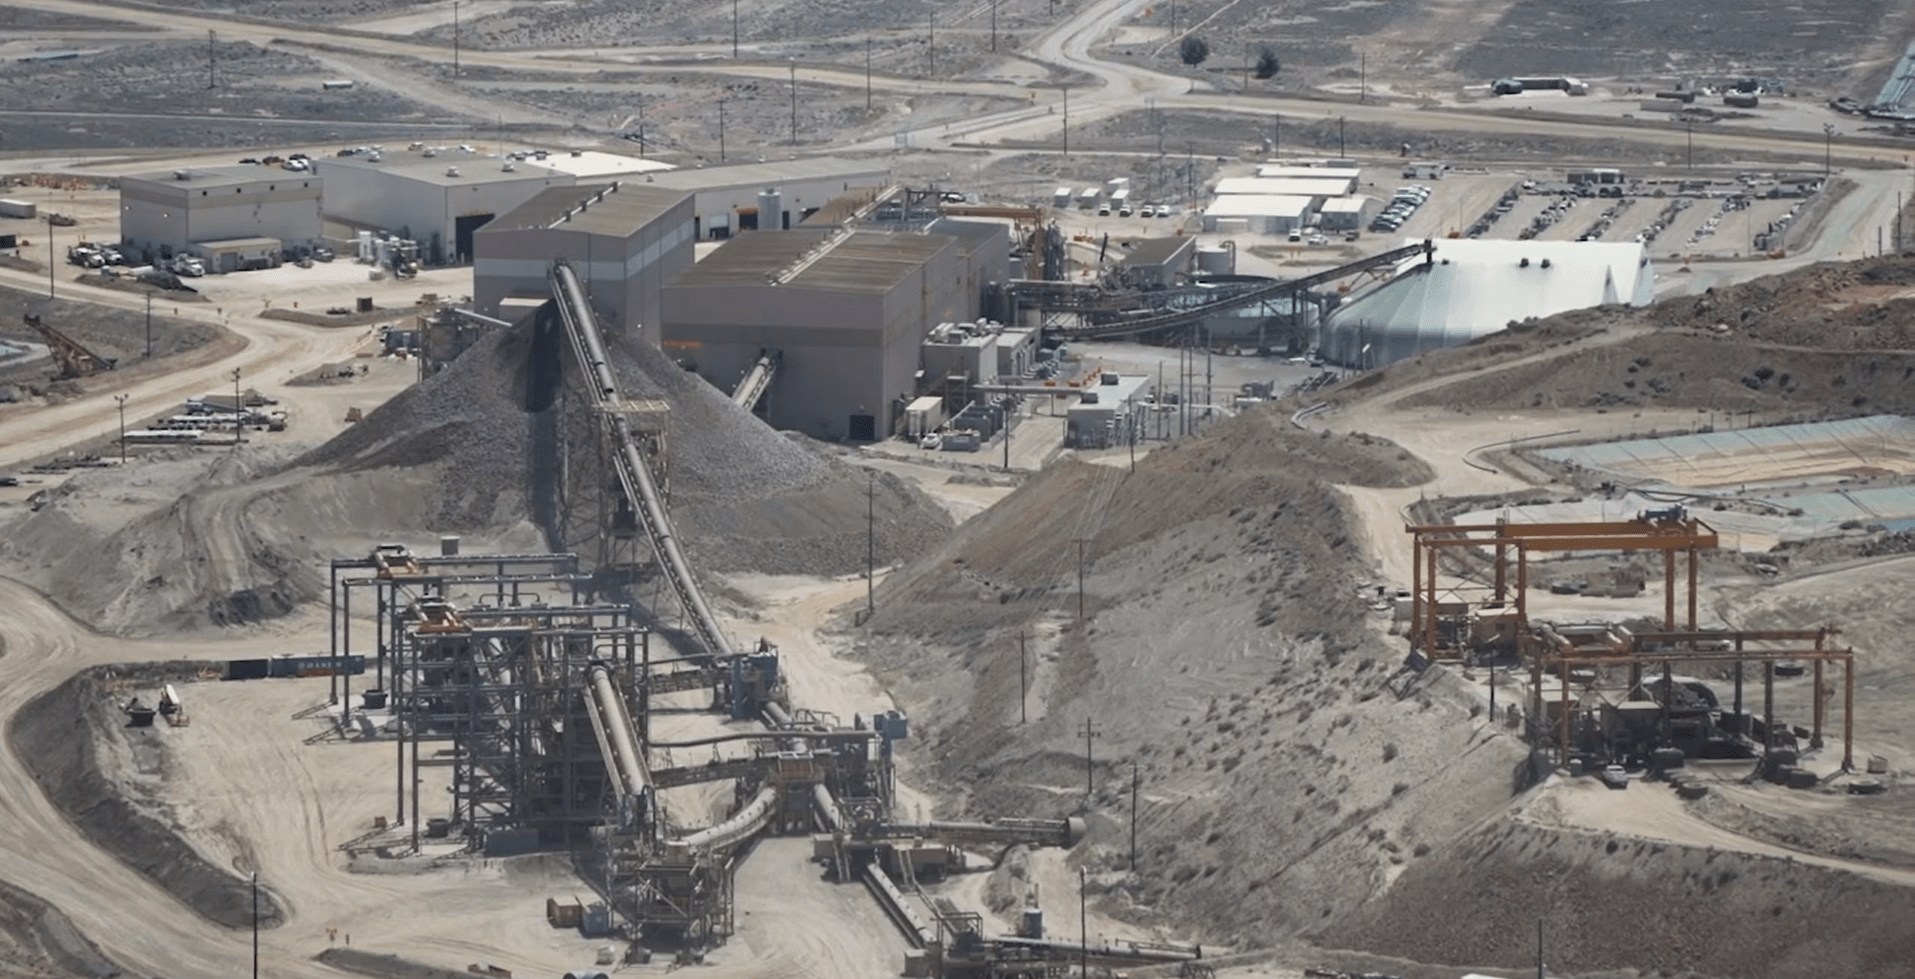
Meanwhile, at Nevada Gold Mines LLC, the joint-venture between Barrick and Newmont, Newmont’s attributable production came in at just ~288,000 ounces, down from ~303,000 ounces in Q1 2021. As discussed in my recent Barrick update, lower production was related to planned maintenance at Turquoise Ridge. On a sequential basis, the sharp decline in production (~288,000 ounces vs. ~377,000 ounces) at the Nevada operations was related to the depletion of stockpiled high-grade underground ore that was processed in Q4 following the mechanical mill failure last year.
Newmont – Quarterly GEO Production (Company Filings, Author’s Chart)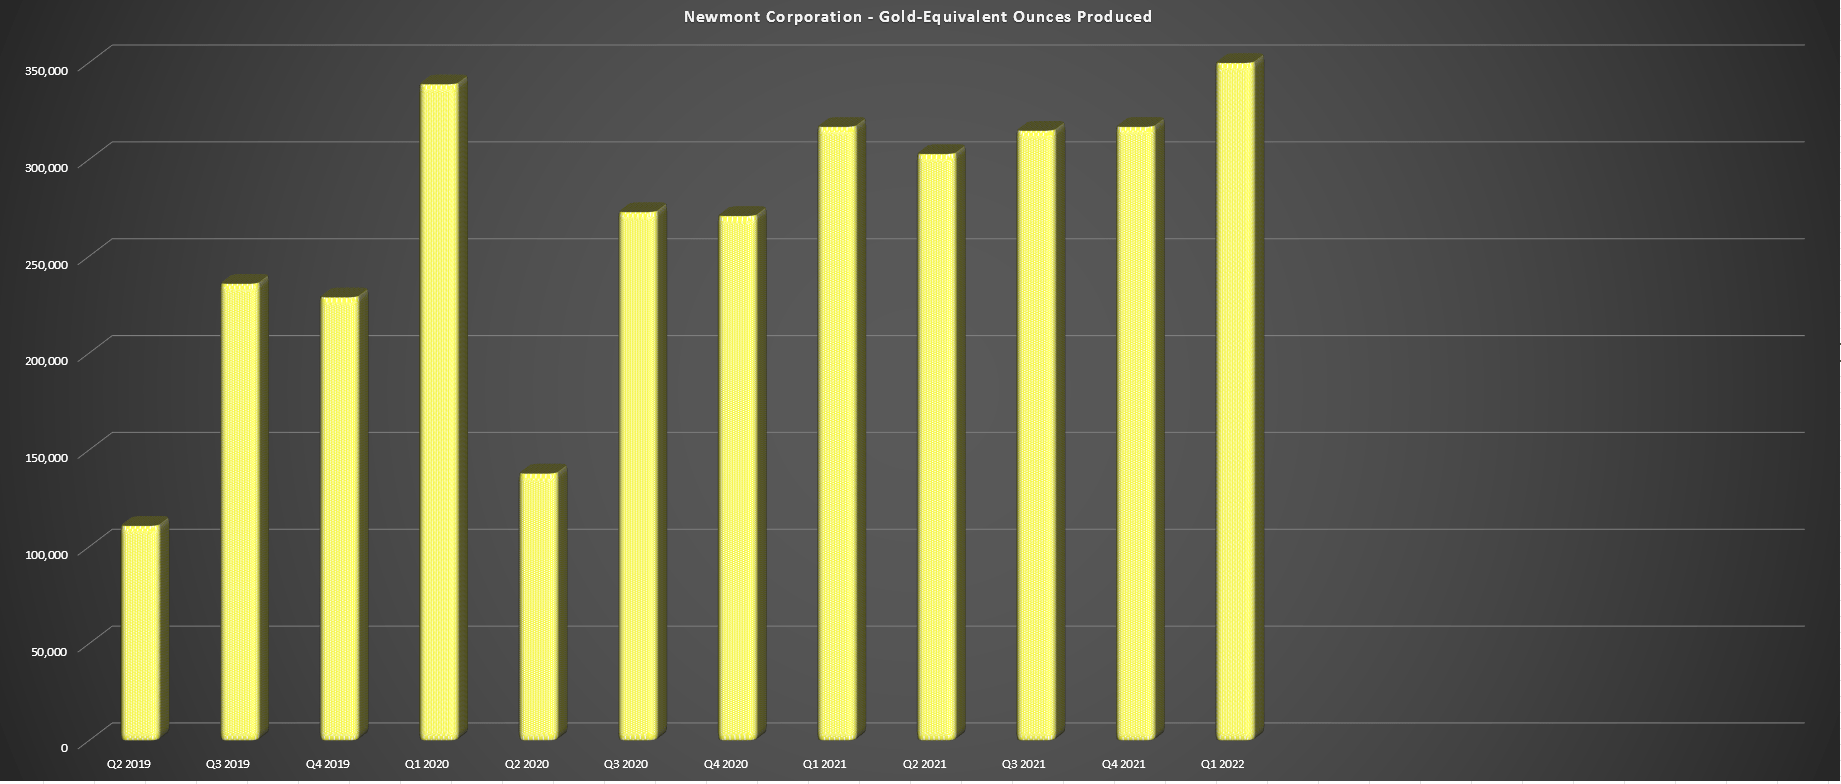
Fortunately, while gold production was lower, GEO production from co-products increased meaningfully (350,000 vs. 317,000 ounces) and continues to trend higher, a positive sign. This was related to higher production at both Boddington and Penasquito, with Boddington’s GEO production increasing nearly 60% to 51,000 GEOs in Q1 2022. When factoring in the 10% increase in GEO production, Newmont’s total production in Q1 was down roughly 5% to ~1.68 million ounces vs. ~1.77 million ounces in Q1 2021.
Costs and Margins
Moving over to costs, Newmont’s all-in sustaining costs per gold ounce came in at $1,156/oz vs. $1,039/oz in the year-ago period, a more than 11% increase. On a by-product AISC basis, we also saw a sharp increase with costs increasing to $1,036/oz from $936/oz in Q1 2021. Some of this is related to inflationary pressures, with rising fuel, consumables, and labor costs pushing costs higher for nearly all operations. This has not been helped by the rising diesel prices, which are up high double-digits on a year-over-year basis.
However, like other multi-million-ounce producers, Newmont differentiates itself. This is because it, and others, benefit from economies of scale, the ability to invest aggressively in technology and innovation, and large supplier networks that place it in a better position than its smaller peers to claw back any margin losses over the next few years. Some examples include pushing forward high-margin projects like Ahafo North with 300,000 ounces per annum of contribution in 2024 at sub $700/oz costs and investments in things like Autonomous Haulage at Boddington, and many other projects being considered to make operations leaner.
Newmont – All-in Sustaining Costs & AISC Margins (Company Filings, Author’s Chart)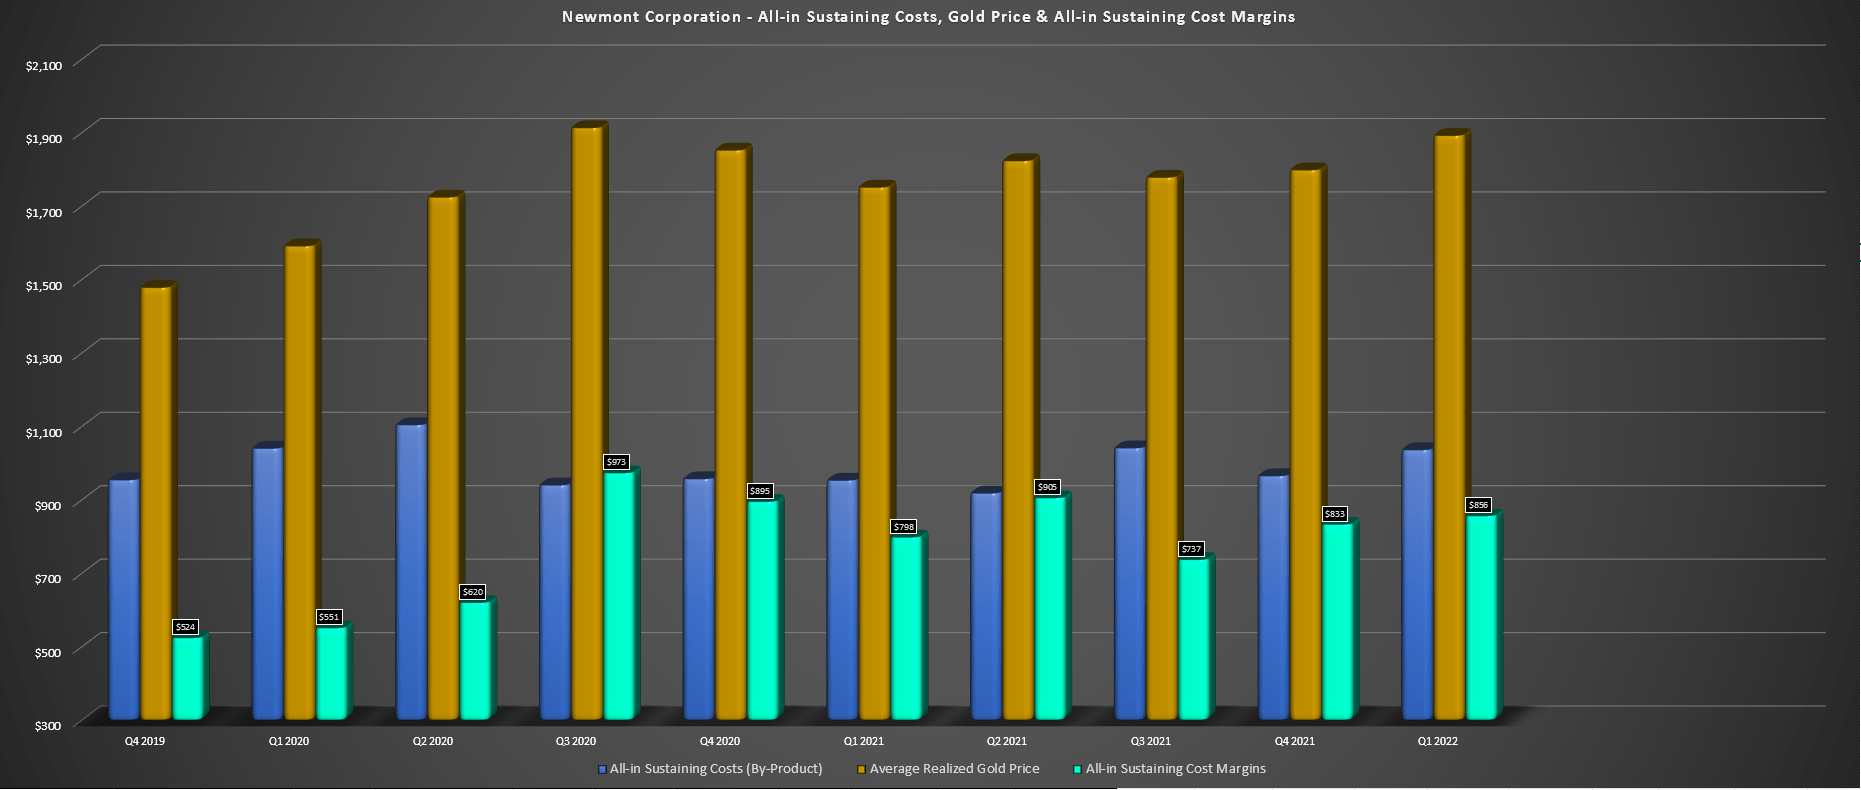
Fortunately, while costs were up, the gold price was also up sharply in Q1, coming in at $1,892/oz, a more than $110/oz increase from $1,751/oz in the year-ago period. This helped Newmont report slight margin expansion on a year-over-year basis, with AISC margins (by-product basis) coming in at $856/oz, up from $798/oz in Q1 2021. Given the strength in the gold price in Q2, and assuming the metal can stay above $1,900/oz for the remainder of the quarter, we should see another quarter of margin expansion, with an average realized gold price that’s likely to be at least $100/oz higher in the Q2 results (~$1,925/oz vs. ~$1,823/oz).
Newmont – Average Realized Silver/Copper Prices (Company Filings, Author’s Chart)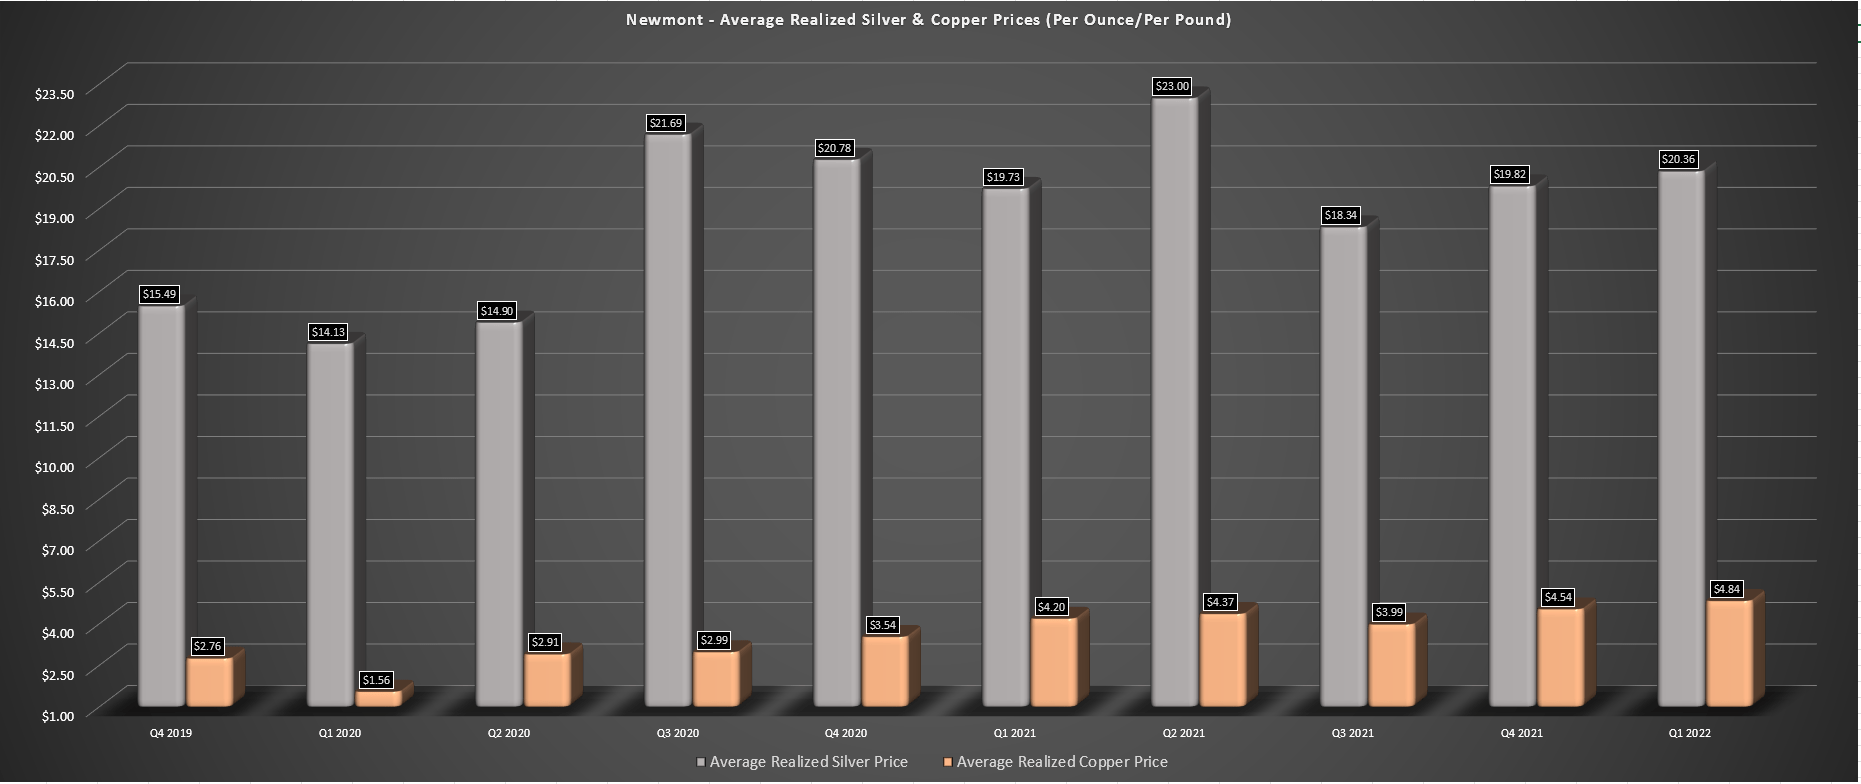
Finally, if we look at the company’s average realized silver, copper, and zinc prices, these are also trending in the right direction, with copper coming in at $4.84/pound and silver coming in at $20.36/oz. The major winner was zinc, though, which currently sits near $2.00/pound and clocked in at $1.75/pound in Q1 2021. Assuming strength in these metals continues from assets like Penasquito, this should help with costs with higher by-product credits from lead, zinc, and silver able to offset inflationary pressures, which look to be at least a 5% headwind this year.
Medium-Term Outlook
Looking at Newmont’s medium-term outlook, there might be some reason to be less optimistic given the cost increases if the outlook was for flat to declining production with little room to claw back costs. However, as noted, Newmont is expected to see rising production over the next several years, even if it’s only a moderate increase, helped by new projects like the Tanami Expansion, increased production from Yanacocha due to the consolidation of the asset, and Ahafo North. There’s further upside from the Cerro Negro District Expansion and Yanacocha Sulfides, with both projects also expected to have industry-leading costs.
Newmont – 5-Year Outlook (Company Presentation)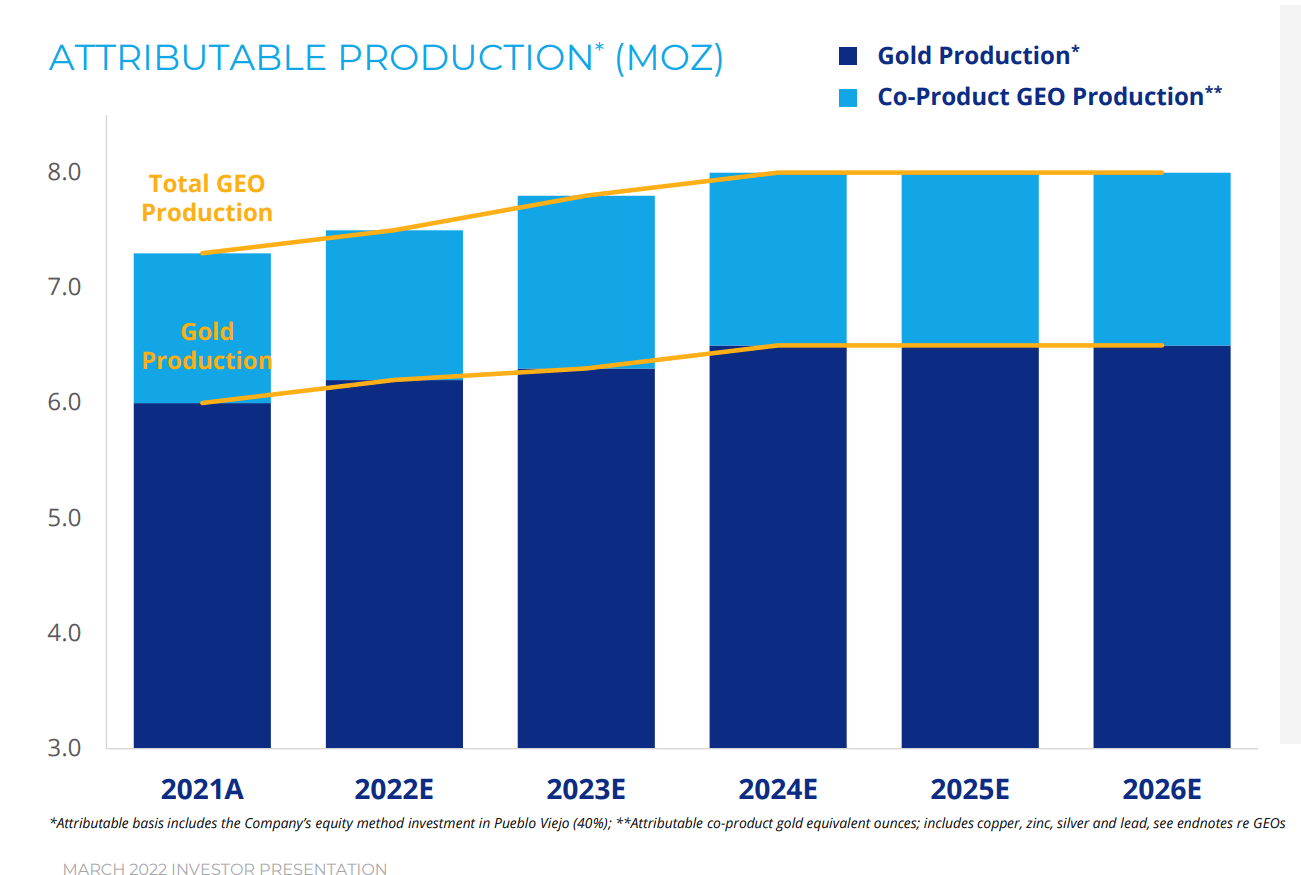
Finally, while Newmont didn’t grow reserves year-over-year if we exclude the non-organic growth from its consolidation of Yanacocha, it did hold the line more or less. This was a solid achievement, given that it maintained its conservative gold price assumption of $1,200/oz to calculate reserves.
With Newmont having a balance sheet that can easily support upwards of $300 million in exploration per year, a strong development pipeline, and the ability to meaningfully increase reserves just by adjusting to a $1,400/oz gold price, which is still extremely conservative, I don’t see any reason to worry about Newmont’s long-term production outlook.
Financial Results
While Newmont reported revenue of ~$3.02 billion, up 5% year-over-year, free cash flow fell to just $252 million, a more than 40% decline from the year-ago period. This was related to higher capital expenditures and lower operating cash flow, and it also dragged down Newmont’s trailing twelve-month free cash flow to just ~$2.4 billion. However, with production being back-end weighted and the gold price certainly being a tailwind, I would expect to see a significant improvement in free cash flow generation as the year progresses.
Newmont – Quarterly & Trailing-Twelve-Month Free Cash Flow (Company Filings, Author’s Chart)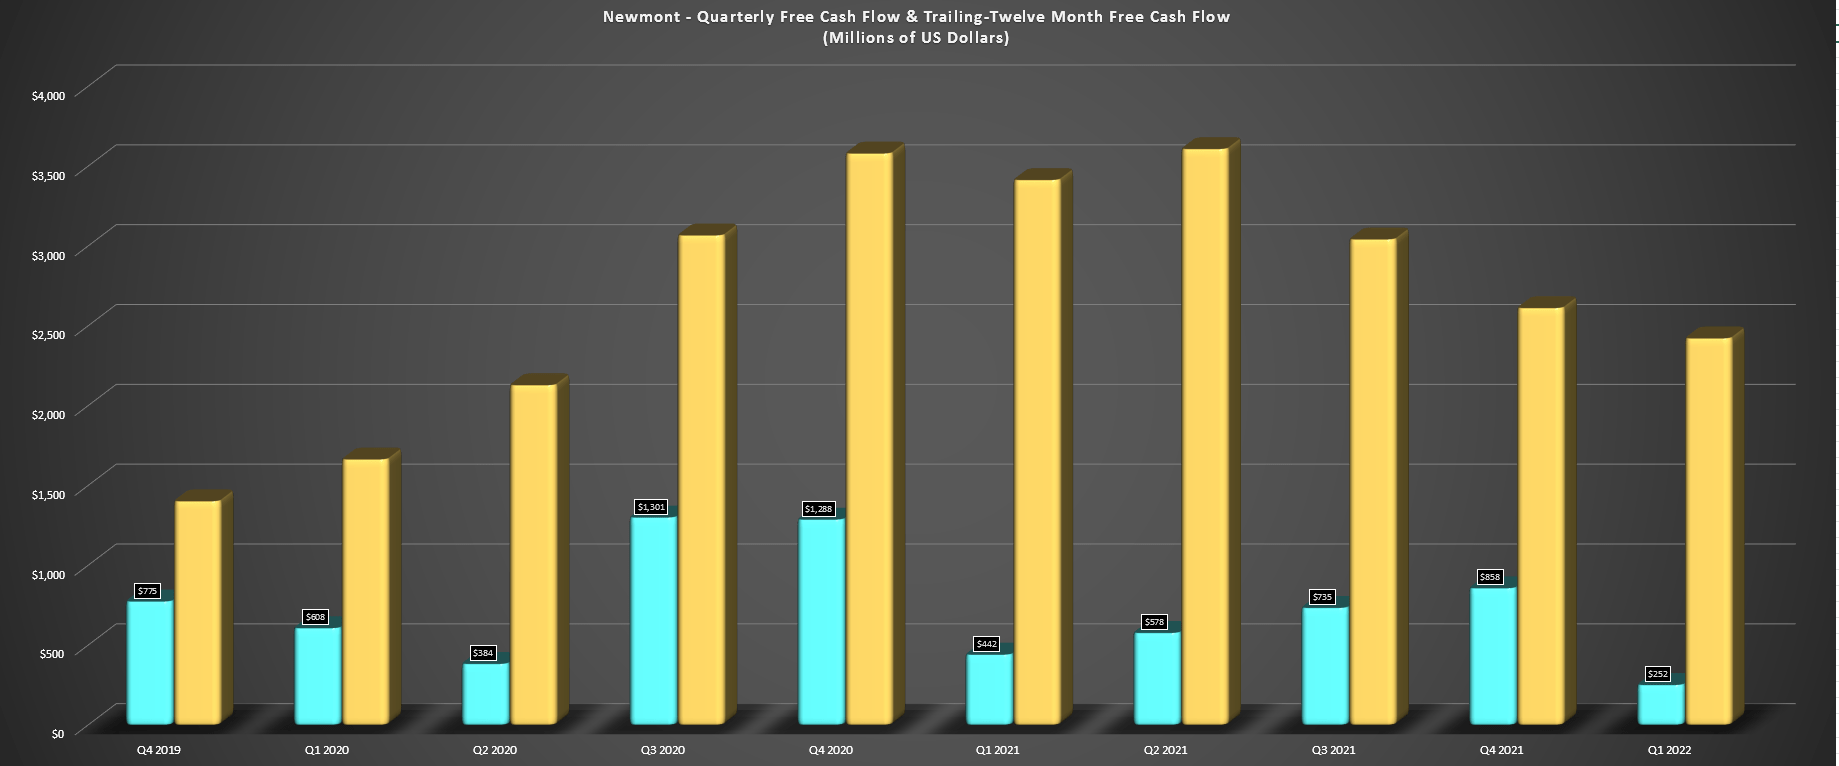
Moving over to earnings, Newmont reported quarterly earnings per share [EPS] of $0.69 vs. $0.74 last year, which was a little disappointing. However, assuming the gold price can continue to hang out above the $1,900/oz level, Newmont should be able to report at least $3.35 in annual EPS this year, which would translate to more than 10% growth on a year-over-year basis for the second consecutive year, and after lapping 100% growth ($2.66 vs. $1.32) in FY2020. Looking ahead to FY2023, I would not be surprised to see annual EPS come in north of $3.60. So, while it’s easy to get hung up on the decline in quarterly EPS in Q1, the earnings trend still remains quite solid on an annual basis despite this miss.
Newmont – Annual Earnings Trend & Forward Estimates (Company Filings, Author’s Chart)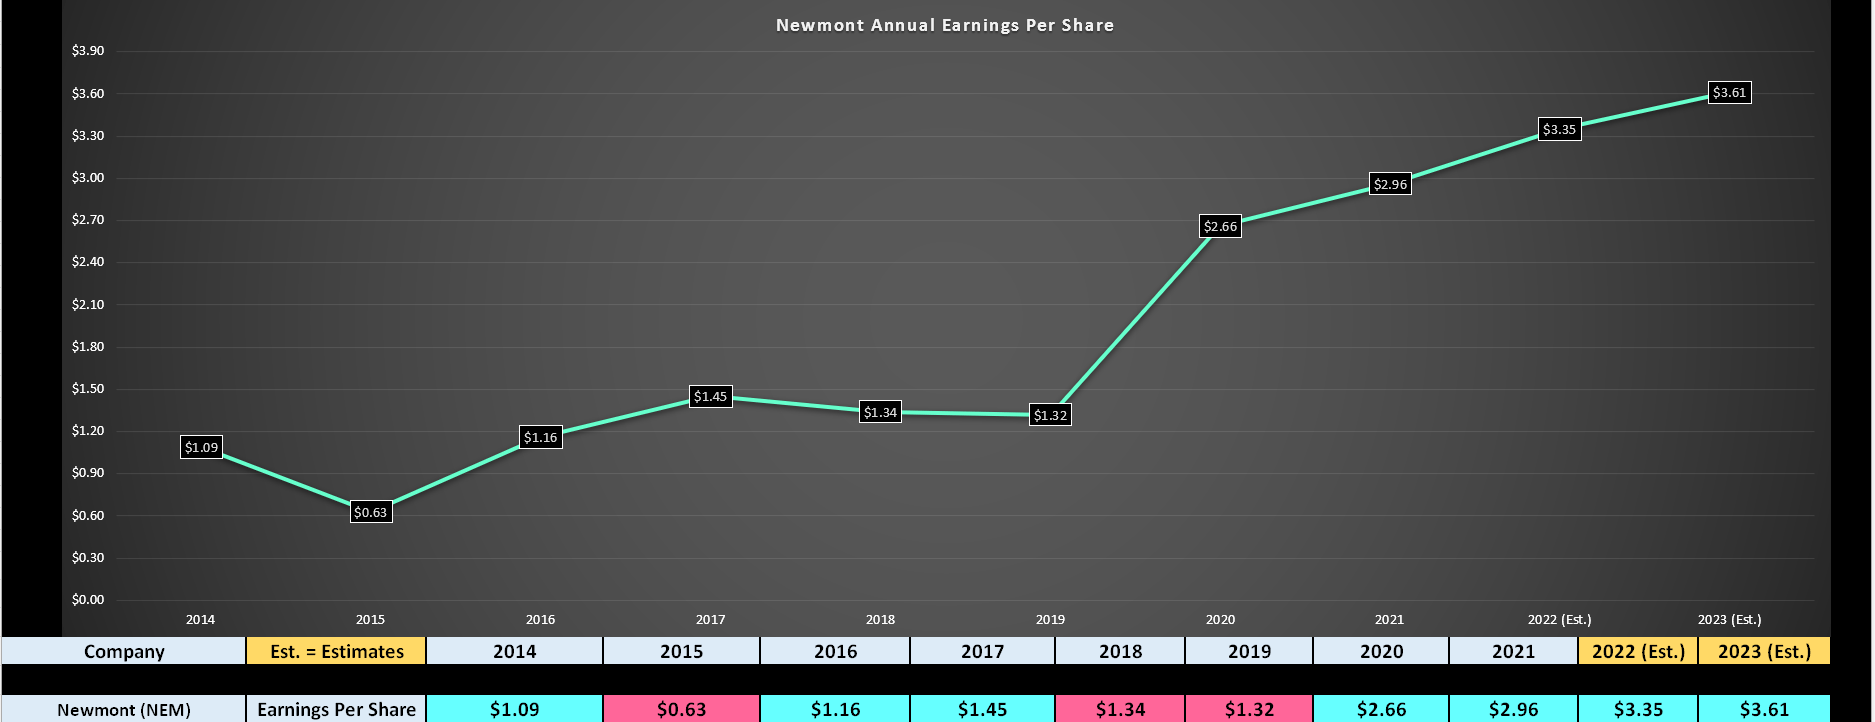
Valuation
Based on ~800 million shares outstanding and a share price of $78.00, Newmont is the largest gold producer by a wide margin, valued at ~$62.4 billion. This premium valuation certainly makes sense when considering that Newmont produces significantly more gold than its peer group (~6.0 million ounces per annum) and has a declining cost profile over the next few years. In addition, the company has a massive development pipeline, which includes Coffee, Akyem Underground, plus Cerro Negro District Expansions on the gold side, as well as Saddle North, and its Galore Creek Norte Abierto and Nueva Union joint-ventures on the copper side.
However, while the company has no peers from a size standpoint and has a high-quality business predominantly focused on Tier-1 jurisdictions, the stock is looking fairly valued after its more than 45% rally. This is because the stock is now trading at ~21.6x FY2023 earnings estimates, which is slightly above what I believe to be a conservative earnings multiple of 21, pointing to a conservative fair value of $75.80. The fact that Newmont is trading just above conservative fair value doesn’t mean that it can’t head higher, but it will need more help from the gold price to justify this or a boost to net asset value through an acquisition.
Newmont – Historical Earnings Multiple (FASTGraphs.com)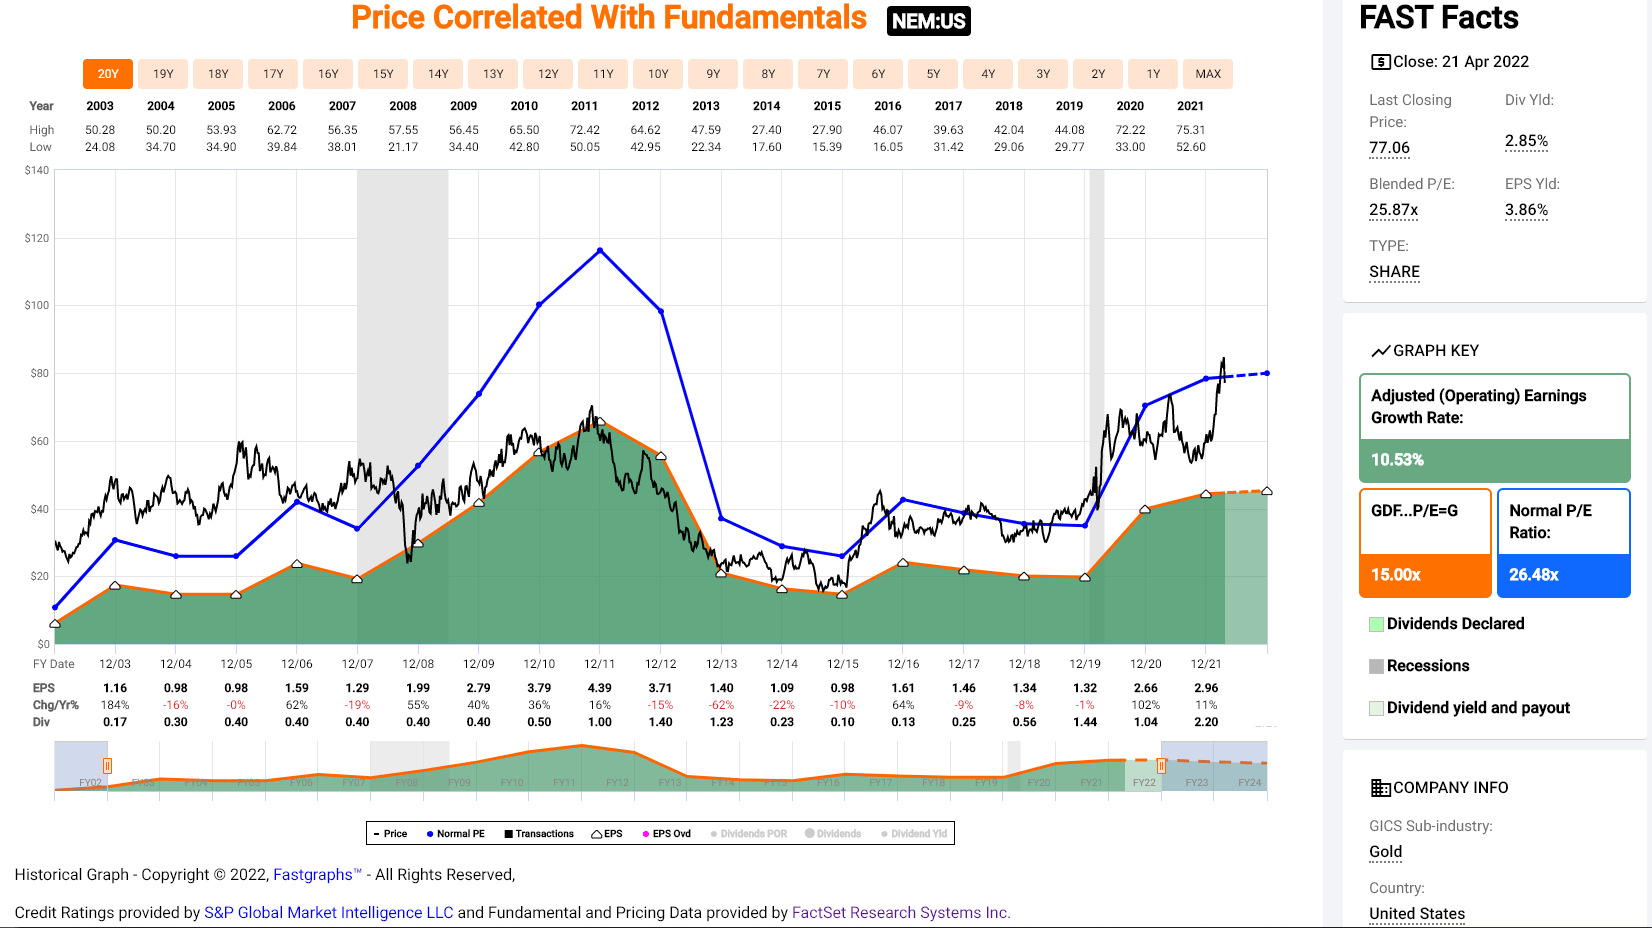
Some investors might argue that with the gold price trading in the upper portion of its 20-year range, Newmont can easily justify an earnings multiple closer to its historical average of 26. While I don’t disagree with this, I prefer to be conservative with my price targets to build a meaningful margin of safety into any new purchases and limit drawdowns as much as possible. So, while I think Newmont is easily a top-5 gold producer and a staple for a precious metals portfolio, I continue to see the stock as a Hold and currently favor million-ounce producers like Agnico Eagle (AEM) that trade at a discount to fair value.
Technical Picture
Moving to the technical picture, the below monthly chart corroborates that Newmont is nowhere near a low-risk buy zone, with the stock now more than 30% above its monthly moving average (pink line). I prefer to buy Newmont within 5% of this long-term support level, and this area came in at $58.00 or lower when I highlighted the stock multiple times last year. So, for Newmont to become more interesting from a technical standpoint, this moving average will need to play some catch-up, or Newmont will need to correct at least another 15% to move closer to this moving average.
Newmont – Monthly Chart (TC2000.com)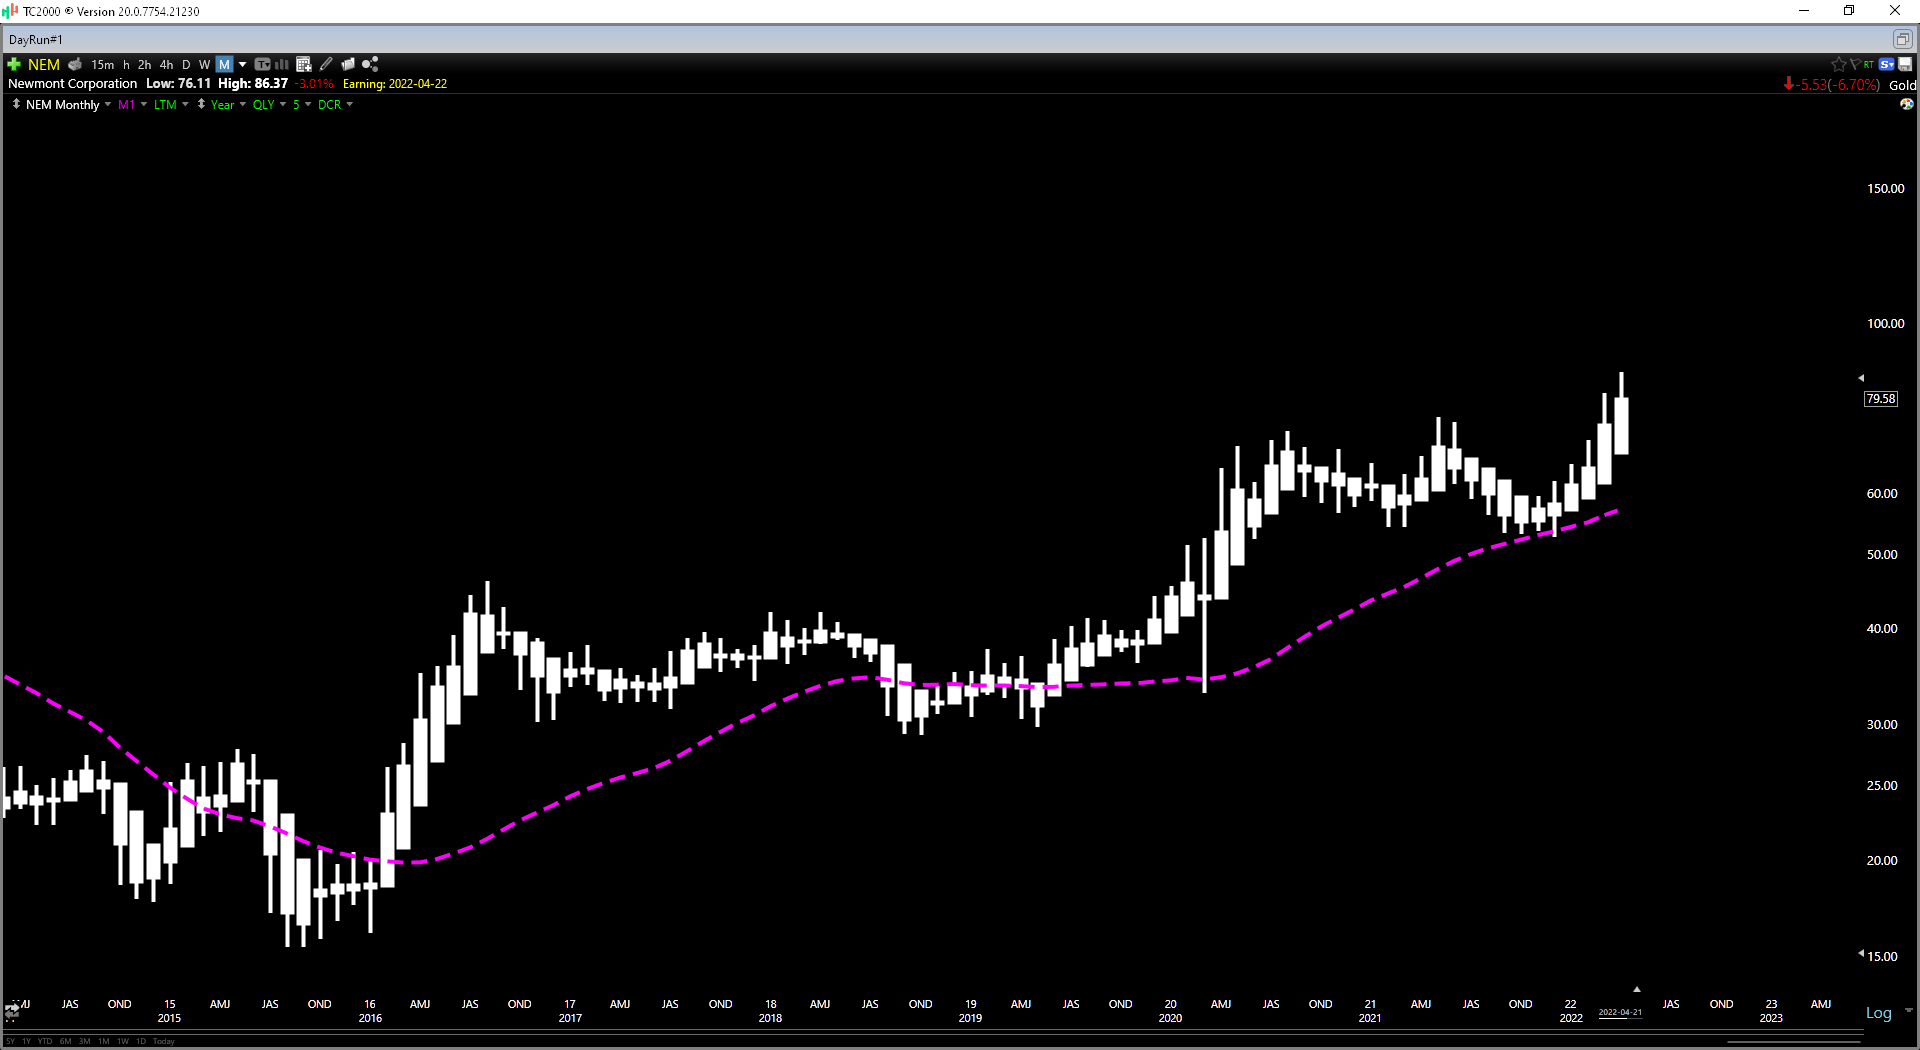
The good news is that with this moving average rising and Newmont making all-time highs, it’s one of the few S&P-500 (SPY) stocks in a clear weekly and monthly uptrend, suggesting an increasing probability of sharp pullbacks being bought up. Meanwhile, investors that purchased below $58.00 are sitting on a nearly 4% yield on cost, boosting returns even if the stock does go through a period of consolidation to set up another base for higher prices down the road. Given this industry-leading dividend yield and favorable technical outlook from a long-term standpoint, I continue to hold a position in the stock.
Newmont Gold Pour (Company Presentation)
Newmont’s had a satisfactory Q1 report, producing ~1.34 million ounces of gold and benefited from much higher metals prices in the period. However, with the stock running up considerably into the report, I would argue that even a beat was priced into the stock, which did not favor being overweight the stock heading into the report. The good news is that with a favorable outlook for gold, given the position of real rates, and an improving cost profile with growing production, Newmont has a very bright future. So, if we were to see some weakness in what’s seasonally a softer period for miners, I would view sharp pullbacks in the stock as buying opportunities.
Be the first to comment