

Enes Evren
It’s been several weeks since New York Community Bancorp (NYSE:NYCB) reported its Q3 earnings. Despite the slight miss, Q3 was relatively good as revenue, net income, loans, and deposits all increased in the TTM from Q2. Since earnings, NYCB received approval from the Office of the Comptroller of the Currency (OCC) for the acquisition of Flagstar Bancorp (FBC), and most recently, the Federal Reserve approved the acquisition. Going into the acquisition, shares of NYCB look to be undervalued compared to its peers. I believe there is long-term value within shares of NYCB, which are yielding over 7%. I think shares are still attractive as the merger will place the combined entity in a position where it will have over $87 billion in assets and operate nearly 400 traditional branches in nine states and 87 loan production offices across a 28-state footprint. I plan on adding more NYCB going into the end of the year and believe the market will be receptive to shares after the deal closes, and combined earnings reports will illustrate the positive synergies which will take place.
Seeking Alpha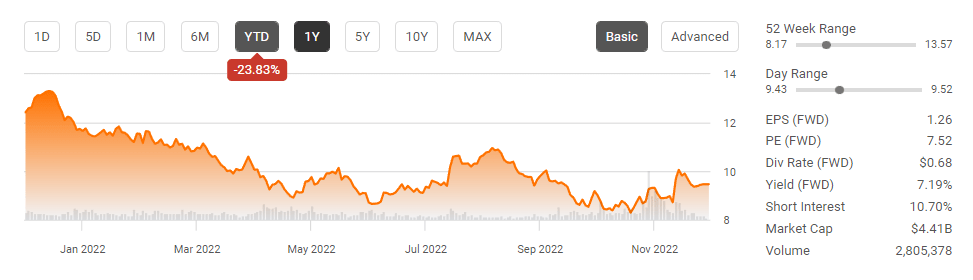
NYCB slightly missed estimates in Q3, but it wasn’t a bad quarter by any means.
NYCB’s Q3 results came in with a miss on the top line by $11.48 million $0.01 on the bottom line. NYCB’s diluted GAAP EPS was $0.30, which was unchanged YoY, and if you were to exclude the acquisition-related expenses on a non-GAAP basis, diluted EPS came in at $0.31, which is also unchanged YoY. NYCB generated $152 million of net income, an increase of 2% YoY, while $144 million of net income available to shareholders increased 3% YoY. NYCB’s net interest income increased by $8 million to $326 million, which was a 3% increase YoY. Over the past 9 months, NYCB has generated $478 million in net income, up 7% YoY, of which $453 million was available to shareholders, an increase of 8% YoY. Shares of NYCB have continued to decline throughout 2022, yet progress is being made, and on a TTM basis, NYCB has generated its largest amount of net interest income and net income in a decade.
NYCB’s loans held for investment increased 9% to $49 billion since the end of 2021 and increased $447 million in Q3. NYCB’s multi-family loan business increased $2.6 billion, which was a 10% annualized increase compared to 2021. QoQ multi-family loans increased by $407 million QoQ. NYCB’s specialty finance loans grew $117 million QoQ and reached $4.3 billion, which is a 29% annualized increase compared to 2021. NYCB’s net loans increased by $445 million to $48.77 billion QoQ which is the bank’s largest level in a decade. NYCB has also taken in its largest level of deposits at $41.7 billion, which increased by $461 million QoQ. NYCB’s deposit growth has been fueled by its Banking as a Service ((BaaS)) initiatives as BaaS deposits represent $7.9 billion or 19% of its total deposits.
Financials haven’t done well in 2022, and shareholders of NYCB have seen its share value slashed by -23.83% YTD. This is where I like to add to my position as NYCB is delivering more revenue, net interest income, and net income to shareholders. When I look at NYCB compared to its peers, I see an undervalued company that doesn’t include what the company will become after the FBC acquisition is completed. With a dividend yield that exceeds 7%, I think NYCB is an interesting play, as there could be significant upside in the future.
The Flagstar Bancorp gets approved by both the OCC and the Federal Reserve
Back in April of 2021, NYCB announced its plans to acquire FBC in an all-stock merger. The merger plans had been extended in April of 2022, and extended the merger agreement to October 31st, 2022, while amending the merger agreement to provide that the combined company’s ongoing banking operations will operate under a national bank charter. This was interesting in my eyes because it opened up many possibilities. Both entities agreed that a national bank charter is the correct charter for the combined banking operations due to FBC’s national mortgage banking business. On November 7th, NYCB and FBC announced that NYCB has received regulatory approval from the Federal Reserve Board to complete its previously announced acquisition of FBC. This followed the announcement of regulatory approval from the Office of the Comptroller of the Currency to convert FBC to a national bank and merge NYCB into its operations. There are no further regulatory approvals required to complete the acquisition, and it’s expected to close on 12/1/22.
New York Community Bank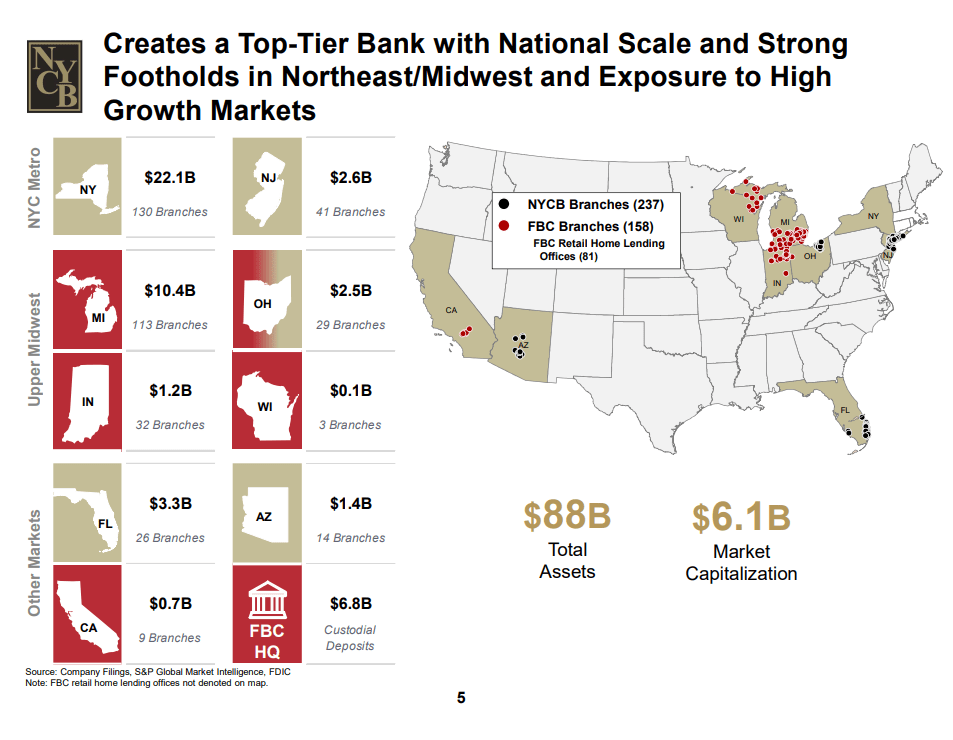
Once the acquisition and merger are complete, it will create one of the largest regional banks in the country, with 395 branches across 9 states. The new entity will have a robust footprint in the Midwest and Northeast, while its operations in the Southwest will provide exposure to growth markets throughout the opposite side of the country. Through FBC’s mortgage operations, the new entity will operate on a national scale through 81 retail home lending offices in 26 states and a wholesale network of approximately 3,000 third-party mortgage originators.
In April 2021, NYCB released a statement about the deal. FBC shareholders will receive 4.0151 shares of NYCB stock for each FBC share owned. NYCB shareholders will represent 68% of the combined company, while FBC shareholders are expected to represent 32%. The transaction was projected to increase NYCB’s EPS by 16% and its tangible book value by 3.5% in 2022 if all of the cost savings were phased in. We will have to wait until 2023 to see how the financials are impacted. The combined synergies a top-tier regional bank and enhances capital generation. For income investors, NYCB’s current dividend of $0.68 will be maintained, and the capital generation after the dividends are paid is expected to be roughly $500 million.
NYCB’s current shares prior to the merger look undervalued compared to its peers
I will be comparing NYCB to the following companies:
- TFS Financial Corporation (TFSL)
- WSFS Financial Corporation (WSFS)
- Columbia Financial (CLBK)
- Huntington Bancshares Incorporated (HBAN)
- Citizens Financial Group (CFG)
- KeyCorp (KEY)
TFSL, WSFS, and CLBK are considered thrift banks and were some of NYCB’s largest competitors that were actual banks in the thrift financial sector. Since there weren’t many comparable thrift banks by market cap to NYCB, I added some of the well-known regional banks for this comparison. Similar to my other bank articles, I will look at the following metrics:
- Price to Earnings P/E
- A company’s P/E ratio is important in comparing with similar firms in the same industry.
- Price to Book P/B
- P/B ratios are commonly used to compare banks, because most assets and liabilities of banks are constantly valued at market values.
- Loan Deposit Ratio LDR
- indicates the bank’s liquidity.
- Equity to Market Cap
- Valuation the market has placed on the company’s equity
- Tangible book value to market cap
- tangible book value excludes the value of intangible assets such as goodwill. Intangible assets such as goodwill are not as easy to liquidate as tangible assets, and even though they have value, I believe finding the tangible book value is a more realistic measure of a company’s value. I wanted to see how the tangible book value compared to each company’s market cap.
- Dividend Yield and Payout Ratios
- Amount of earnings each company pays per share through its dividend and how much of its earnings are paid
- % difference between tangible book value and share price
- Indicates if the market is placing a positive multiple on a company’s equity of discounting it
- Premium to Book
- Premium to Tangible Book Value
- Discount to Tangible Book Value
NYCB is trading at the lowest P/E ratio of its peer group. The group’s average P/E is 16.44, and NYCB is trading at a P/E of 7.51.
Steven Fiorillo, Seeking Alpha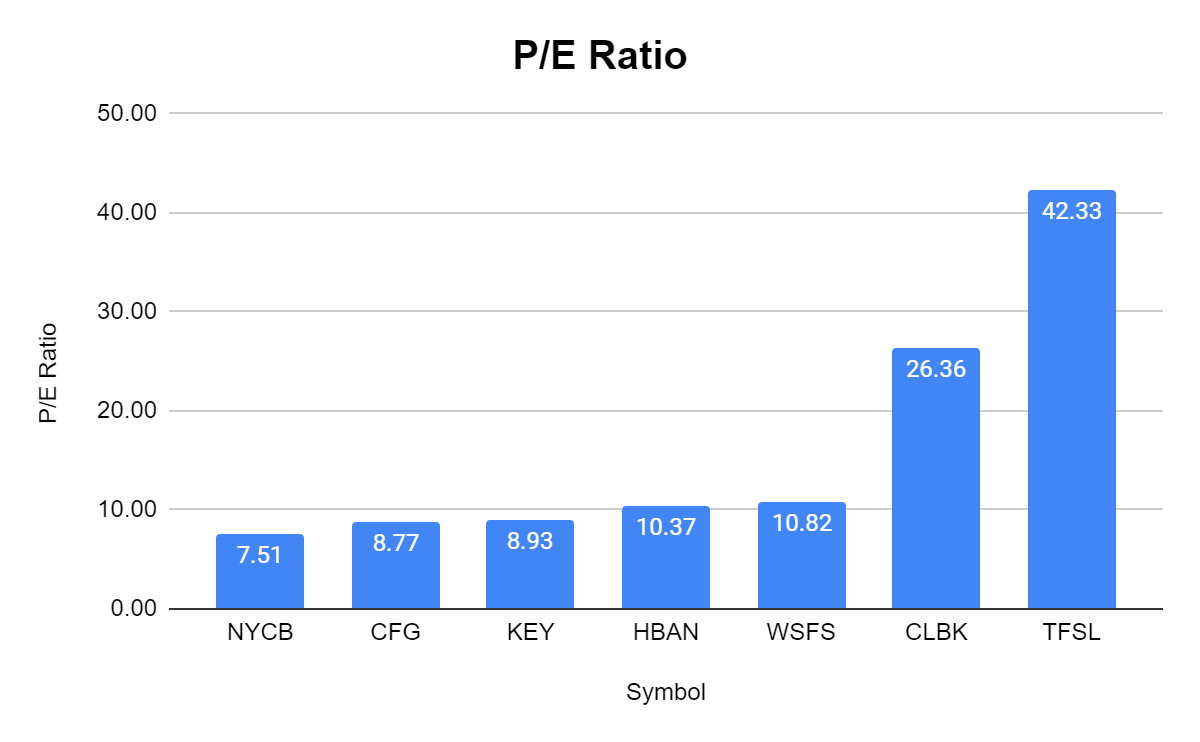
NYCB also has the lowest P/B Ratio at 0.71x compared to the peer group average of 1.52x. The only other bank that has a P/B under 1 is CFG at 0.98x. There are 2 banks with P/B ratios over 2x.
Steven Fiorillo, Seeking Alpha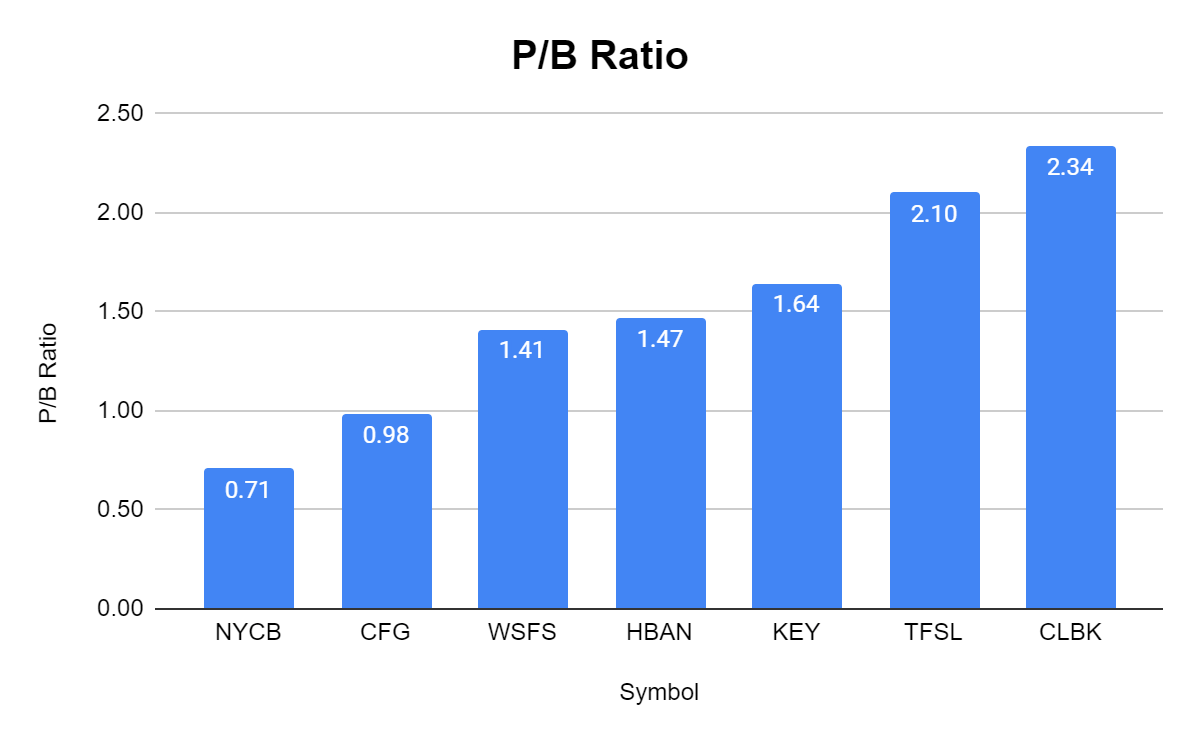
While NYCB has increased its loans and deposits, its LDR ratio is the same as Q2 at 1.17x, which isn’t great as its levered. Based on FBC’s balance sheet, the combined entity would add $16.59 billion of deposits and $15.67 billion of loans which would bring the LDR ratio down to 1.11x, but at the end of the day, there is some work to be done to get this level under 1x.
Steven Fiorillo, Seeking Alpha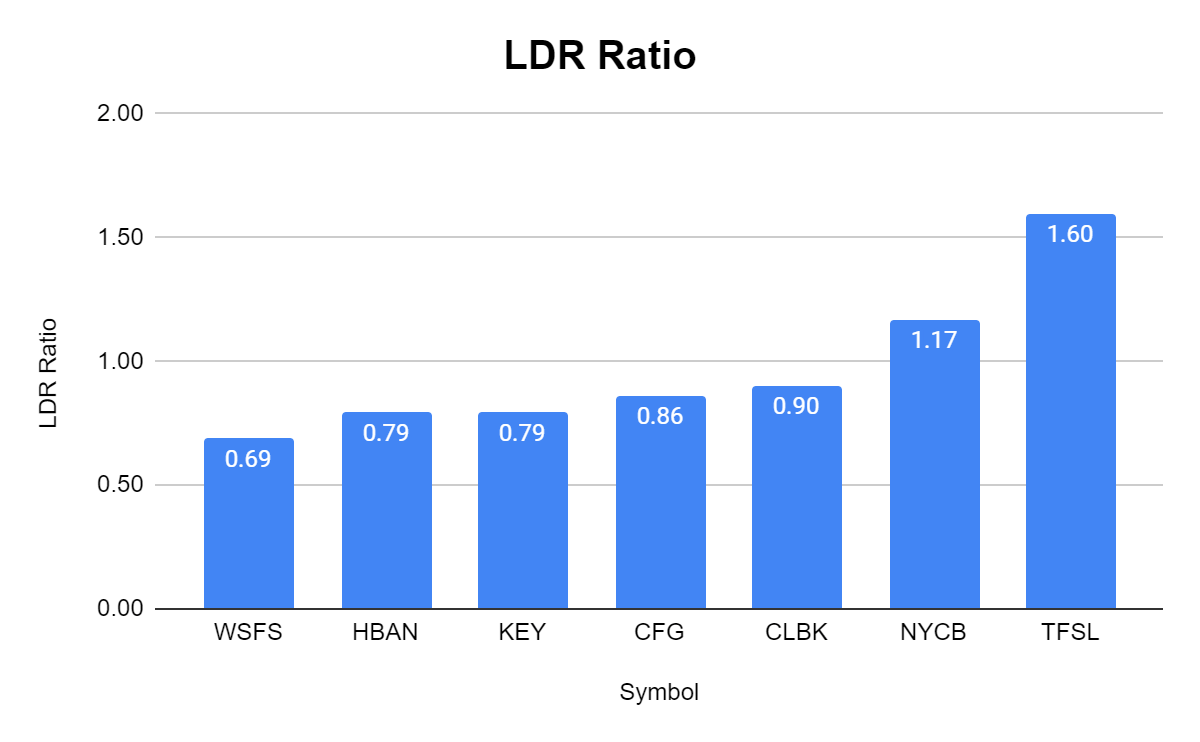
NYCB still looks like it’s trading at a discount considering its equity. NYCB has 152.98% of its market cap in equity on its balance sheet. Of the 7 banks I selected, 5 of them trade at a premium to equity, while CFG and NYCB trade at discounts.
Steven Fiorillo, Seeking Alpha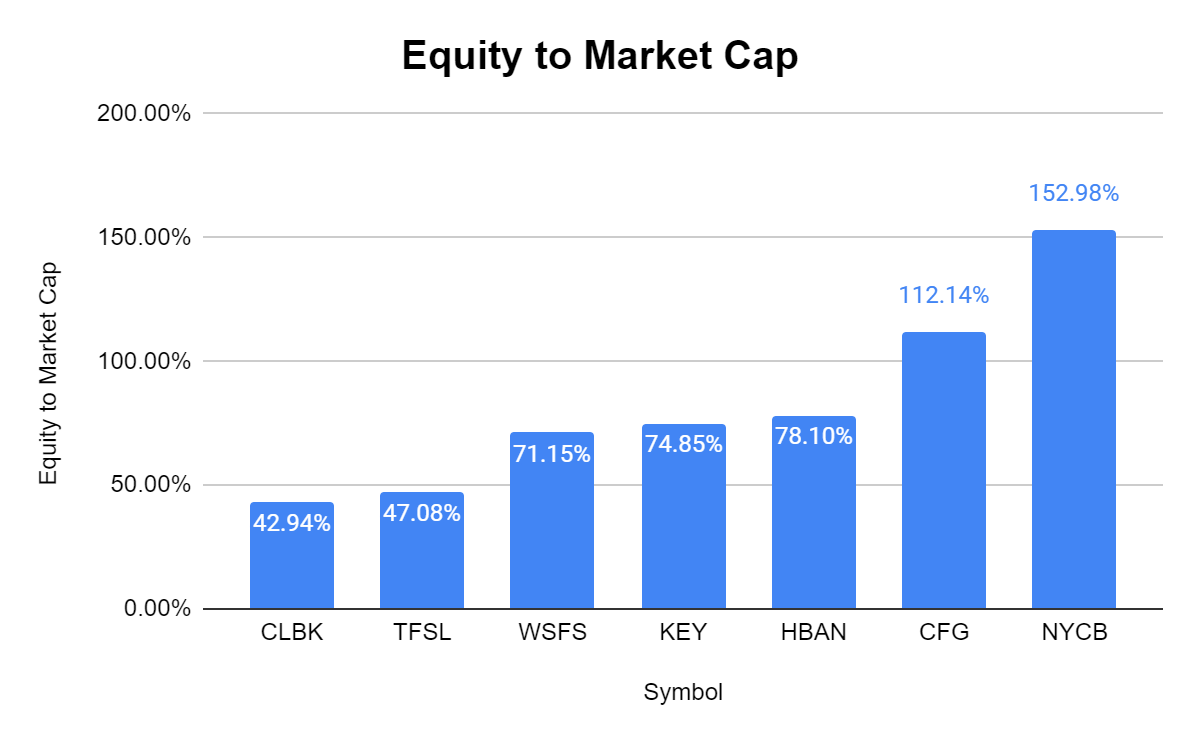
NYCB has 86.56% of its market cap in tangible book value on its balance sheet. The peer group average is 51.12%, and the closest company to NYCB is CFG, with 62.85% of its market cap in tangible book value. The market is significantly discounting NYCB to its peers in this aspect.
Steven Fiorillo, Seeking Alpha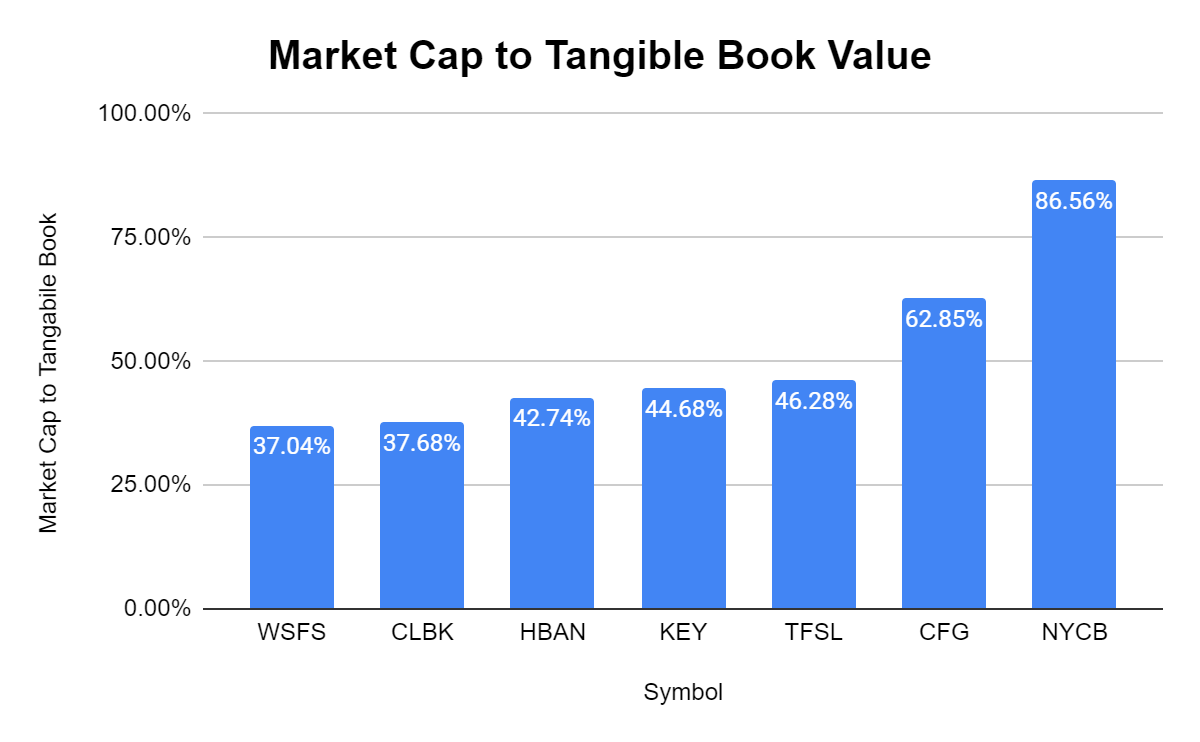
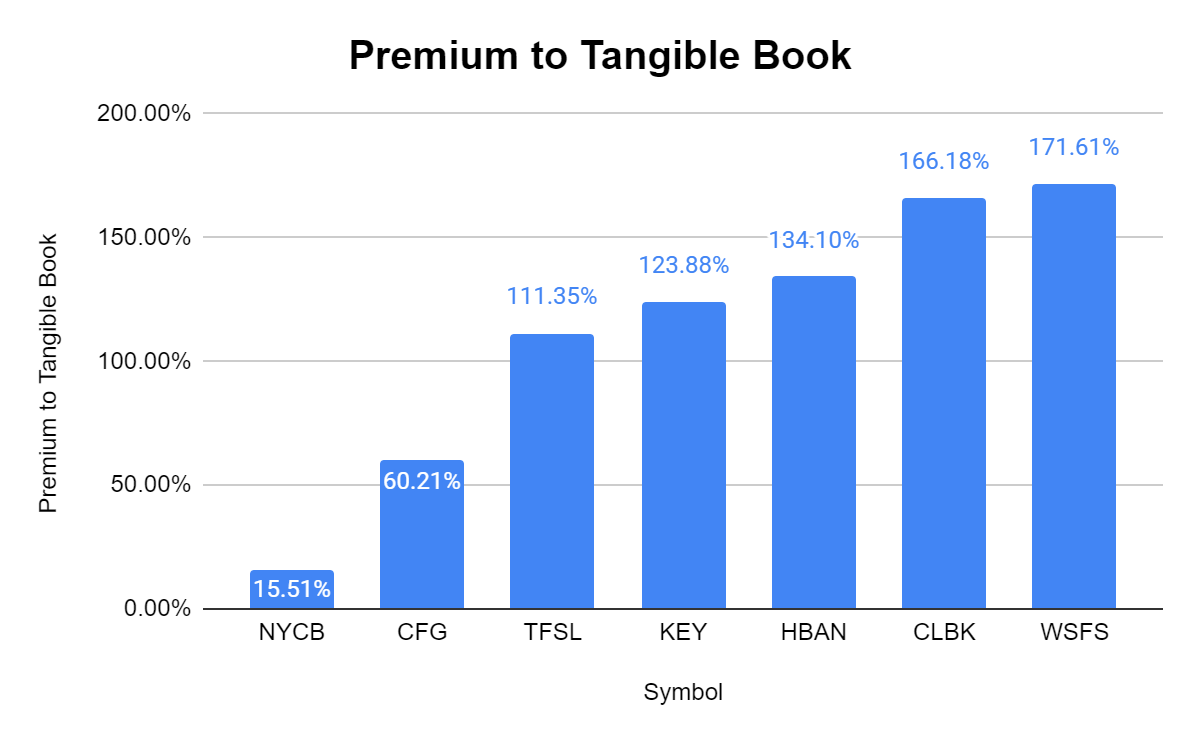
The market is currently discounting NYCB at -29.35% of its book value while giving more than a 100% premium to TFSL and CLBK. The peer group average is a premium of 52.15%. NYCB trades at a 15.51% premium to tangible book value, while the peer group trades at an average premium of 52.15%.
Steven Fiorillo, Seeking Alpha Steven Fiorillo, Seeking Alpha
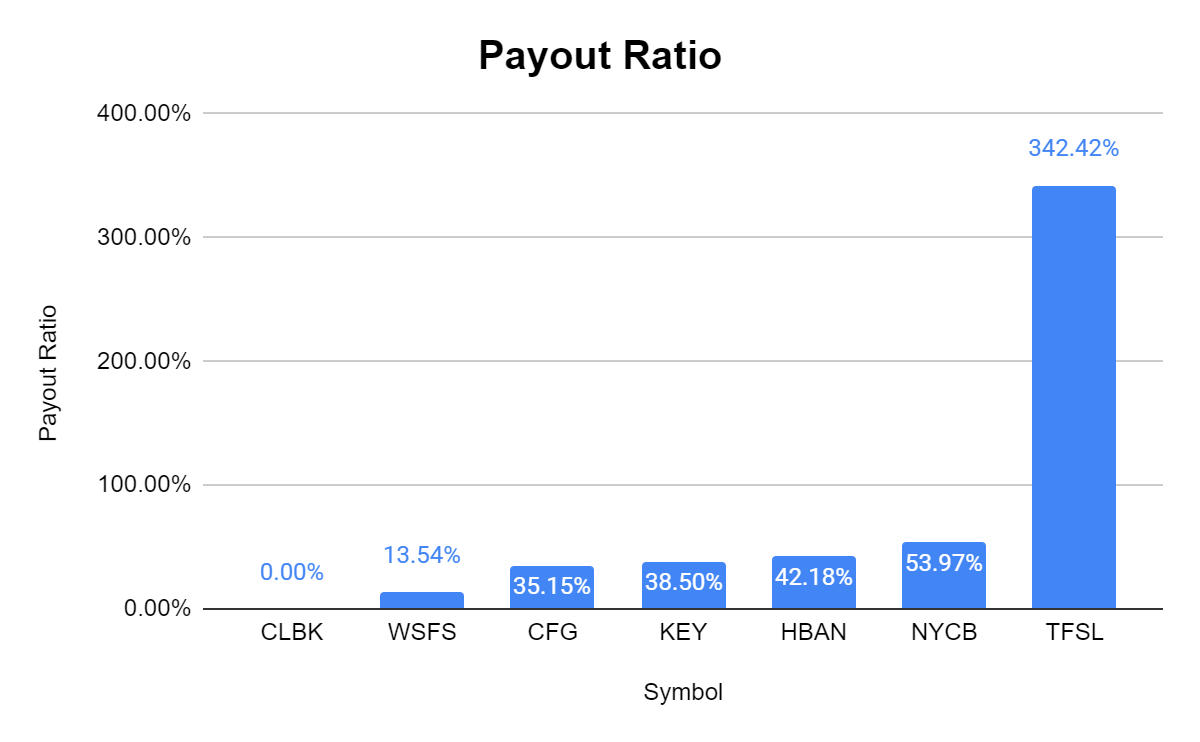
When it comes to the dividend, NYCB has the 2nd largest yield at 7.19%. The peer group average is 4.13%, so you’re getting a well above-average yield due to how much the market is discounting NYCB’s shares. NYCB also has a payout ratio of 53.97%, which places its large yield at a strong coverage ratio. The group average payout ratio is 75.11%, so you’re getting the 2nd largest yield with a payout ratio that’s lower than the peer group average with NYCB.
Steven Fiorillo, Seeking Alpha Steven Fiorillo, Seeking Alpha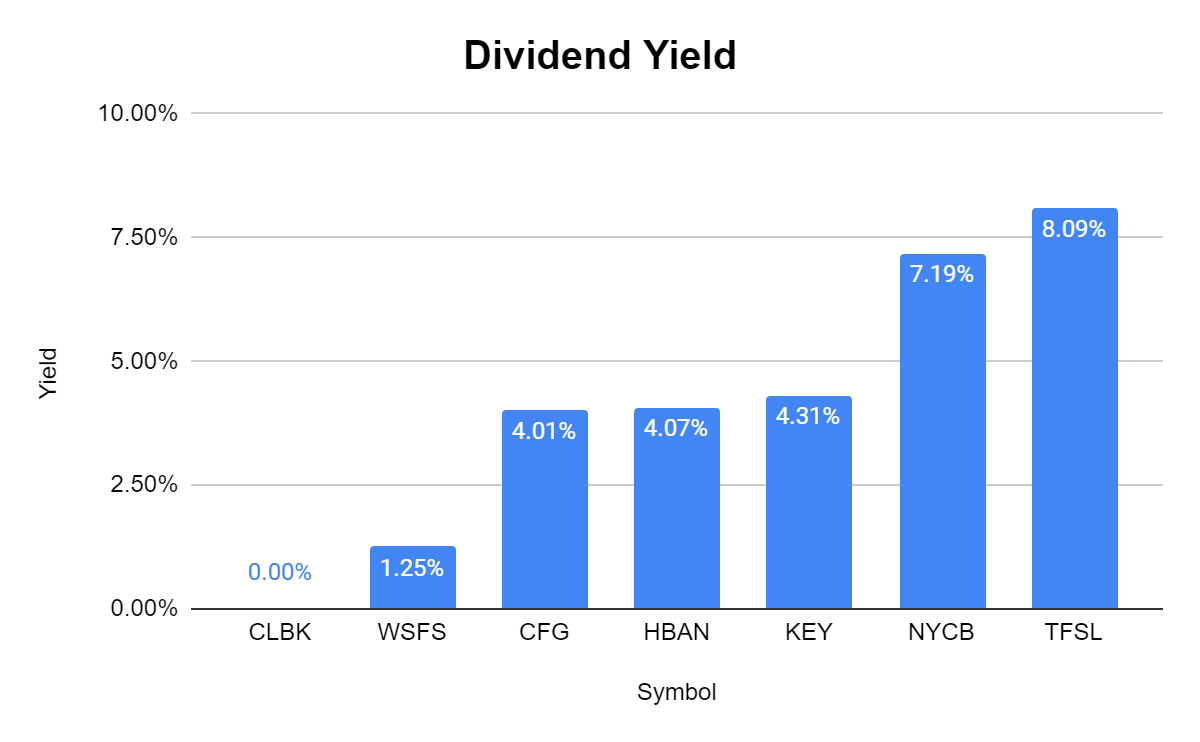
Conclusion
I believe that shares of NYCB are significantly undervalued. NYCB continues to increase its revenue and net income while growing its deposits and loans. The FBC acquisition will create a stronger entity as it puts the new entity at the top of the regional banking tier and expands its opportunities. The dividend will remain intact after the merger, and with the additional lines of business, there is certainly an opportunity for NYCB to grow the dividend again in the future. NYCB is trading at a discount to its peer group in many areas, including discount to book, discount to tangible book, equity to market cap, and P/E ratios. I think NYCB is a solid bank, and the fact that NYCB has 152.98% of its market cap in equity on its balance sheet and trades at -29.35% its book value are clear indications that shares are undervalued. I believe that after the merger goes through and we see several quarters of results, NYCB will trade at a premium to its book value and closer to a 1:1 ratio between its equity and market cap.
Be the first to comment