

Juan Jose Napuri
The Q2 Earnings Season begins next week for the Gold Miners Index (GDX), and while we’ve seen satisfactory results from companies that have reported preliminary results, New Gold (NYSE:NGD) was an exception. This was evidenced by a 33% decline in production year-over-year and one of the worst downwards revisions in guidance sector-wide, with costs now estimated to come in more than 25% above previous estimates at the mid-point. At a current share price of US$0.72, New Gold trades at less than 2x FY2023 cash flow estimates and is sitting on major support, suggesting a decent probability of a strong rebound. However, I continue to see much safer ways to get exposure to the gold price.
Rainy River Operations (Company Presentation)
Just over two months ago, I wrote on New Gold, noting that the stock was not oversold enough yet to consider a position at US$1.35 but that dips below US$1.12 would provide buying opportunities. While the stock did get a brief bounce off this area, rallying to $1.24 on June 27th, the company’s preliminary Q2 results crushed the stock, sending it plummeting through major support at US$1.06. A hiccup for a single quarter isn’t a huge deal, but the challenges in Q2 are expected to materially affect production for the rest of the year, pushing cost guidance to levels well above the industry average. Let’s take a closer look below:
Q2 Production Results
New Gold reported its preliminary Q2 results earlier this month, reporting production of ~70,500 gold-equivalent ounces [GEOs], a 33% decline from the year-ago period. This was attributed to much lower processed grades at both of its operations. Looking at its larger Rainy River operation below, we can see that while processing throughput was mostly in line with past quarters at ~23,300 tonnes per day, grades fell off a cliff, dipping to 0.69 grams per tonne of gold (Q2 2021: 0.81 grams per tonne of gold). The lower grades were due to flooding in the pit from unfavorable weather (heavy rainfall, flooding), which impacted mining rates, mine sequencing, and access to higher-grade ore.
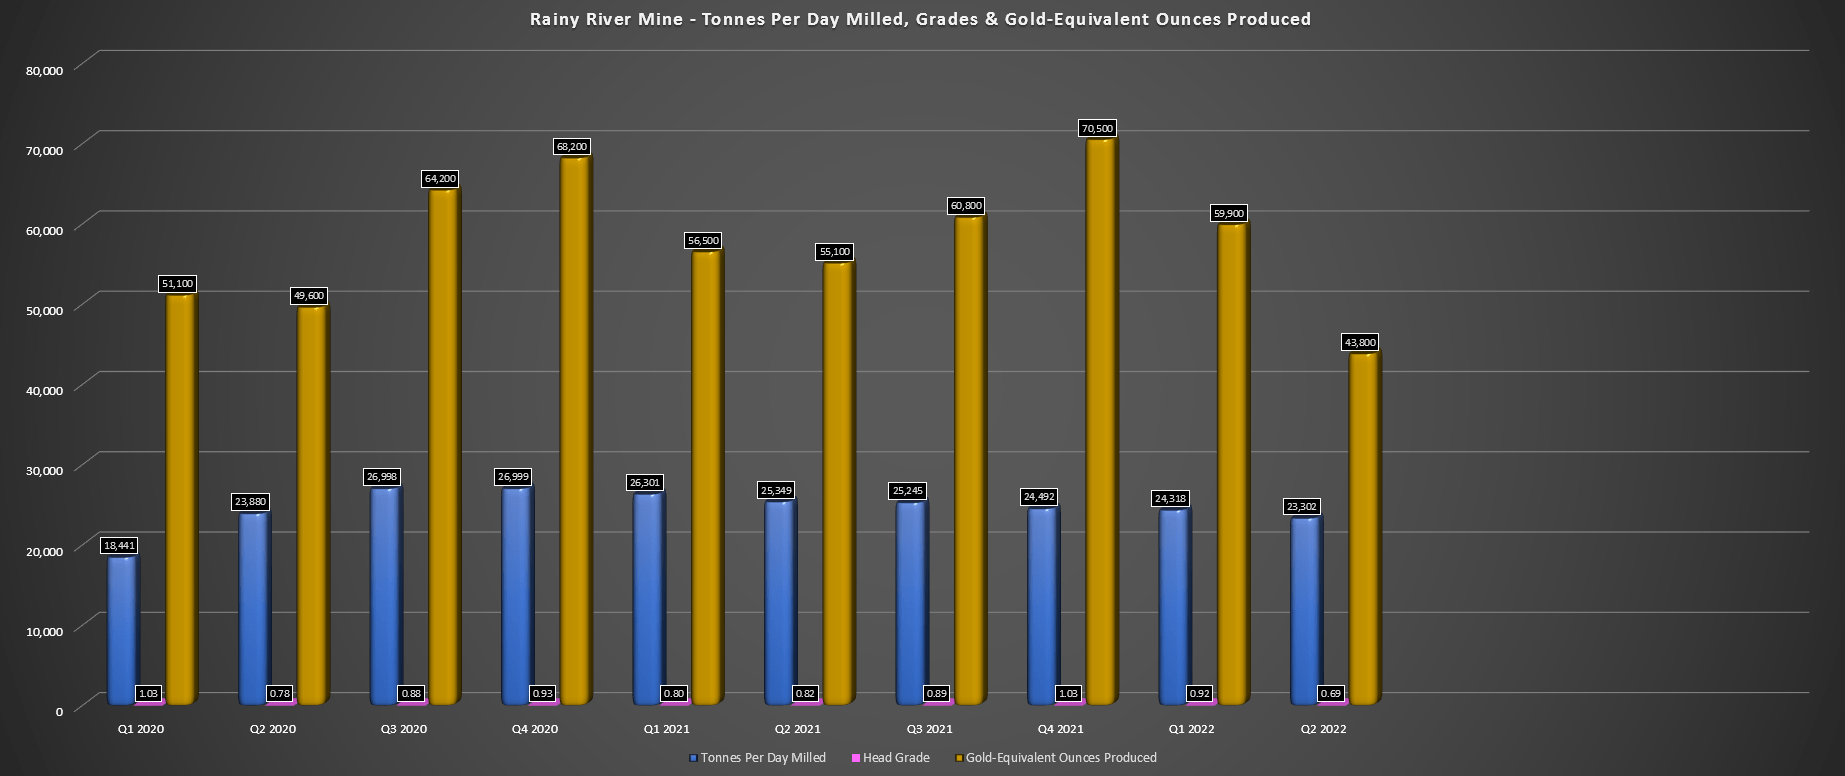
Rainy River – Quarterly Operating Metrics (Company Filings, Author’s Chart)
Unfortunately, while this led to utilizing lower-grade ore during the period, the shift in mine sequencing is also expected to impact H2 2022, with the operation having to rely on lower-grade material in the second half of the year as well. The result is a massive downgrade from the previous production outlook, with the updated guidance mid-point being for 240,000 GEOs produced in FY2022, down from a prior guidance mid-point of ~277,000 GEOs. Given the lower production levels that impacted unit costs plus the impact of inflationary pressures, costs are expected to soar above last year’s levels ($1,415/oz) and come in at $1,670/oz at the mid-point.
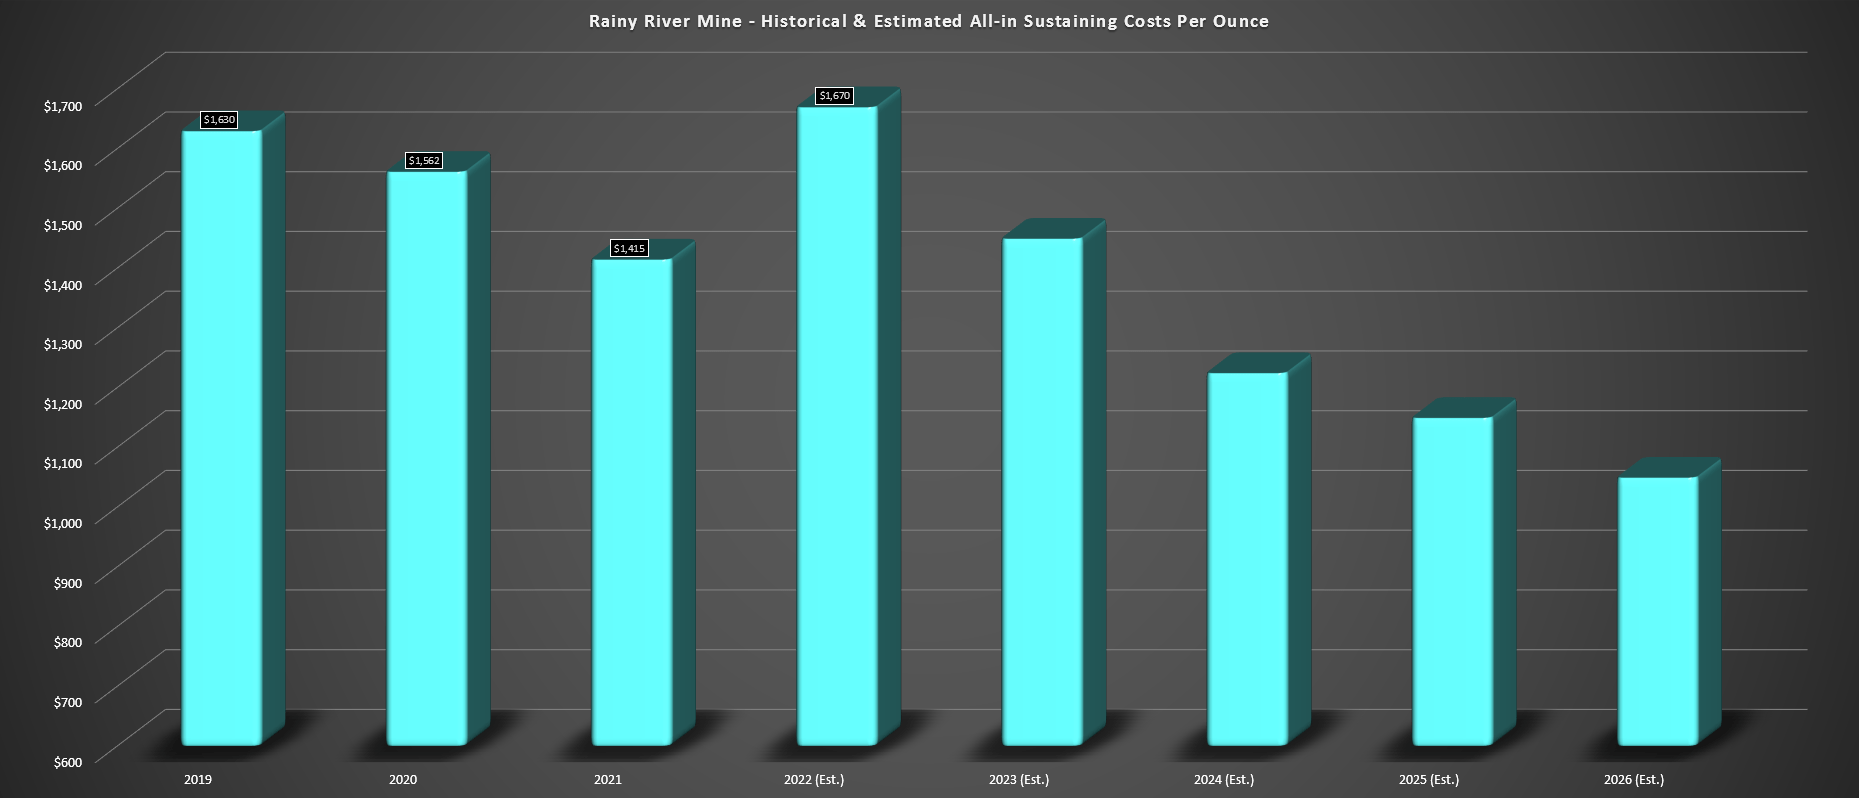
Rainy River Mine – Historical & Estimated All-in Sustaining Costs Per Ounce (Company Filings, Author’s Chart & Estimates)
One of the reasons I was positive and cautiously optimistic about New Gold was that costs were on track to decline again on a year-over-year basis, continuing a trend of lower costs since FY2019 after significant investment since Renaud Adams took over as CEO. However, with the unfavorable weather putting a severe dent in the mine sequence, costs are now expected to jump to a new 3-year high, which would see AISC margins dip to $150/oz or lower this year, down from $382/oz in FY2021.
Unfortunately, while the Rainy River operations struggled immensely in the period due to the flooding around the Fort Frances area of northwestern Ontario, New Afton’s quarter wasn’t any better. This was evidenced by Q2 production declining 47% year-over-year to ~26,800 GEOs, impacted by significantly lower copper grades (0.42% vs. 0.79%). New Gold noted that it closed the low-grade and higher-cost recovery level zone earlier than planned, which led to fewer tonnes mined than anticipated and forced the company to rely on lower-grade stockpiles to feed the plant. The result will be some of the highest costs sector-wide in Q2, and FY2022 cost guidance that’s now sitting at $2,260/oz.

New Gold – Consolidated GEO Production (Company Filings, Author’s Chart)
The silver lining at New Afton is that the production ramp-up at the B3 Zone continues to ramp up, and development is forecasted to be complete by September. Meanwhile, the first ore from the C-Zone should be available by year-end 2023 latest, even if this falls outside the current timeline of H2 2023. So, while the Q2 results were certainly disappointing, it isn’t all bad news for those invested in the name from higher levels that have the patience to wait for a turnaround.
Updated Guidance
Given the disappointing Q2 results, the previous 2022 guidance (shown below) has been scrapped, and updated guidance is now for ~345,000 GEOs at $1,925/oz all-in sustaining costs at the mid-point. This is a huge downgrade from the previous outlook of ~410,000 GEOs at $1,520/oz all-in sustaining costs, impacted by inflationary pressures, lower copper prices, and reliance on lower grades at Rainy River. Based on this outlook, New Gold will see its margins decline to negative $115/oz for FY2022, down from $335/oz last year. The above assumption is based on a $1,810/oz average realized gold price this year and meeting the guidance mid-point on costs ($1,925/oz).
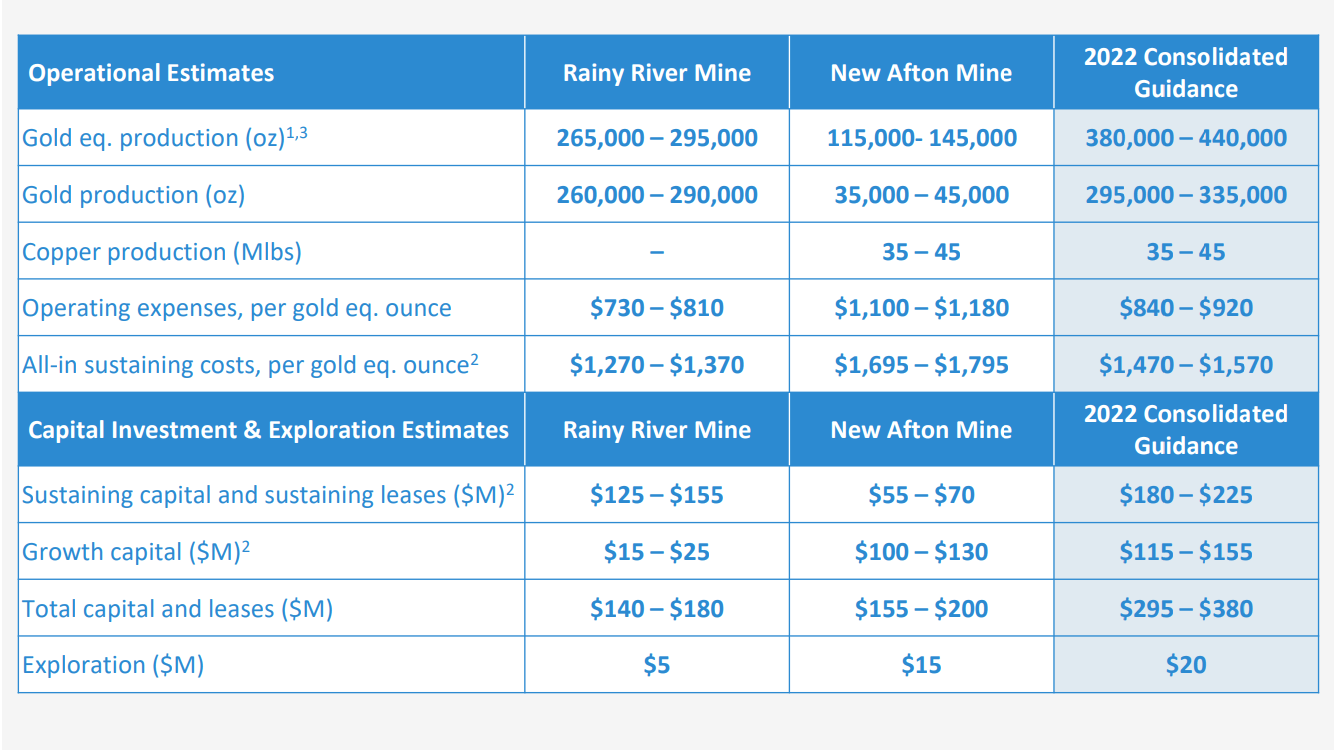
New Gold – Initial 2022 Guidance (Company Presentation)
Fortunately, although 2022 is set up to be a disaster from a cost standpoint, with all-in-sustaining costs increasing to well above the two-year average with a current guidance mid-point of $1,925/oz, 2023 should be a better year. This is because Rainy River is expected to benefit from much lower costs as production heads underground, and New Afton’s production will also increase considerably in the C-Zone Period post-2023. The favorable outlook at both mines points to a path toward production growth to 380,000+ ounces of gold per annum and 60+ million pounds of copper.
Simultaneously, New Gold’s costs should drop meaningfully, with all-in sustaining costs at Rainy River, its largest contributor, likely to average $1,180/oz or lower from 2023-2027 even after factoring in inflationary pressures. This would lead to considerable margin expansion at the asset vs. FY2021 levels, assuming the gold price cooperates. Hence, while this massive miss absolutely justifies the negative share price performance as of late, there is a light at the end of the tunnel, and the same can’t be said for some other mid-tier producers that continue to screw up but don’t have higher grades ahead of them in their mine plans.
Valuation
Based on ~687 million fully diluted shares and a price of US$0.72, New Gold trades at a market cap of ~$495 million, a very reasonable valuation for a ~400,000-ounce producer. However, given the significant downwards revisions in cash flow per estimates, it’s no surprise that the stock has come under considerable pressure recently. Based on updated and more conservative projections of $0.27 in FY2022 and $0.38 in FY2023, New Gold trades at ~2.7x FY2022 cash flow estimates and ~1.9x FY2023 cash flow estimates.
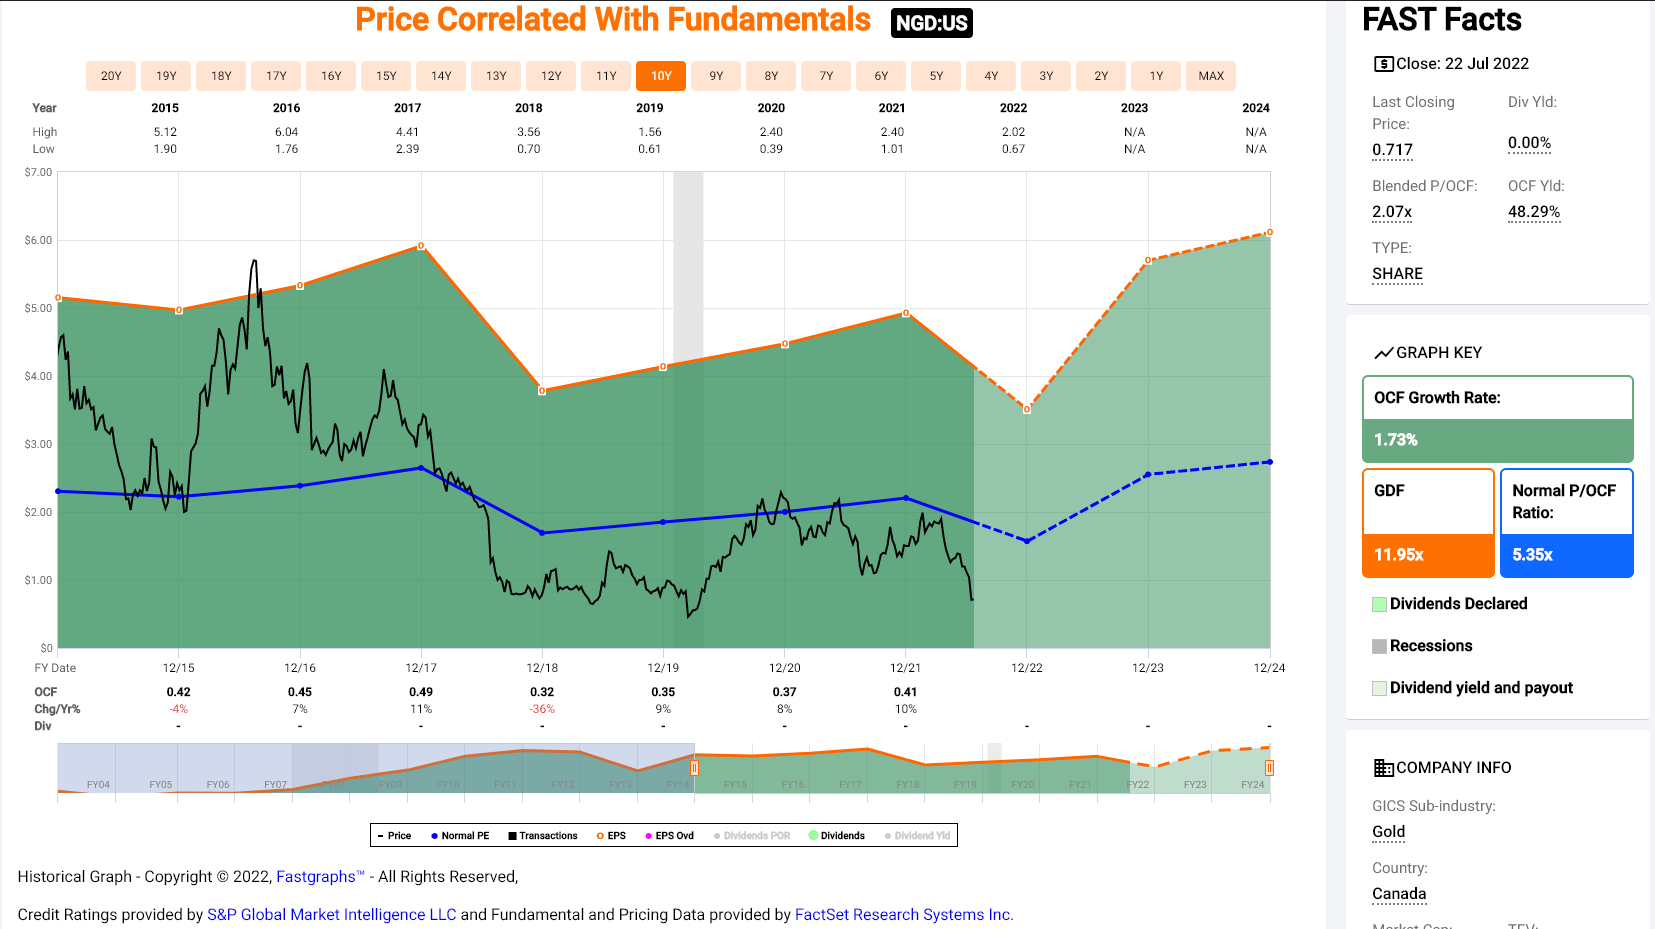
NGD Historical Cash Flow Multiple (FASTGraphs.com)
This figure is well below the company’s average cash flow multiple of ~5.3 over the past decade, especially when considering that it is carrying less debt and entering a 5-year period with significantly improved costs. Having said that, given the challenges as of late, I believe a more conservative cash flow multiple is 3.50, reflecting the company’s higher cost profile. Based on this cash flow multiple and FY2023 estimates, I see a fair value of US$1.33 to its 18-month target price. The updated target points to an 84% upside from current levels, but this is what I would consider a very high-risk investment that could see new lows below US$0.50 if we see continued weakness in the gold price.
So, is there any good news?
Looking at the technical picture, New Gold has come down to re-test a multi-year support level and an area where it also found major support at its 2008 lows. While there’s no guarantee that this support area holds if New Gold continues to experience challenges, I would not be surprised to see the stock enjoy a bounce from this area if sentiment in the sector can improve. The issue is that the stock’s previous support at US$1.06 is now likely to become a short-term ceiling for the stock, suggesting that while there might be limited downside from US$0.71, the best course of action is to take profits into rallies above US$1.00 before October.
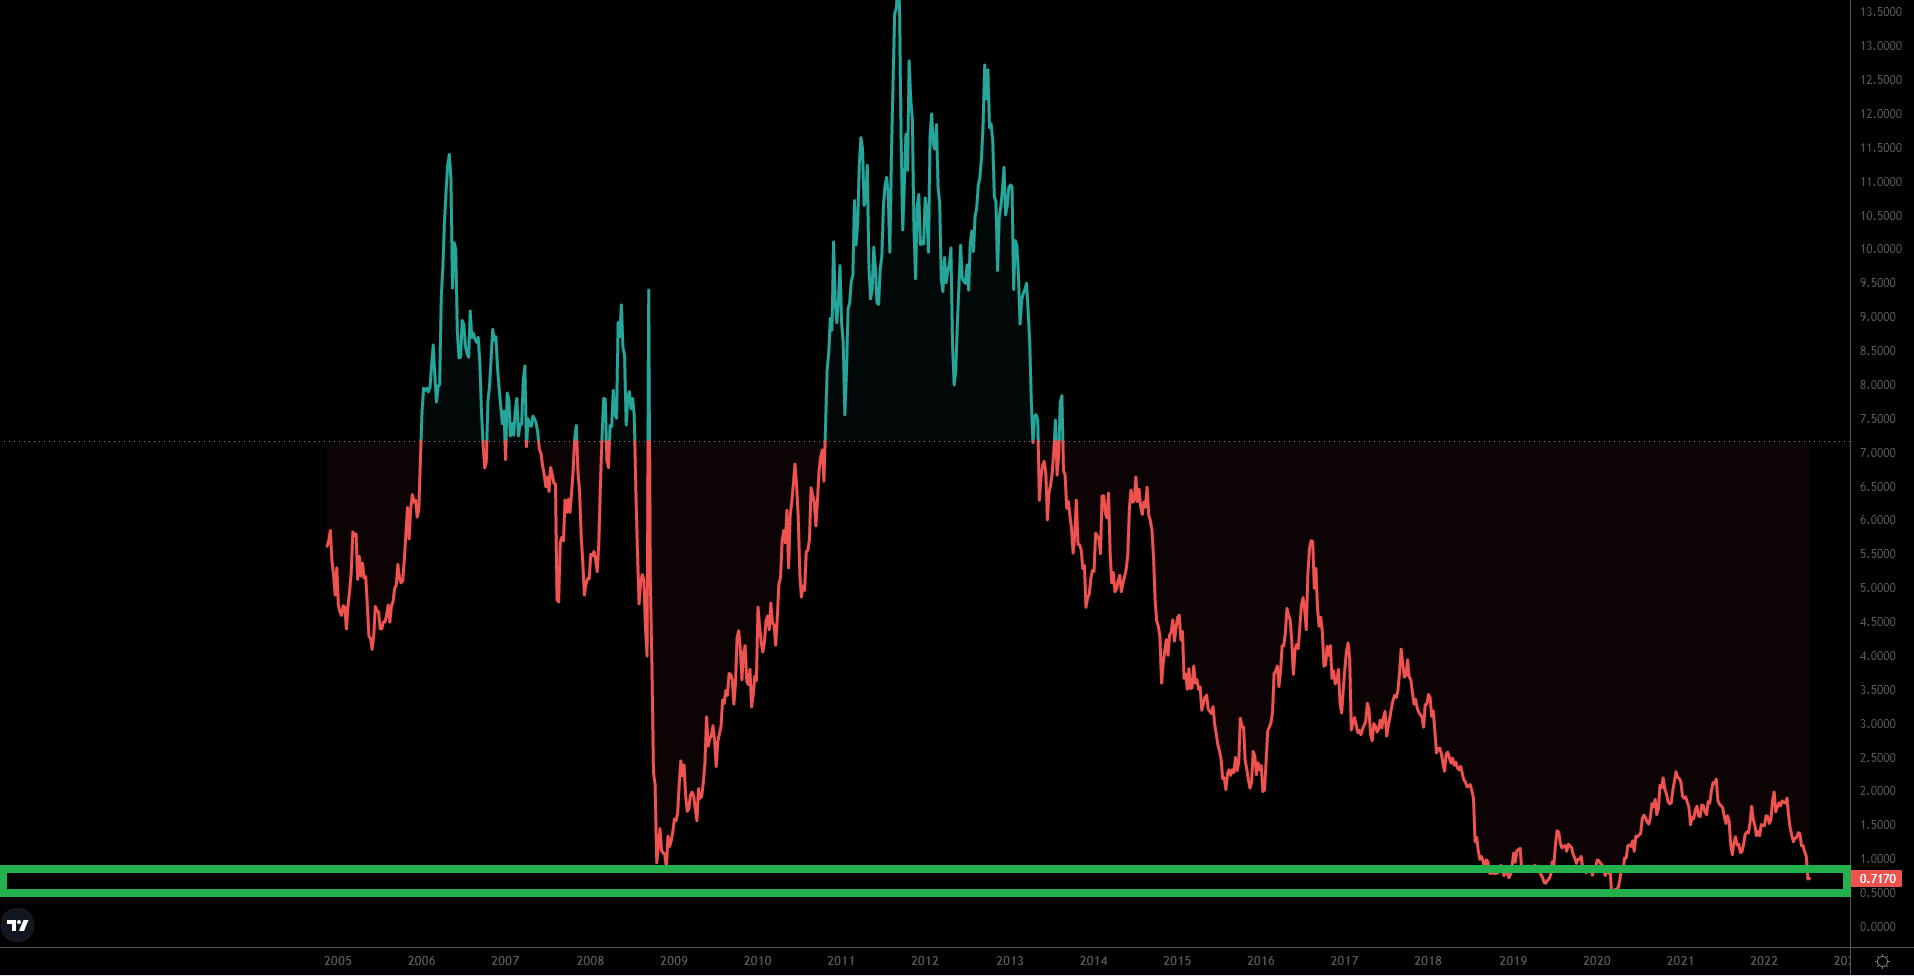
NGD Weekly Chart (TradingView.com)
The reason for this is that investors that purchased the stock at or near support at US$1.06 that have now suffered a 30% drawdown may be anxious to exit their positions at a small loss or at break-even when the stock recovers. We saw this occur in 2013 near $7.50 per share when the stock rallied back to re-test its broken support area from the previous bull market. So, while this sharp correction in New Gold might provide a buying opportunity, I wouldn’t be greedy and would be looking to take profits into strength on any rally above US$1.00. This is especially true given that New Gold remains a higher-cost producer even if costs will improve in 2023, and this makes it very sensitive to metals’ price weakness (gold, copper).
Summary
New Gold couldn’t have had a much worse Q2 with production down sharply, and unfortunately, this has led to a major impact on its FY2022 production/cost guidance. When combined with a lower gold price, we are going to see considerable margin compression this year, and, understandably, investors have dumped the stock. When it comes to investing in the sector, I prefer to stick to the best 7-10 names and not waste my time with the rest, and New Gold wouldn’t even make a top-20 list, even if there is a path to much lower costs medium-term (H2 2023 and beyond).
That said, for investors that want to gamble and don’t mind taking on above-average risk, the worst of this correction looks to be over, and I would not be surprised to see a bounce to US$0.95-US$1.05 over the next nine months. However, given my more conservative portfolio construction, I have no plans to buy the stock. The reason is that there are several more diversified names paying attractive dividends with more attractive margin profiles, and there’s simply no need to step out on the risk curve and buy the mediocre producers when higher-quality names are on sale.
Be the first to comment