

janiecbros/E+ via Getty Images
Investment Summary
The process of constructing portfolios in this current environment is daunting to say the least. Strategic and tactical asset allocation is now paramount to ensure one’s wealth can withstand the mess of macroeconomic probability distributions ahead. Notably, the macro-thematic environment has turned in 2022 to that of rising inflation, central bank tightening, rising Treasury yields and the prospects of slower economic growth. The blend creates an unflavorsome mix of flavors for asset allocators to digest. Moreover, the acute spike in long-dated Treasuries has occurred alongside an equally sharp correction in equities in 2022, leaving few places to hide, and even fewer avenues to fly to quality.
The asymmetry in risk assets continues to widen and equities therefore offer a lower risk premium as an asset class. Recent corrections to the lofty valuations in US equities still aren’t enough to pull in buyers to the SPX, for example, and positioning is still net-bearish. The conventional 60/40 portfolio (60% equities/40% fixed income) is also experiencing one of its worst drawdowns in history, as correlations between stocks and bond returns are positive, as it has historically been in times of inflation.
Exhibit 1.
Data & Image: Penn Mutual Asset Management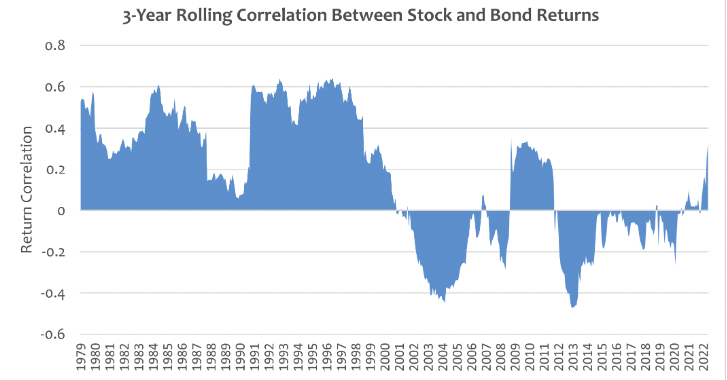
As a result, the drivers of equity returns have shifted in 2022, away from top-line growth and high-beta plays that profited from either a) Covid-19; or b) Central Bank liquidity programs. Focus has ticked back into bottom-line fundamentals and long-term cash compounding across most sectors. In life sciences and medical technology (“medtech”) our findings show that investors are prioritizing factors of profitability, and consequently, those seeking exposure to the sector should tilt towards the quality/profitability factor.
Which brings us to the case of NeoGenomics, Inc (NASDAQ:NEO), a name that’s now infamously destroyed more than 80% of shareholder value in the last 12 months. After an initially bullish position back in 2020 the tide turned for NEO and we as shareholders were hit with a series of unfortunate events. We’d priced the stock at ~$65 and felt the market was under-reflecting the company’s one-stop shop approach to oncology. However, turns out the market was correctly discounting the execution risk on NEO’s end. A series of lackluster catalysts turned investors sour on the stock, rejecting our bullish thesis in the process. Consequently it now trades at exorbitant multiples well above historical averages.
NEO 12-month price action
Data & Image: Bloomberg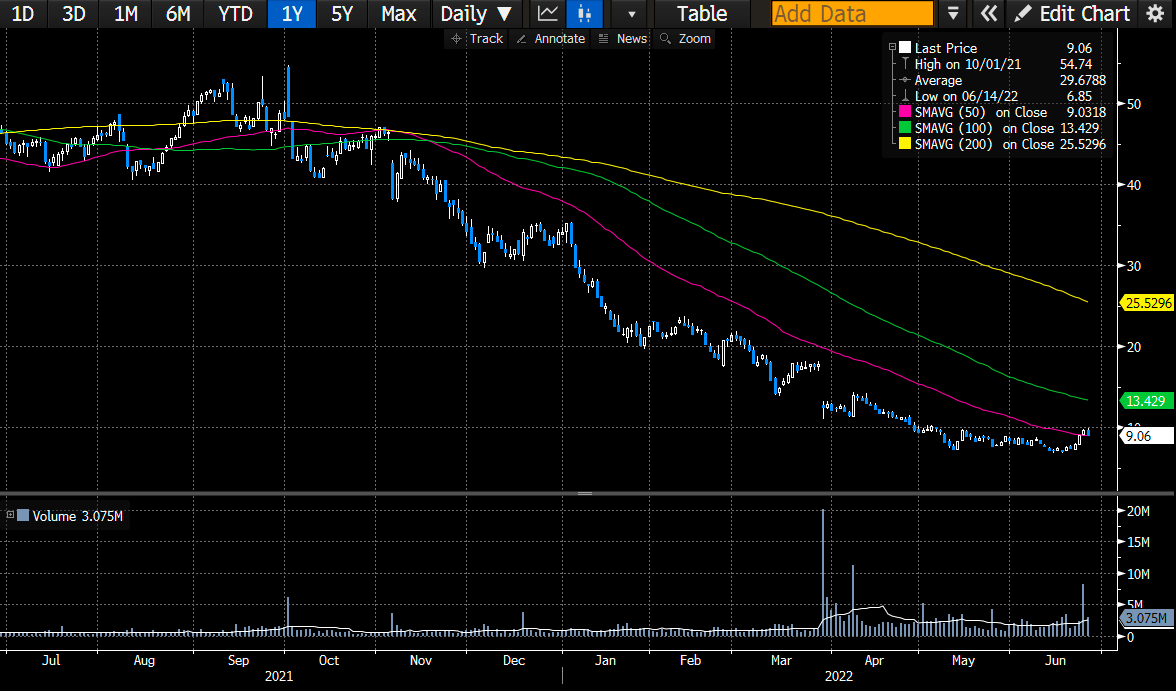
Here we demonstrate why NEO fails to warrant its inclusion into an equity-focused and cross-asset portfolio amid the current macro-thematic environment. We’ve done this by linking back to our current positioning, that reflects the current macro cycle. We also demonstrate how NEO lacks the equity risk premia to warrant allocation over an already performing portfolio or more stable, high-quality names. A lack of idiosyncratic risk drivers at the company level further clamps down on the case.
Listed below are the mitigating factors in the NEO investment debate. Without a directional bias on the market’s outlook, we are neutral on NEO.
1. Management overhang
NEO advised in March that its former CEO, Mark Mallon stepped down immediately. It subsequently pulled FY22 guidance and estimates ~$120 million at the top, behind consensus. On May 12, NEO appointed Lynn Tetrault as board chair and interim CEO. An external search still continues, but the point is this is a substantial overhang that continues to plague the company. Whilst the fallout looks to be well priced into the stock, the mere fact the ship is steering without a captain per se continues to clamp down on the NEO share price.
Financial performance has been consistently underwhelming (shown later) and these trends continued at the margin level. Gross margins (“GMs”) are one easy and effective ‘acid-test’ to evaluate manager performance, by estimate. NEO’s GMs have narrowed by ~11 percentage points from 43.5% in Q2 FY21 to 32% in Q1 FY22, ratcheting down each quarter along the way. Adjusting for amortization, they reached ~36%. Management proposed that there were several factors contributing to the thinner GM in Q1 FY22, and that steps were being immediately taken to address these. Although, we demonstrate NEO’s gross and net margins have continued to tighten sequentially since Q2 FY21.
Firstly, management said it increased its laboratory headcount “in preparation for return to pre-Covid growth rates” back in 2021. The problem is, that’s quite a misleading statement, by estimation. The company only had 1 year of substantial growth in the period of 2017–2019, that being FY19 where it recognized a 47% YoY jump in revenue. Prior to that, from years FY17–18 it saw a -1.6% and 15.2% YoY growth schedule respectively. For contrast, it grew revenue at 8.7% in FY20 and 9% in FY21. It has since scaled back its laboratory hiring plans to “better align with near-term trends” – what trends these are, we’ll wait and see.
Exhibit 2.
Data: Bloomberg. Image: HB Insights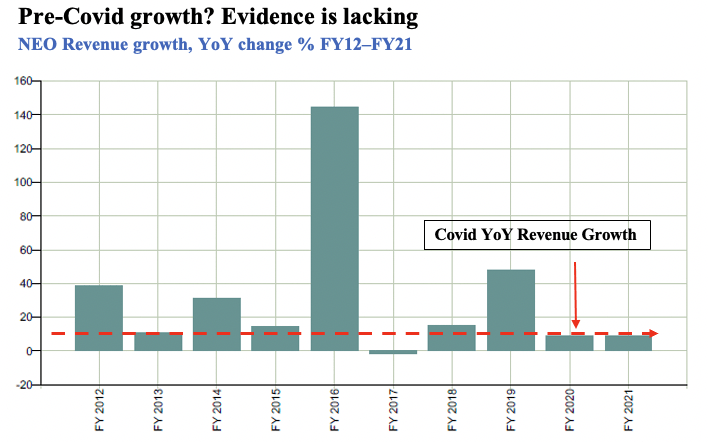
The more pertinent issue is that NEO hasn’t stacked its top line at the pace it had hoped to throughout COVID. That’s been compounded by a series of structural failures coupled with poor management of working capital. For instance, accounts receivable has trebled downwards to 4.5x in Q1 FY22 and whereas inventory turnover has narrowed down from 18.4x in Q4 FY19 to 13.4x last quarter. However, accounts payable turnover has spiked from 11.6x to 15.5x in the same time, and accounts payable turnover days narrowed from a favorable 31 days to 23 days. The rate of change is biased towards cash flow out within the working capital cycle.
As such, NEO’s cash conversion cycle has widened substantially from 64 days in Q4 FY19 to 84 days in the last print, exactly 4 business weeks difference. This means the company has more cash tied up into working capital and is unable to ratchet up operating leverage. We reckon that’s a large part in why sales momentum has slowed too – the company can’t wind up its flywheel as more cash continues getting tied up in the payments side of the cash conversion cycle. In return, it isn’t receiving the same uptick in accruals. The Sloan ratio helps us dive deeper here. It’s calculated as follows:
Sloan Ratio = (Net Income – CFO – CFI) / Total Assets
It tells us how NEO’s earnings quality stacks up against its cash flow. NEO scored a Sloan ratio of 4% on the last earnings. Thankfully, its earnings aren’t made up mostly of accruals on this examination.
Finally, management reckons it’s going to mitigate cost pressures from supply chain and wage increases by implementing price increases in its clinical and pharma segments. It’s also pursuing “strategic reimbursement opportunities to increase value capture”. The question is, how likely is that going to be? What’s the probability NEO can pull this off? Not high, by estimation. Track record aside, a more competitive pricing environment across medtech means the guarantee of pass-throughs of cost are not to be taken on face value.
2. Macro-thematic is a major headwind
The fact of the matter is, markets have endured their worst sell-off period in decades and investors are repositioning to absorb macro-related headwinds. As such, the high-beta and growth trade has completely unwound this year as the market continues to price in a series of (albeit uncorrelated) systematic risks.
Investors aren’t rewarding top-line growth anymore and instead are focused on bottom-line fundamentals. Those names with weaker balance sheets, free cash conversion and earnings growth have subsequently been punished in 2022. NEO in particular has lost its equity premium, with its earnings yield crossing below the belly of the US Treasury yield curve in February. With that in mind, only the highest quality, cash-compounding names will shine through in medtech by our estimation when looking ahead.
Exhibit 3. HB Insights equity risk premia June 2022
Data & Image: HB Insights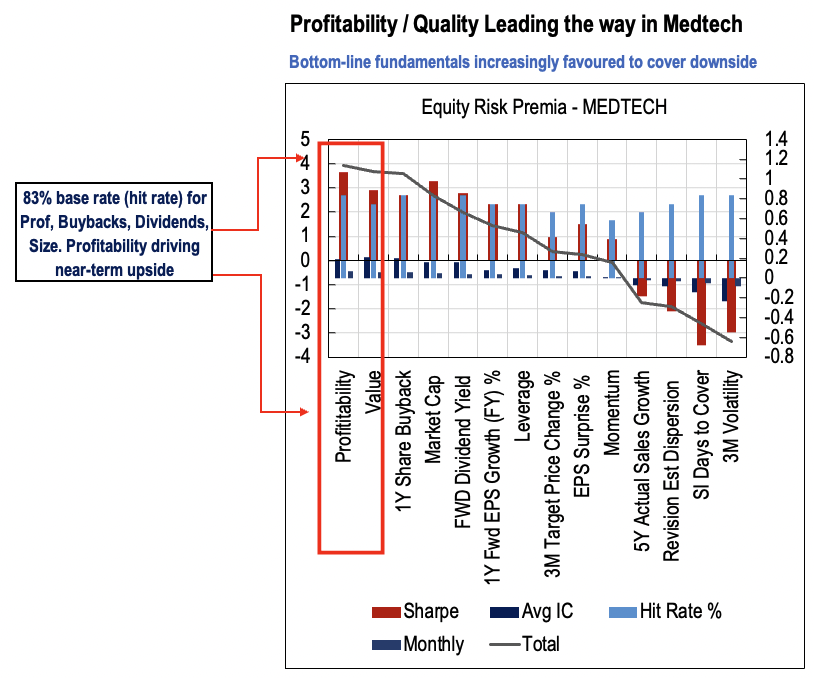
Exhibit 4. NEO’s negative risk premium over the 10yr
Data: Bloomberg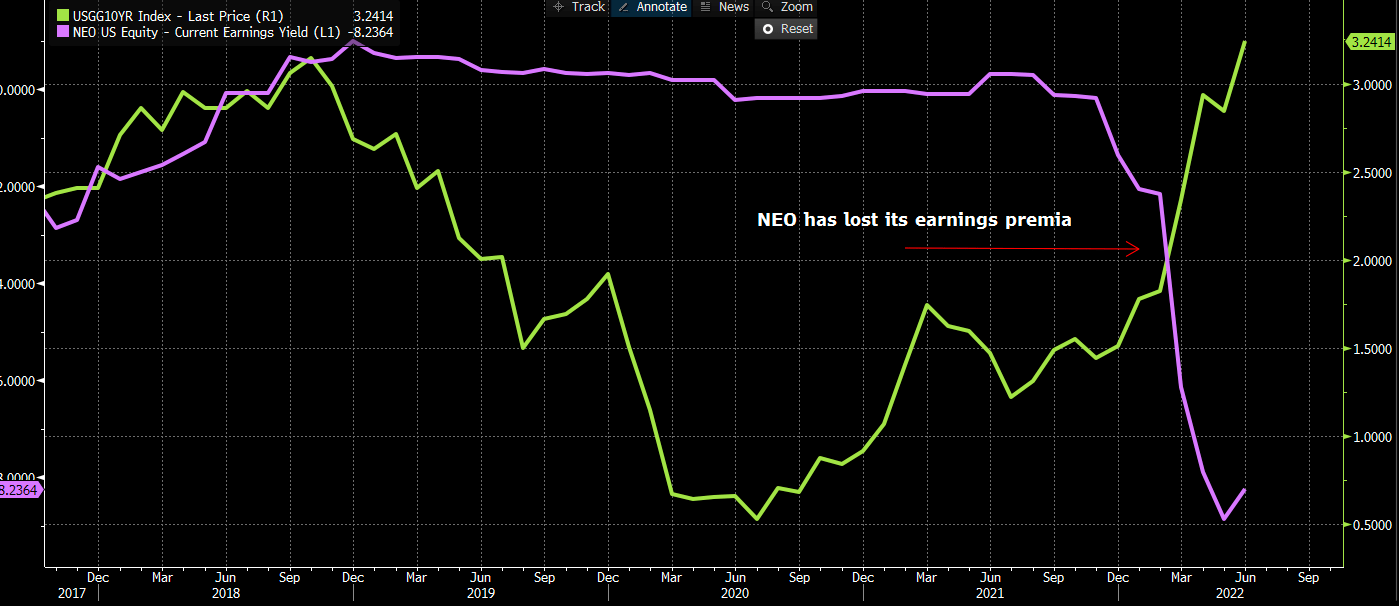
As much has already been observed in 2022, with our data illustrating profitability measures are the key factor driving the sector’s returns this year. Moreover, investors are demanding a higher equity risk premium in the medtech space given equity risk is less easy to diversify in a portfolio exposed to inflation. As such, companies like NEO need to deliver exceptional real FCF, CFO and earnings growth in order to compensate for the added volatility and systematic risk.
NEO is well out of the ‘venture curve’, and its business model has yet to demonstrate any elements of profitability in the last 3 years. Both ROA and ROIC have slipped to -2% and -7.8% in Q1 FY22 after trending down across the past 2 years. It’s also averaged a -0.9% ROA the last 3 years and ROIC has decreased by 7.8% geometrically these past 5 years. NEO also printed FCF of -$37 million last quarter and looks on track to continue this trend into FY23 and FY24. Three-year FCF margins normalize to -8% for the company and investors realize a -10% FCF yield on these results.
Exhibit 5.
Data & Image: Goldman Sachs Global Investment Research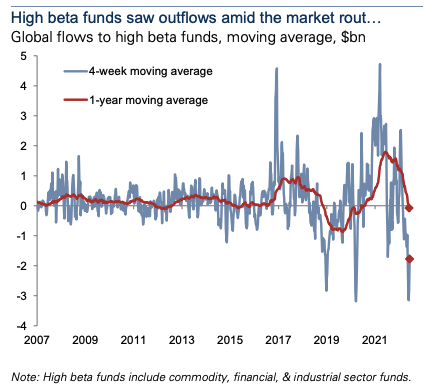
Interestingly, management used the language of “we view this year-over-year decline as an anomaly and not a trend, as we faced a very tough prior year comp” on the last earnings call. We beg to differ. We’ve already demonstrated that investors aren’t rewarding growth anymore and are punishing weak, cashless names. As we see below the NEO share price has been converging to its bottom line fundamentals ever since the market correction began, validating our findings. With NEO’s forward estimates looking weaker again, the outlook for its share price is equally as weak, by estimation. Without the fundamental momentum underpinning the company, it’s unable to justify its inclusion into any long-only portfolio right now. There is potential to play it as a long/short setup with a large-cap oncology specialist, however, the nuances of such a strategy are for another article.
Exhibit 6. NEO converging to bottom line fundamentals
Data & Image: Bloomberg 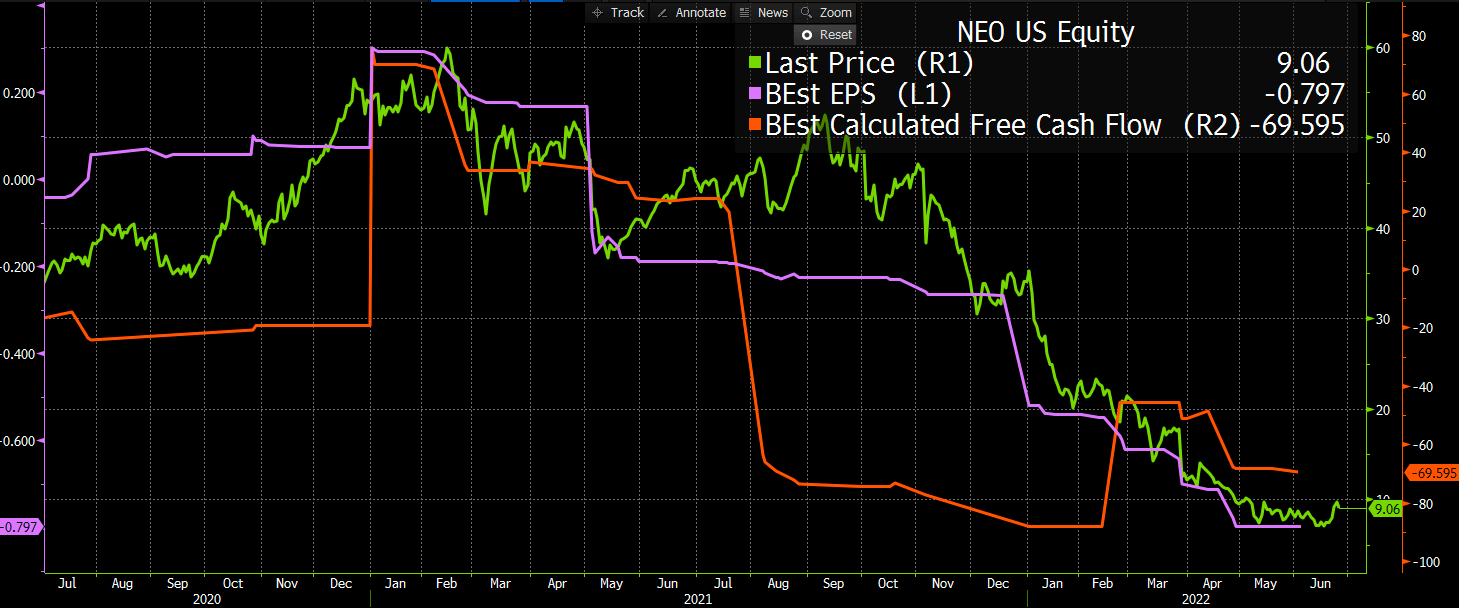
Revenue per test grew last quarter by ~2% to $371, but NEO reduced its sales rep headcount by around half, now ~25 reps. We expect a further dwindling in sales as a result. Whilst the backlog from its Pharma services segment grew by ~30%, this only came through to about 7% in revenue conversion – its lowest since early 2017. Operating margin came in substantially tighter YoY due to several one-line items. However, in tandem with other trends, operating margins have been eroding for several periods now, for each operating segment.
Clinical services gross margin came from ~47% in Q1 FY20 to ~39% in Q1 FY22, whereas pharma services was 17% to 25%. Moreover, operating income has been narrowing since 2017, widening its losses ever since the pandemic’s onset. At the same time, cost of revenues has been curling up at pace, reducing the amount of cash below the gross level. Operating leverage has therefore suffered and the feedback loop is therefore formed, with a wind-down in sales, narrowing margins/increasing costs, lower operating income and cash conversion, leading to more cash going out in working capital than what’s coming in. Management is aiming for GMs of ~50% into the future and is targeting a short term $15 million gain in gross profit improvement FY22. We aren’t confident on this and model it to print $181 million this year, a $2 million decrease from FY21.
Exhibit 7.
Data & Image: NEO, HB Insights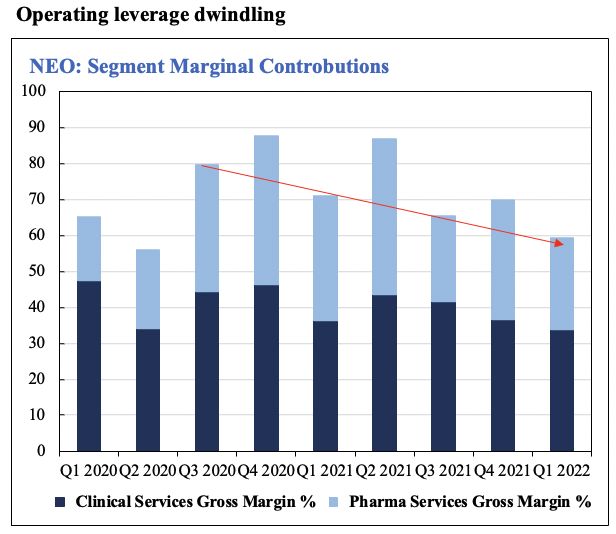
Exhibit 8.
Data & Image: NEO, HB Insights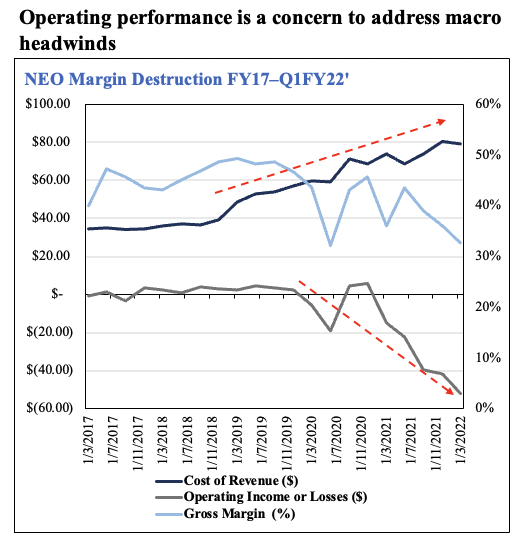
3. Valuation and price objectives leave little flesh for the skeleton
Shares are trading at a substantial discount to the peer group across key multiples but this discount is warranted by estimation. NEO isn’t the same company it was pre-pandemic, and the pressures COVID-19 brought to markets only highlighted its vulnerability. What was once a tasty growth story has now been dwindled back to the skeleton, and valuations lack any flesh to place back on the carcass.
Multiples & Comps
Data & Image: HB Insights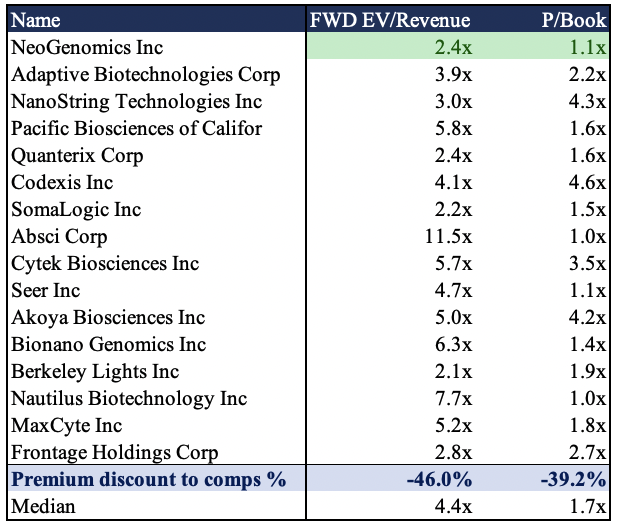
Using 3-year normalized multiples to forecast FY22 price objectives is a fruitless exercise, therefore. Doing so prescribes a price target of $40, and this isn’t reflective of NEO’s risk profile by estimation. We need to value NEO using today’s and tomorrow’s earnings outlook, which factors in macro-pressures described above. Instead, assigning our 2.4x EV/Sales to our FY22 sales estimates sees us price NEO at $9.80. Applying the same methodology to FY23 estimates and discounting this back to the present at 12.5%, we see a price objective of $9.66. In the upside case, 4x forward sales gives a price target of $16.30, although our probability distribution on this outcome are low. As such, there’s no return objective to be sought in NEO, by our estimation.
Exhibit 9.
Data & Image: HB Insights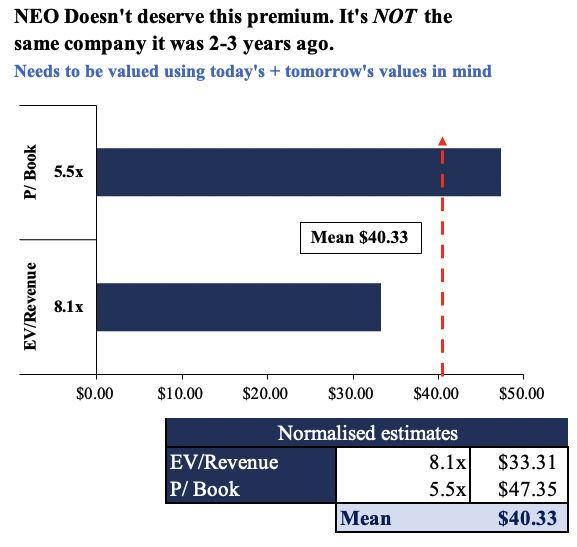
In Short
As it currently stands, NEO doesn’t warrant an inclusion into a long-only equity focused portfolio. This extends to cross-asset setups. There is impeding risk the stock will continue attracting sellers due to softening fundamentals and inability to cope with macro-headwinds. With thinning margins and weak cash conversion, NEO’s income is at risk of compressing vertically down the P&L, should these trends continue.
We’ve priced NEO at ~$9.70 which leaves us little to no room to chase for upside or no margin of safety to position NEO within a tactical setup. We’d advocate that investors position around 20-30% of their portfolios as if there were a recession looming, with the remainder positioned for a ‘soft landing’ by the Fed. NEO fails again here, as it doesn’t have the credentials to absorb these kind of pressures, we estimate. Upside risks to our thesis include if NEO were to increase its FCF, boost sales to double-digit growth and return a positive EPS in FY23.
Be the first to comment