

adaask
National Retail Properties (NYSE:NNN) and Realty Income (NYSE:O) are both triple net lease REITs with very stable cash-flowing business models. While NNN’s yield is ~60 basis points greater than O’s, O boasts a higher credit rating, implying a lower risk profile.
In this article, we will compare the business models, balance sheets, growth potential, and valuation of these two REITs side-by-side to determine which is the better buy today.
National Retail vs. Realty Income: Business Models
Both businesses have very recession resistant business models thanks to deriving virtually all of their revenue from broadly diversified real estate portfolios with triple net leases.
While we like both business models and each has its unique strengths and weaknesses, O is the winner here as it has vastly superior scale and a lower cost of capital. O owns nearly 11,300 properties spread across more than 1,000 clients across 70 industries. Moreover, the fact that 43% of its revenue comes from investment grade tenants makes its already conservatively structured cash flow stream even more dependable.
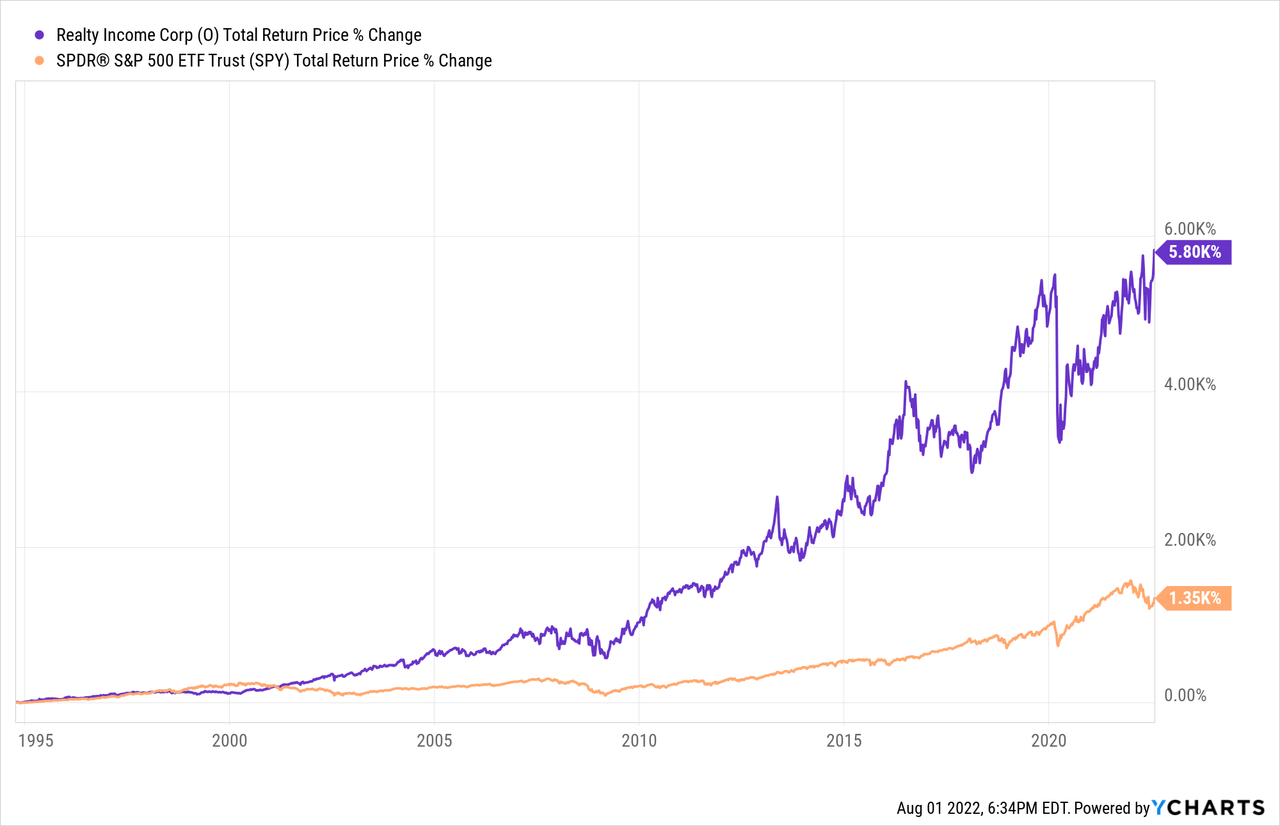
O boast a 26-year dividend growth streak through good times and bad, combining with its phenomenal total return track record to make it a great investment for dividend growth investors:
Meanwhile, NNN has a solid – if less impressive – portfolio and track record. It owns 3,271 properties with over 370 customers with its top 25 tenants making up 55% of total annual rent. NNN focuses on non-investment grade tenants in order to get higher cap rates and better rent escalator terms. Meanwhile, tenant credit status can be fleeting as it often improves or degrades over the course of the lease (while the terms remain constant).
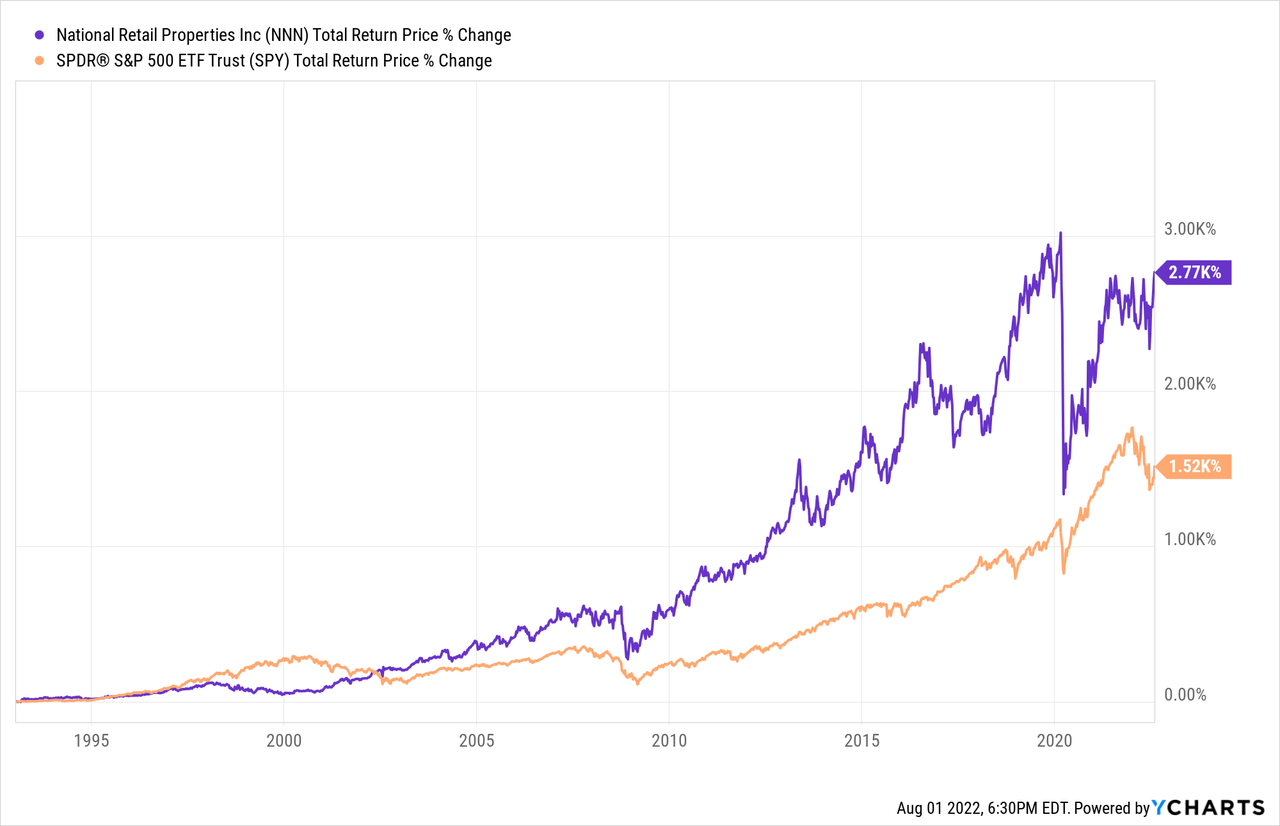
This strategy has worked very well for NNN as its 19-year occupancy low is still quite impressive at 96.4%. The portfolio is also well-positioned to face a potentially prolonged economic downturn as only 3.7% of its leases are set to expire through 2023 and its current occupancy level is 99.2%. This has enabled NNN to grow its dividend every year for 32 consecutive years, delivering outstanding total returns in the process:
National Retail vs. Realty Income: Balance Sheets
Both businesses’ balance sheets are very strong, with NNN’s achieving a BBB+ (stable outlook) credit rating and O getting an A- (stable outlook) credit rating from S&P.
O has a 6.4 year weighted average debt maturity term, has a 93% unsecured debt to total debt ratio, and has a 5.6x fixed charge coverage ratio. Its weighted average interest rate is very low at 3.12%.
NNN’s approach to balance sheet management is long-term in that it does all it can to never need to depend on the capital markets to keep the business running while also maintaining sufficient liquidity to respond opportunistic to economic storms. Management is also obsessively focused on reducing its cost of capital as it realizes this is a key component of successfully generating outsized returns in the triple net lease space.
99.8% of its assets are unencumbered and it boasts a very lengthy 14.5 year weighted average debt maturity term. This is especially valuable given that interest rates have materially increased over the past year. It only has very small debt maturities in 2022 and 2023 at interest rates of 5.2%, so it should be able to easily either pay these off with excess cash or refinance them at similar interest rates. Its more significantly debt maturities do not begin until 2024 and then continue through 2028. These maturities have interest rates ranging from 3.6% to 4.3%, so management will likely wait a while to refinance them in hopes that interest rates subside again.
A major strength for the company is that it has three fairly large tranches of debt ($1.2 billion in total) at a weighted average interest rate of 3.21% that does not expire until 2050 or later. Being able to lock in so much capital at such a low interest rate for so long will provide NNN with a cost of capital competitive advantage for decades to come. Both its interest coverage and fixed charge coverage ratios remain very conservative as well at 4.7x.
While NNN has a much longer weighted average maturity term and has a higher percentage of unsecured debt vs secured debt than O does, O’s fixed charge coverage ratio is significantly greater than NNN’s. It also has a lower weighted average interest rate. As a result, we give O a very slight edge on this metric, though both businesses have very strong balance sheets.
National Retail vs. Realty Income: Growth Potential
Both NNN and O continue to invest in opportunistic acquisitions which combines with solid organic growth due to built-in contractual rent escalators to drive mid-single digit annualized AFFO per share growth.
While O has the advantage of having a lower cost of capital, NNN generally invests in higher cap rate properties with better rent escalators due to its focus on non-investment grade tenants.
However, analysts are more bullish on O’s ability to grow AFFO per share through 2026, assigning a 5.2% expected AFFO per share CAGR through 2026 compared to a meager 2.1% AFFO per share CAGR through 2026 for NNN. At the same time, NNN is expected to grow its dividend per share at a 6.5% CAGR through 2026 whereas O is expected to grow its dividend at a 5.9% CAGR over that same time span. As a result, we give O a slight edge here.
National Retail vs. Realty Income: Stock Valuation
NNN’s main advantage over O is that its dividend yield is meaningfully higher and its P/AFFO multiple is meaningfully lower. Furthermore, when we look at the EV/EBITDA and P/NAV multiples, we see a similarly widespread in valuations.
| Metric | P/AFFO | Dividend Yield | EV/EBITDA | P/NAV |
| NNN | 15.03x | 4.5% | 17.12x | 1.05x |
| O | 18.90x | 3.9% | 19.83x | 1.26x |
On top of that, NNN is trading at meaningfully greater discount to its pre-COVID highs than O is.
Last, but not least, NNN’s 2022 dividend payout ratio is expected to be 68.0% whereas O’s 2022 dividend payout ratio is expected to be 76.1%. As a result, NNN’s dividend is not only much better covered by cash flow, but it also enables the REIT to retain more cash flow to reinvest in future growth. This helps to offset its slightly lower credit rating and higher cost of capital relative to O.
Investor Takeaway
Both NNN and O look like very solid, conservative dividend growth plays that also pay out attractive current yields. While O is the most conservative given its significant exposure to investment grade tenants, stronger fixed charge coverage ratio, and A- credit rating, NNN trades at a meaningful discount to O and also offers superior current dividend yield as well as slightly better medium term dividend growth prospects.
As a result, O is a better pick for those looking for bond-like safety that also provides some growth, while NNN is a better pick for those looking for total returns. Ultimately, however, we believe that the risk-reward is tilted in NNN’s favor as O’s total return profile is in the high single digits whereas NNN’s total return profile is a few hundred basis points higher without much more risk thanks to its superior yield and stronger potential for multiple expansion.
We rate NNN a Buy and O a Hold at their current prices.
Be the first to comment