


The Wrong Side Of A Wave Three
RichardALock
DISCLAIMER: This note is intended for US recipients only and, in particular, is not directed at, nor intended to be relied upon by any UK recipients. Any information or analysis in this note is not an offer to sell or the solicitation of an offer to buy any securities. Nothing in this note is intended to be investment advice and nor should it be relied upon to make investment decisions. Cestrian Capital Research, Inc., its employees, agents or affiliates, including the author of this note, or related persons, may have a position in any stocks, security, or financial instrument referenced in this note. Any opinions, analyses, or probabilities expressed in this note are those of the author as of the note’s date of publication and are subject to change without notice. Companies referenced in this note or their employees or affiliates may be customers of Cestrian Capital Research, Inc. Cestrian Capital Research, Inc. values both its independence and transparency and does not believe that this presents a material potential conflict of interest or impacts the content of its research or publications.
Today Was So, Like, 2022
Since you will be able to read about precisely why the Nasdaq and its cousins went nuts on Thursday, with buyers trampling the weak and the needy in a dopamine-hazed scramble to bid the index up, we won’t attempt to give you yet another hastily-constructed narrative about what “investors” thought at any given moment during the day. The plain fact is that the buying pressure overwhelmed the selling pressure Thursday, so the Nasdaq went up. And the more it went up the more buying became the thing to be doing, so the more buying there was. Until the day was done and the sugar high was brought to an enforced close when the exchanges closed their doors and ejected addled punters into the night to make their own way home. (At the time of writing, the Globex futures session is flat on the Chicago close; the Nasdaq’s degenerate cousin crypto is busy selling off once more).
What you may find interesting is to see the clues, the breadcrumbs, which indicated to the sceptical and cynical mind that indeed the Nasdaq may move up Thursday despite its behavior earlier in the week. Rather than give you the Captain Hindsight version, we’ll walk you through how we saw the week unfold in our Growth Investor Pro service and what we did about it in staff personal accounts.
The Backdrop
The scene was set last week at the FOMC press conference. Chairman Powell delivered the expected 75bps rise but not without administering a proper talking-to so that the miscreants commonly known as market participants (that means degenerates like you) were under no illusion that the good times were likely to return any time soon. We commented on Powell’s hawkish surprise, here. Coming into the midterms, as is common for such events, the market was so scared about the downside risk that it had forgotten all about the upside that results when a scary thing – uncertainty of outcome – passes.
In our Growth Investor Pro service and indeed in staff personal accounts we decided to walk unhedged into election week. On Tuesday morning this looked like a wonderful idea. Friday’s close of the QQQ was around $265 and Tuesday morning the fund was pushing up at $273, 3% up in a little over day in anticipation of what everyone everywhere decided was the Red Wave that would deliver stalemate to DC and therefore block the ability of pesky politicians to do stuff that got in the way of good old-fashioned moneymaking on Wall Street real and virtual.
Oops. Then everyone decided that the Red Wave was more like a pinky-lookin millpond and therefore maybe Big Government was going to regulate all our accounts to zero. Whereupon the Qs started to sell off. (Alternatively it may not have been Fear of a Blue Planet. It could be that the whiff of trouble in Decentra-la-la-land had reached the noses of grownup investors and, fearing contagion from the impending collapse of FTX and likely other Wild West members of the crypto fraternity, started dumping stocks).
Wednesday saw sustained selling in the Nasdaq and most everything else, partly a result of Crypto-night and partly fearful selling ahead of Thursday’s CPI number.
Thursday at 0830 Eastern the party was officially opened and the Dionysian celebrations are just now petering out. The QQQ finished Thursday’s regular trading hours just shy of $283, an only-in-2022 rise of nearly 7% since last week’s closing bell and indeed around the same gain on Wednesday’s close.
Talking heads everywhere will now cast wonder at what happened. But if you looked closely, you could have seen the clues. Let’s follow the trail of breadcrumbs.
Declining Yield
First, the 10-year yield has been falling somewhat since a peak in October. Rather amazingly even to us (and we never saw a chart we didn’t want to draw more lines on) the yield has traded almost perfectly in line with standard Fibonacci extensions and retracements this year. The final Wave 5 of the multi-month move up has peaked thus far just below the .786 extension of the combined Waves 1 and 3, a textbook top; and has since then sold off. It may reverse and move up once more but if the pattern holds true, we could yet see it decline to 3.6% (the 0.236 retracement of the whole 5-waves up) or indeed 2.7% (the 0.5 retracement of the same). Yields down equals stocks up, all things being equal, and for reasons not fully understood by ourselves, investors convince themselves that the QQQ is particularly yield-sensitive and so the steep drop in the yield lately cued the steep rise in the Nasdaq.
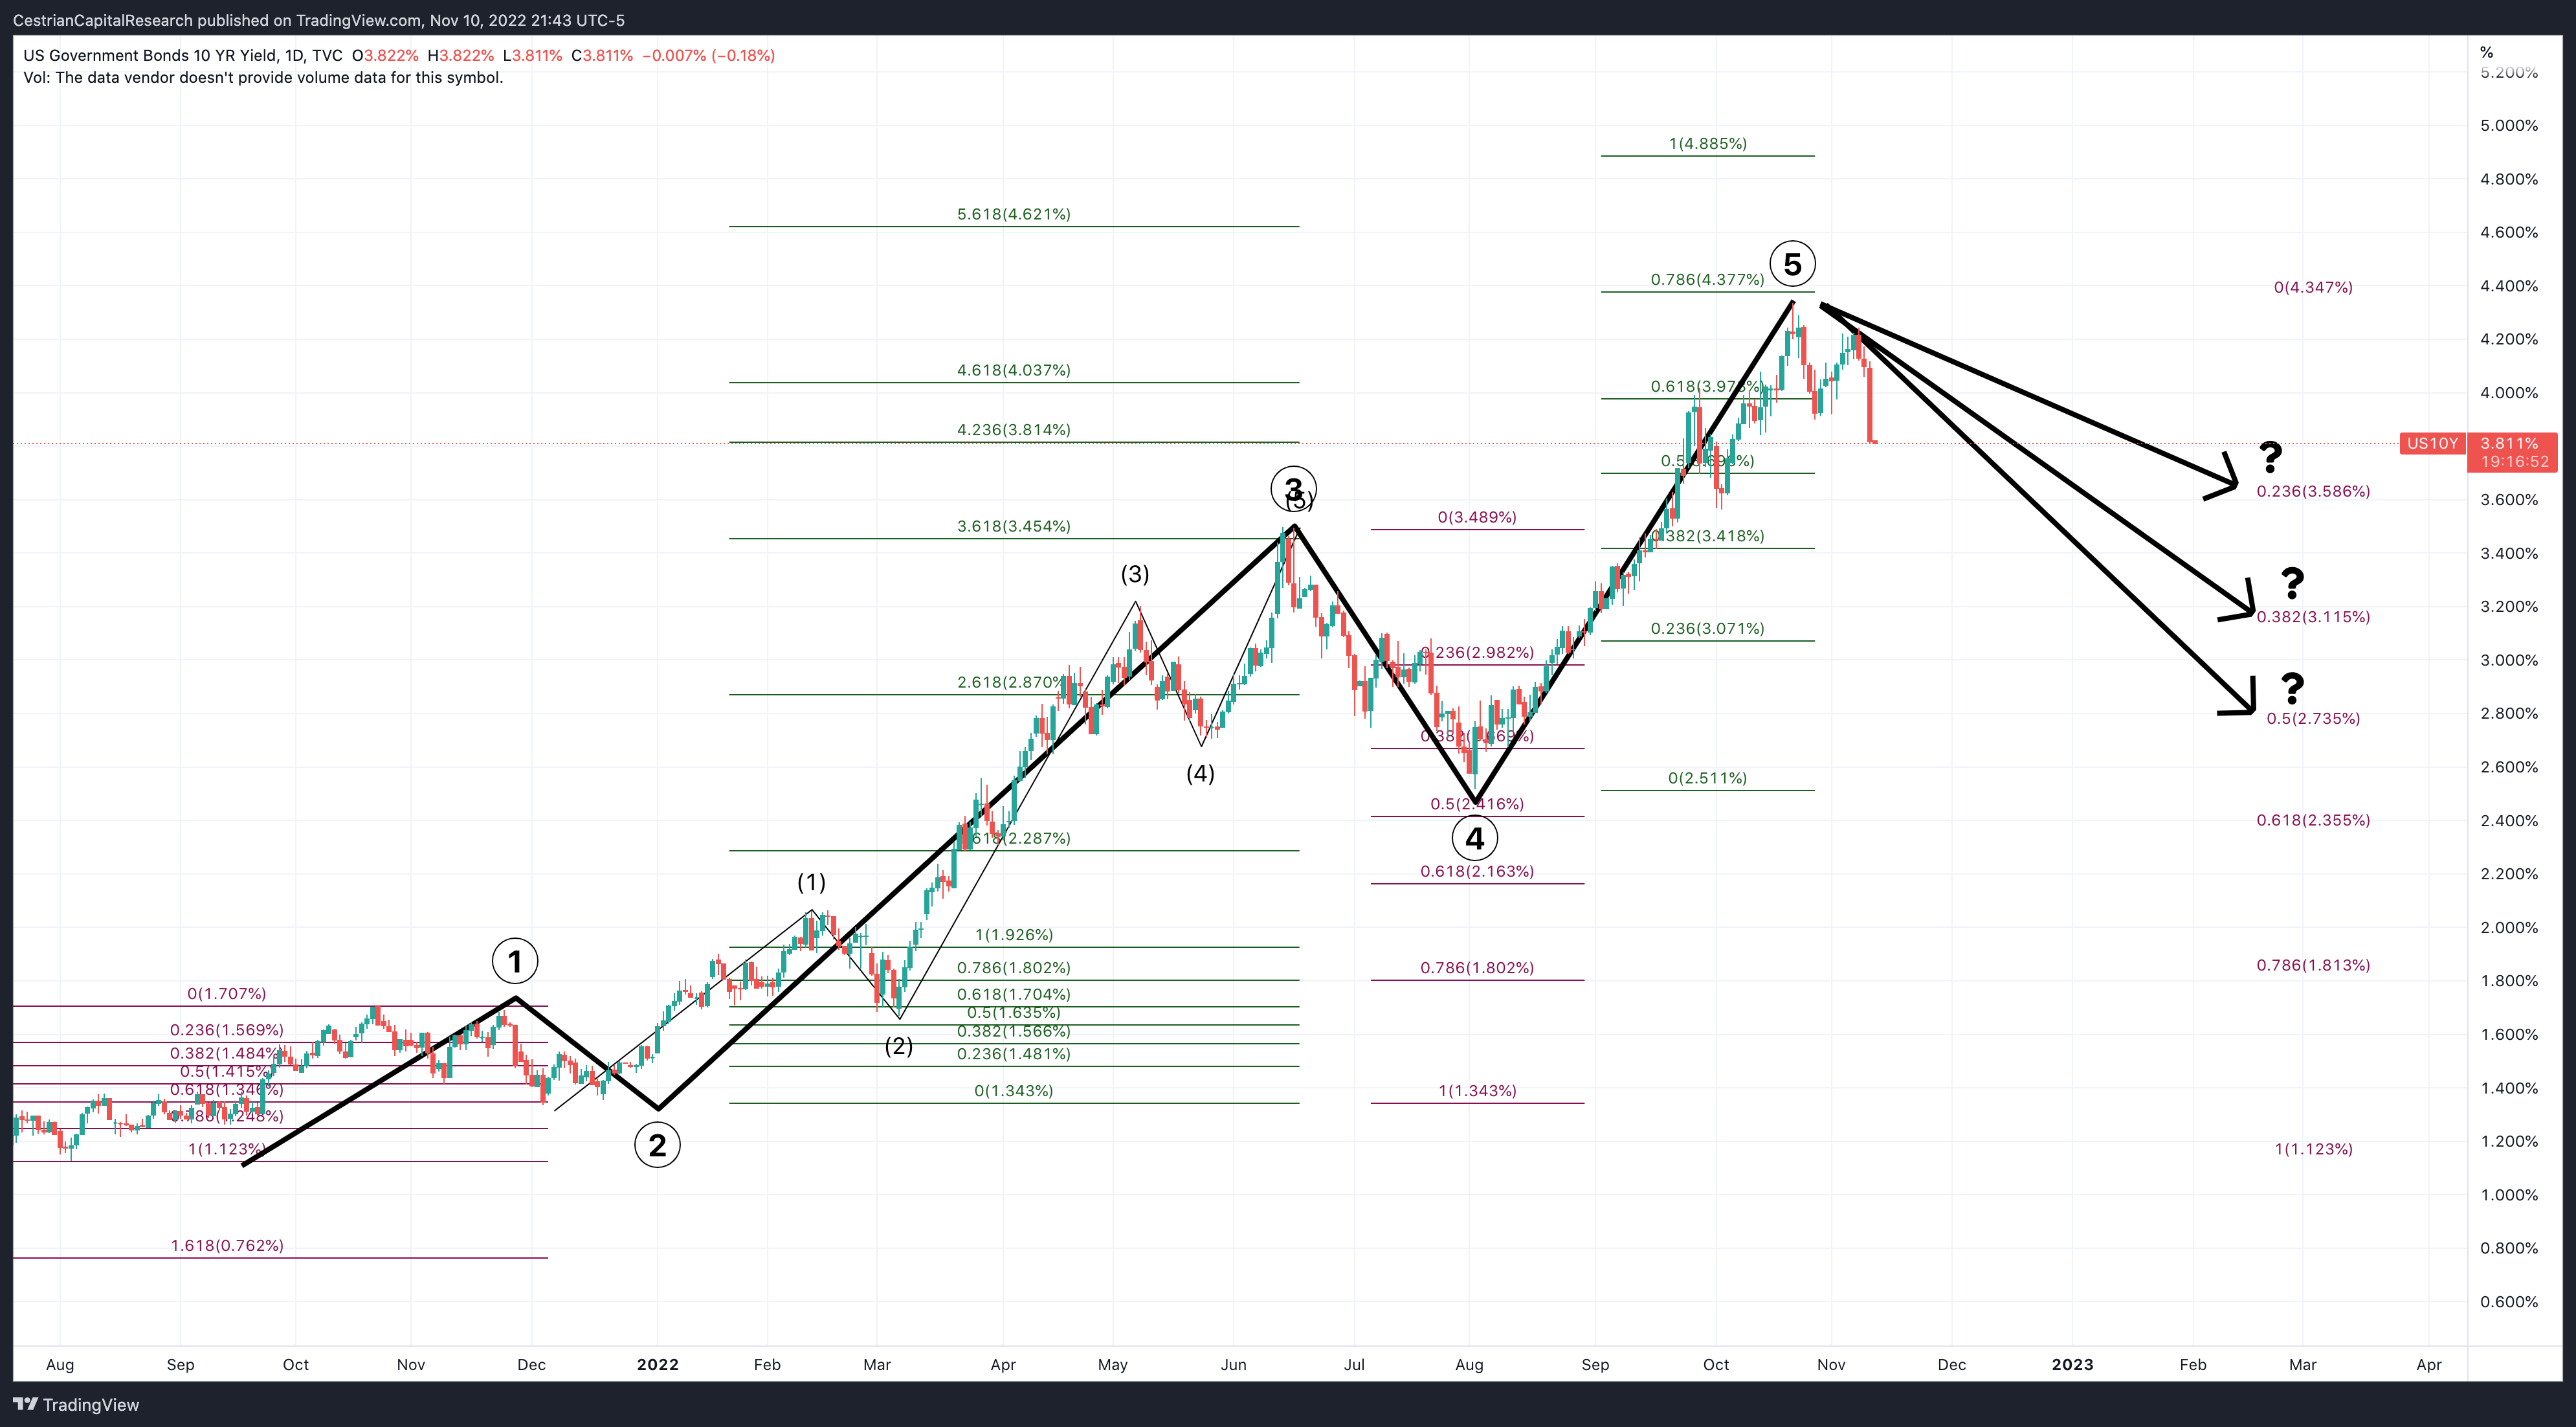
10-year Yield Chart (TradingView, Cestrian Analysis)
Declining Volatility (No, Not The Vix)
Since Chad and the Bros worked out how to play the Vix to their advantage in 2020, Big Money’s counter move was to learn how to depress equity markets all year without really spiking the Vix. (The secret weapon – index puts, but that’s for another day). So we don’t bother watching the Vix except with our one lazy eye. What we have learned to watch is the MOVE index which as you know tracks bond market volatility. Here’s how it has played out this year so far.
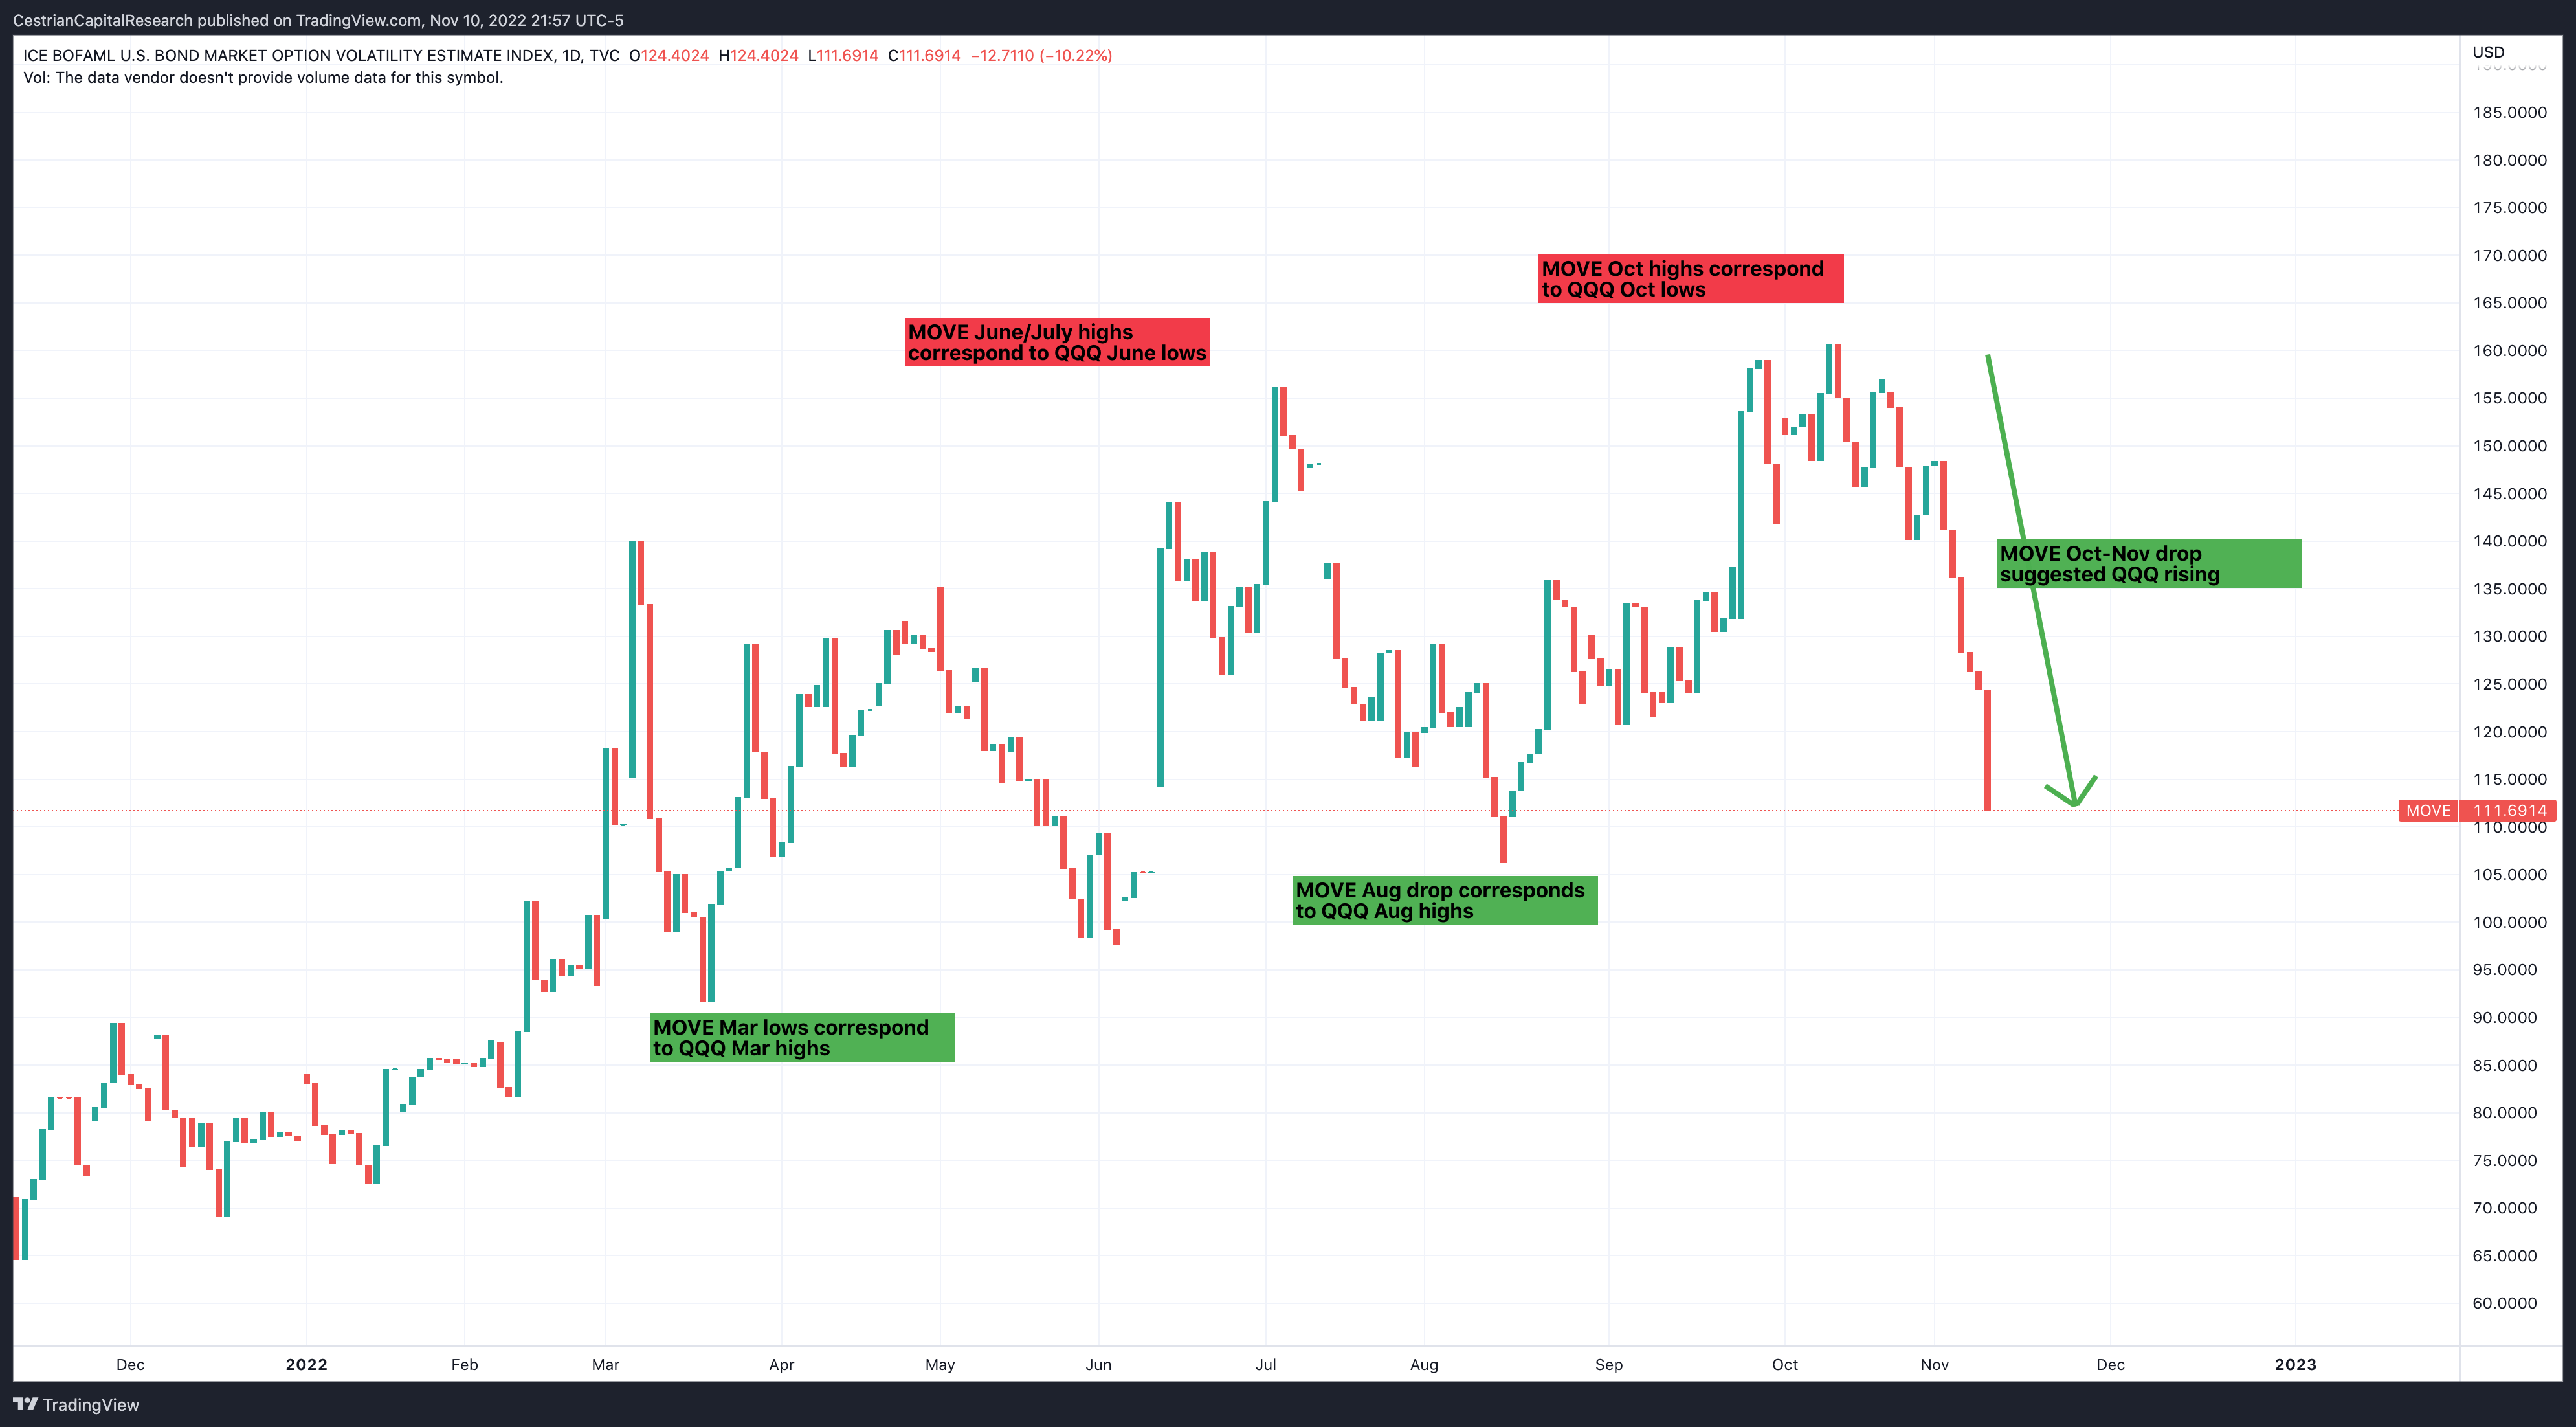
MOVE Index (TradingView, Cestrian Analysis)
OK, so, now we have declining yields and declining bond market volatility.
This meant the scene was set for a big move up in the Qs.
The Grand Rug Pull (Episode #64 of 2022)
The fakeout was Wednesday. Wednesday, as foretold by, oh, everyone, FTX teetered and failed. Because, to quote one of our subscribers, “who could have foreseen that posting billions in collateral denominated in your own magic internet money, that you yourself created, could have ended so badly?”. Since Big Money has been telegraphing for some time now that it was going to get ahold of crypto and run it for the grownups this time, there was no reason in our mind why one frat boy’s meltdown ought to cause the End of Days in the Nasdaq. The 10-year yield and the MOVE index were saying that CPI would likely be fine, and so not wanting to have to deal with stranded shorts we stayed unhedged. Not worried at all (*).
(*) little bit worried.
Once Big Money had scared everyone into dumping their risk assets Wednesday, along came the inevitable rug pull when CPI came in a little less hot than expected – see our comments on the CPI print, here. Cue furious rebuying, short covering and all manner of crimes against calm. Towards the end of the day the rally was assisted by call buying, at a level not seen for some time (source – SpotGamma).
And the day looked like this in the end. The volume x price indicator on the right-hand side tells you there was early yikes-short-covering followed by max FOMO in the high $270s. (You can open a full page version, here).
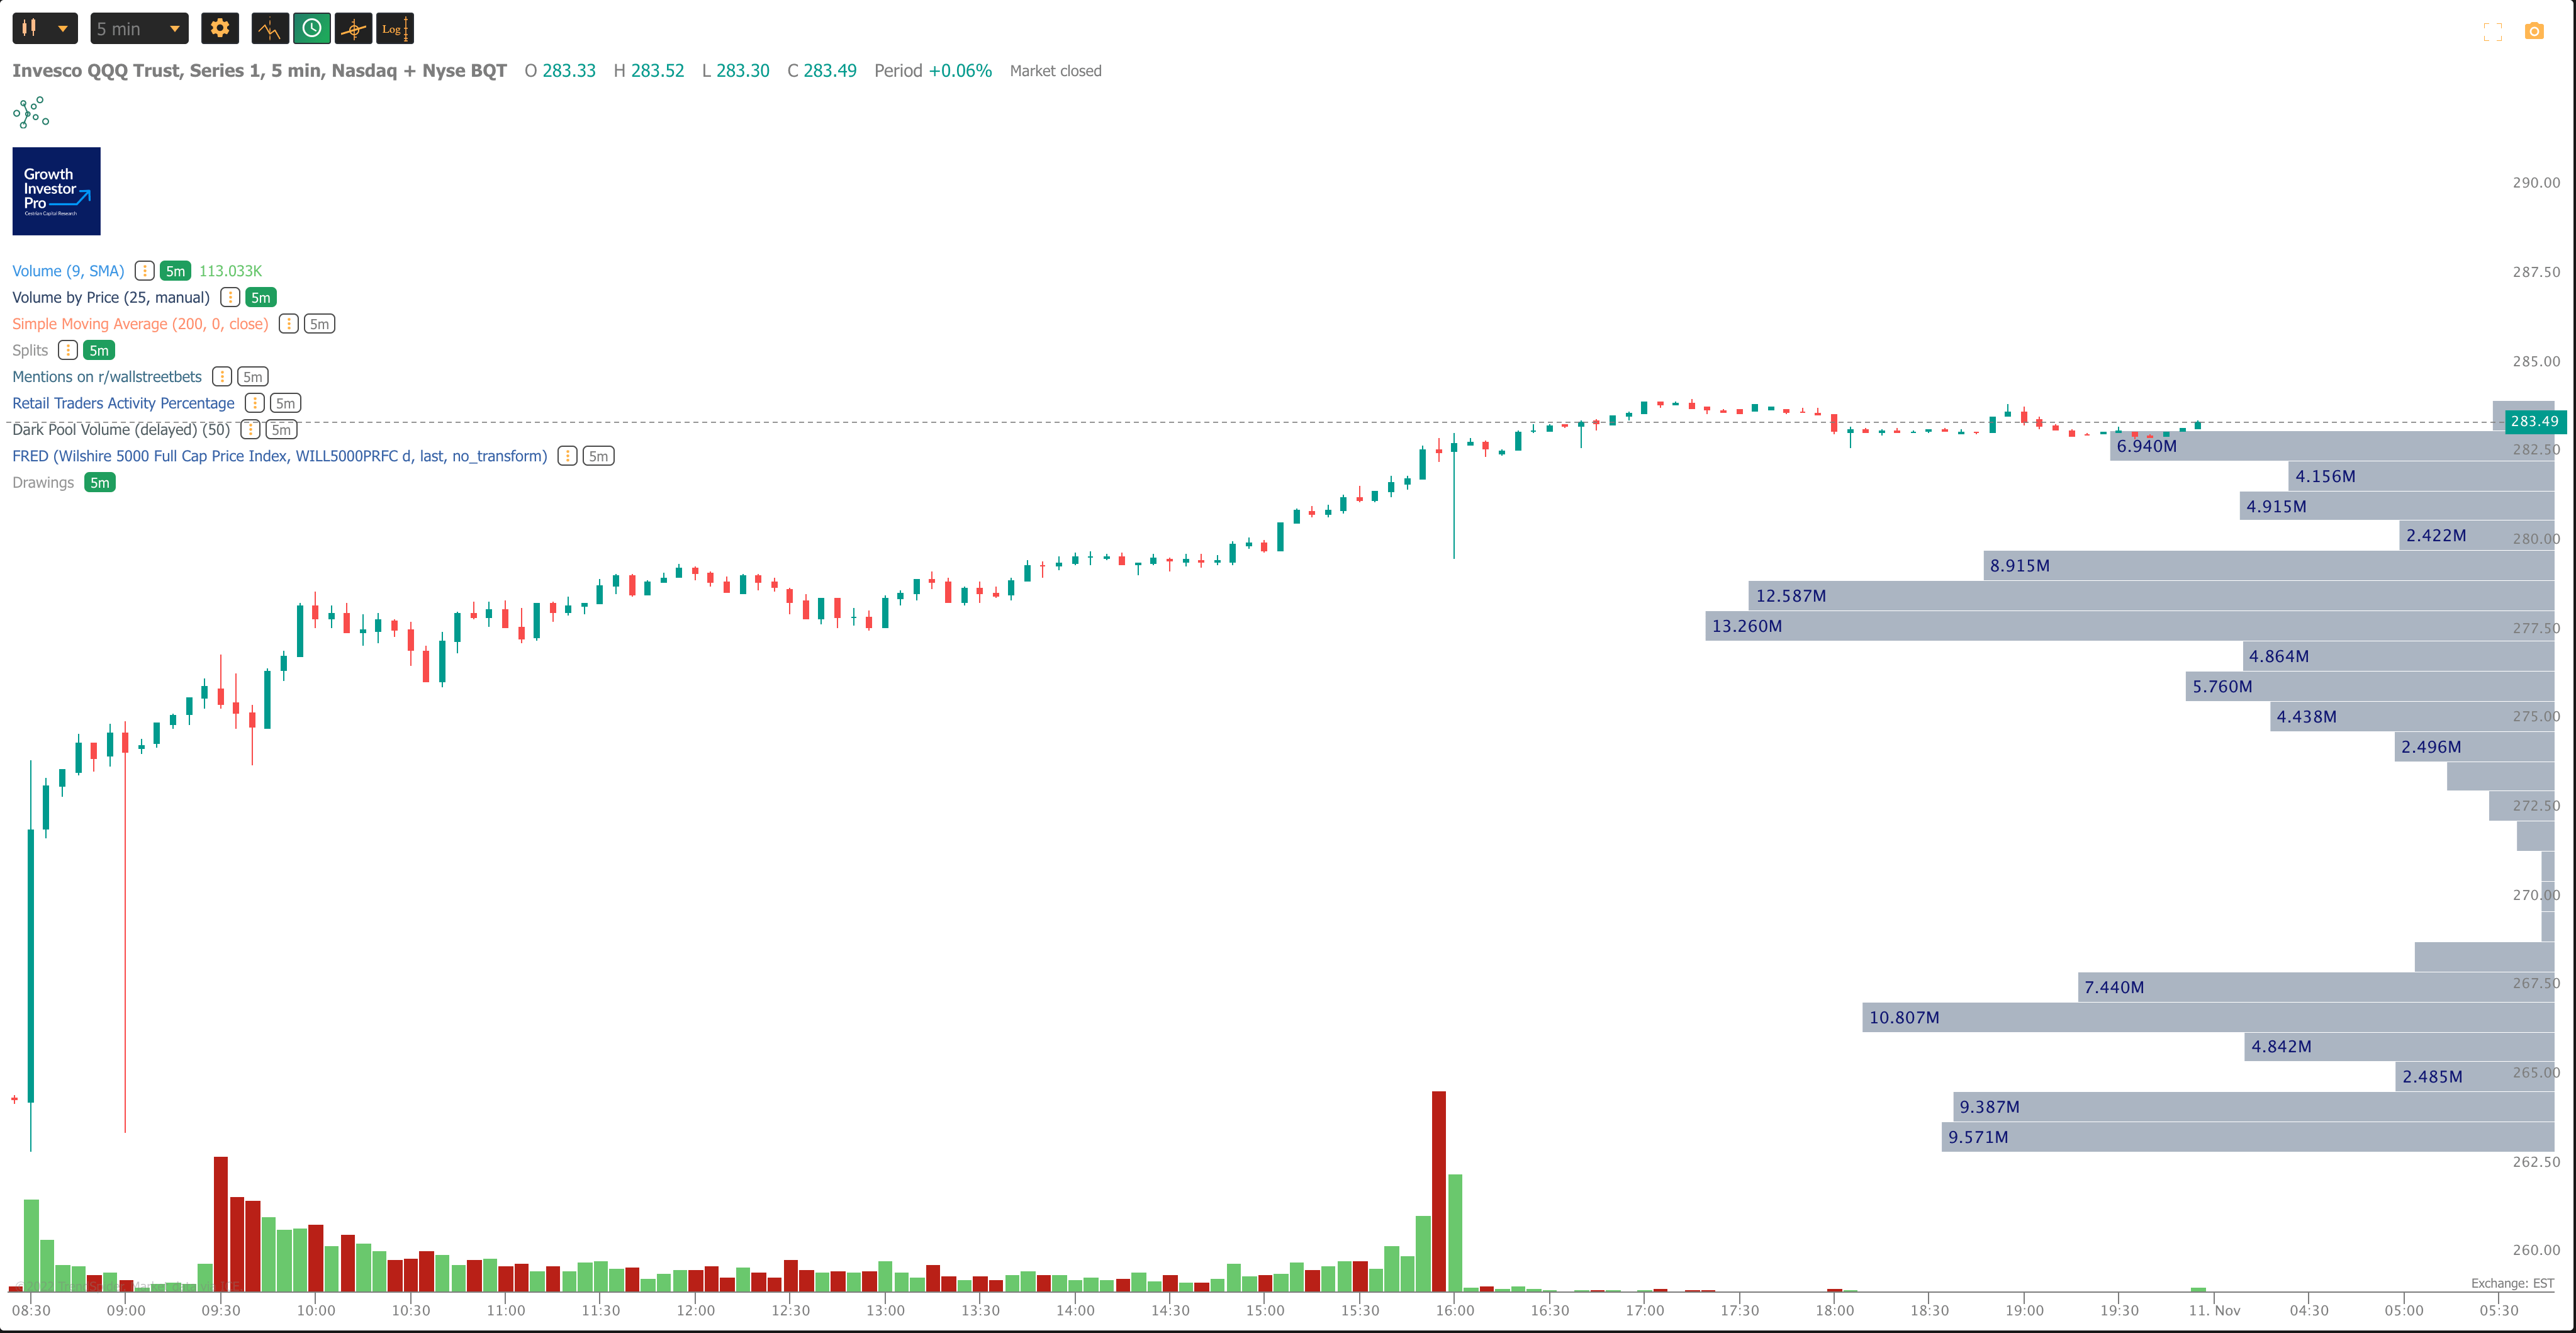
QQQ Chart (TrendSpider, Cestrian Analysis)
So, where next? Well, despite today’s performance, the Nasdaq still looks weaker than the S&P or the Dow in its recovery off of the October lows.
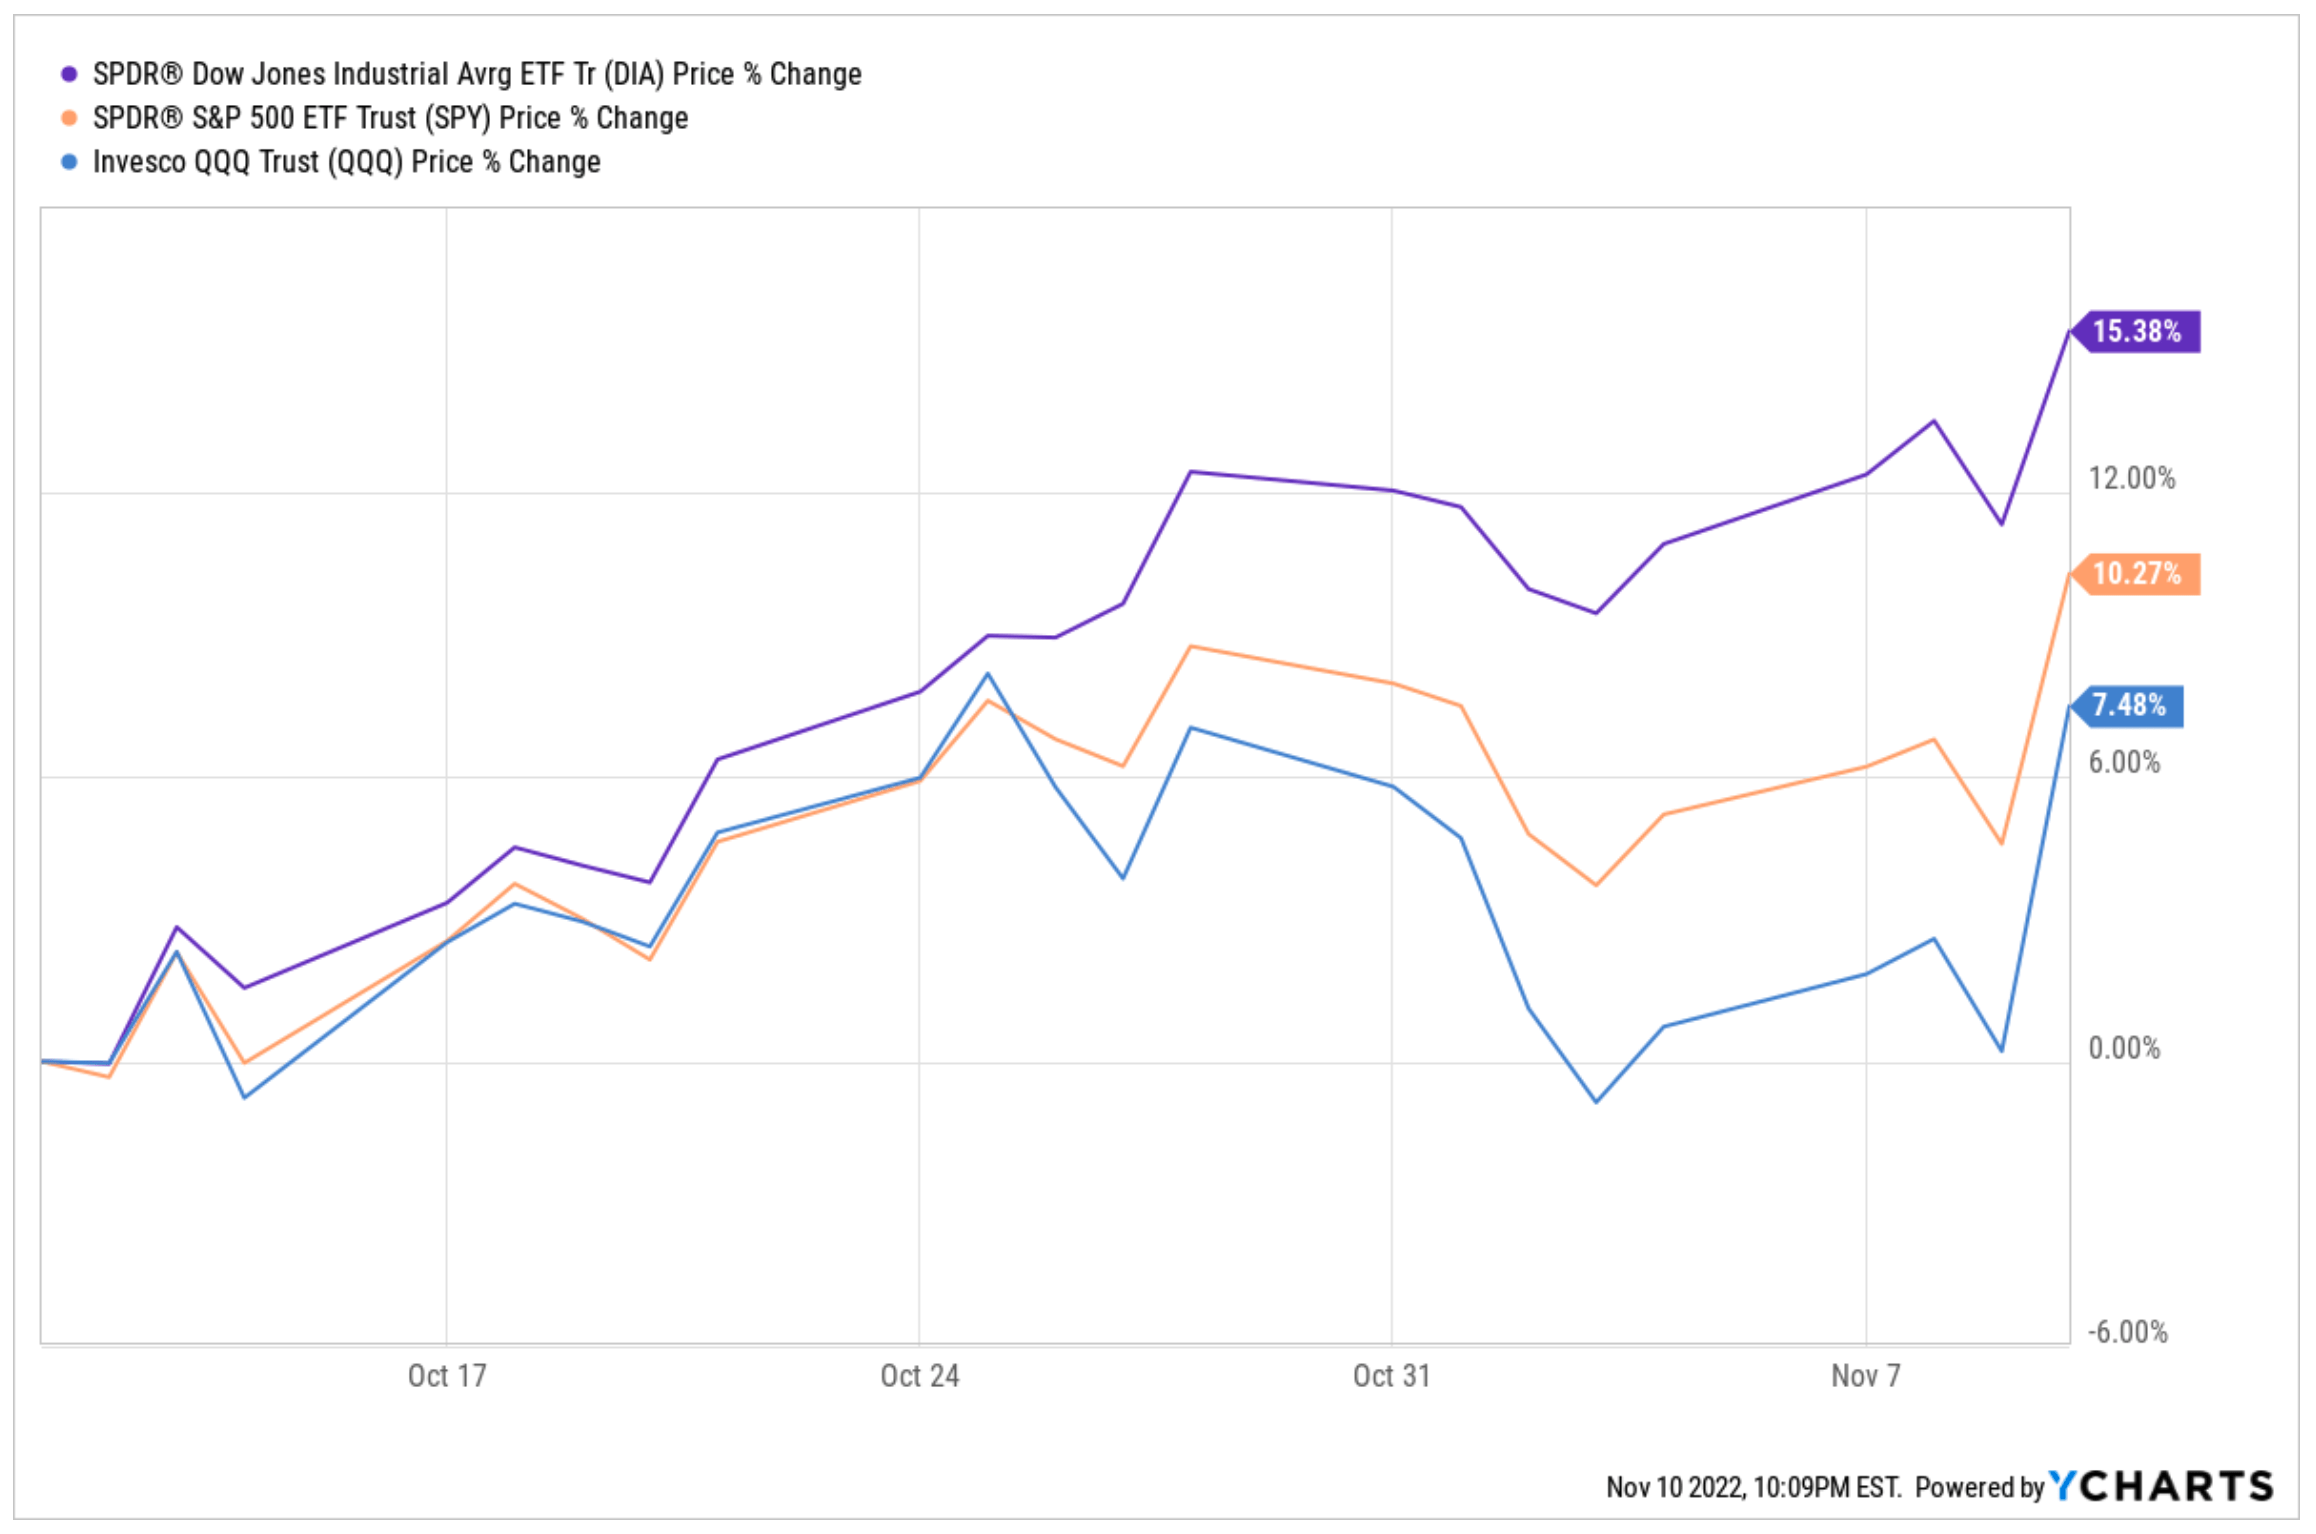
Dow vs SPY vs QQQ (YCharts.com, Cestrian Analysis)
If you zoom out and look at the larger degree, the Dow is threatening to make new highs way before the Nasdaq.
Here’s the DIA, which has already recovered to above the 0.236 retracement of the drop from the prior all-time highs.
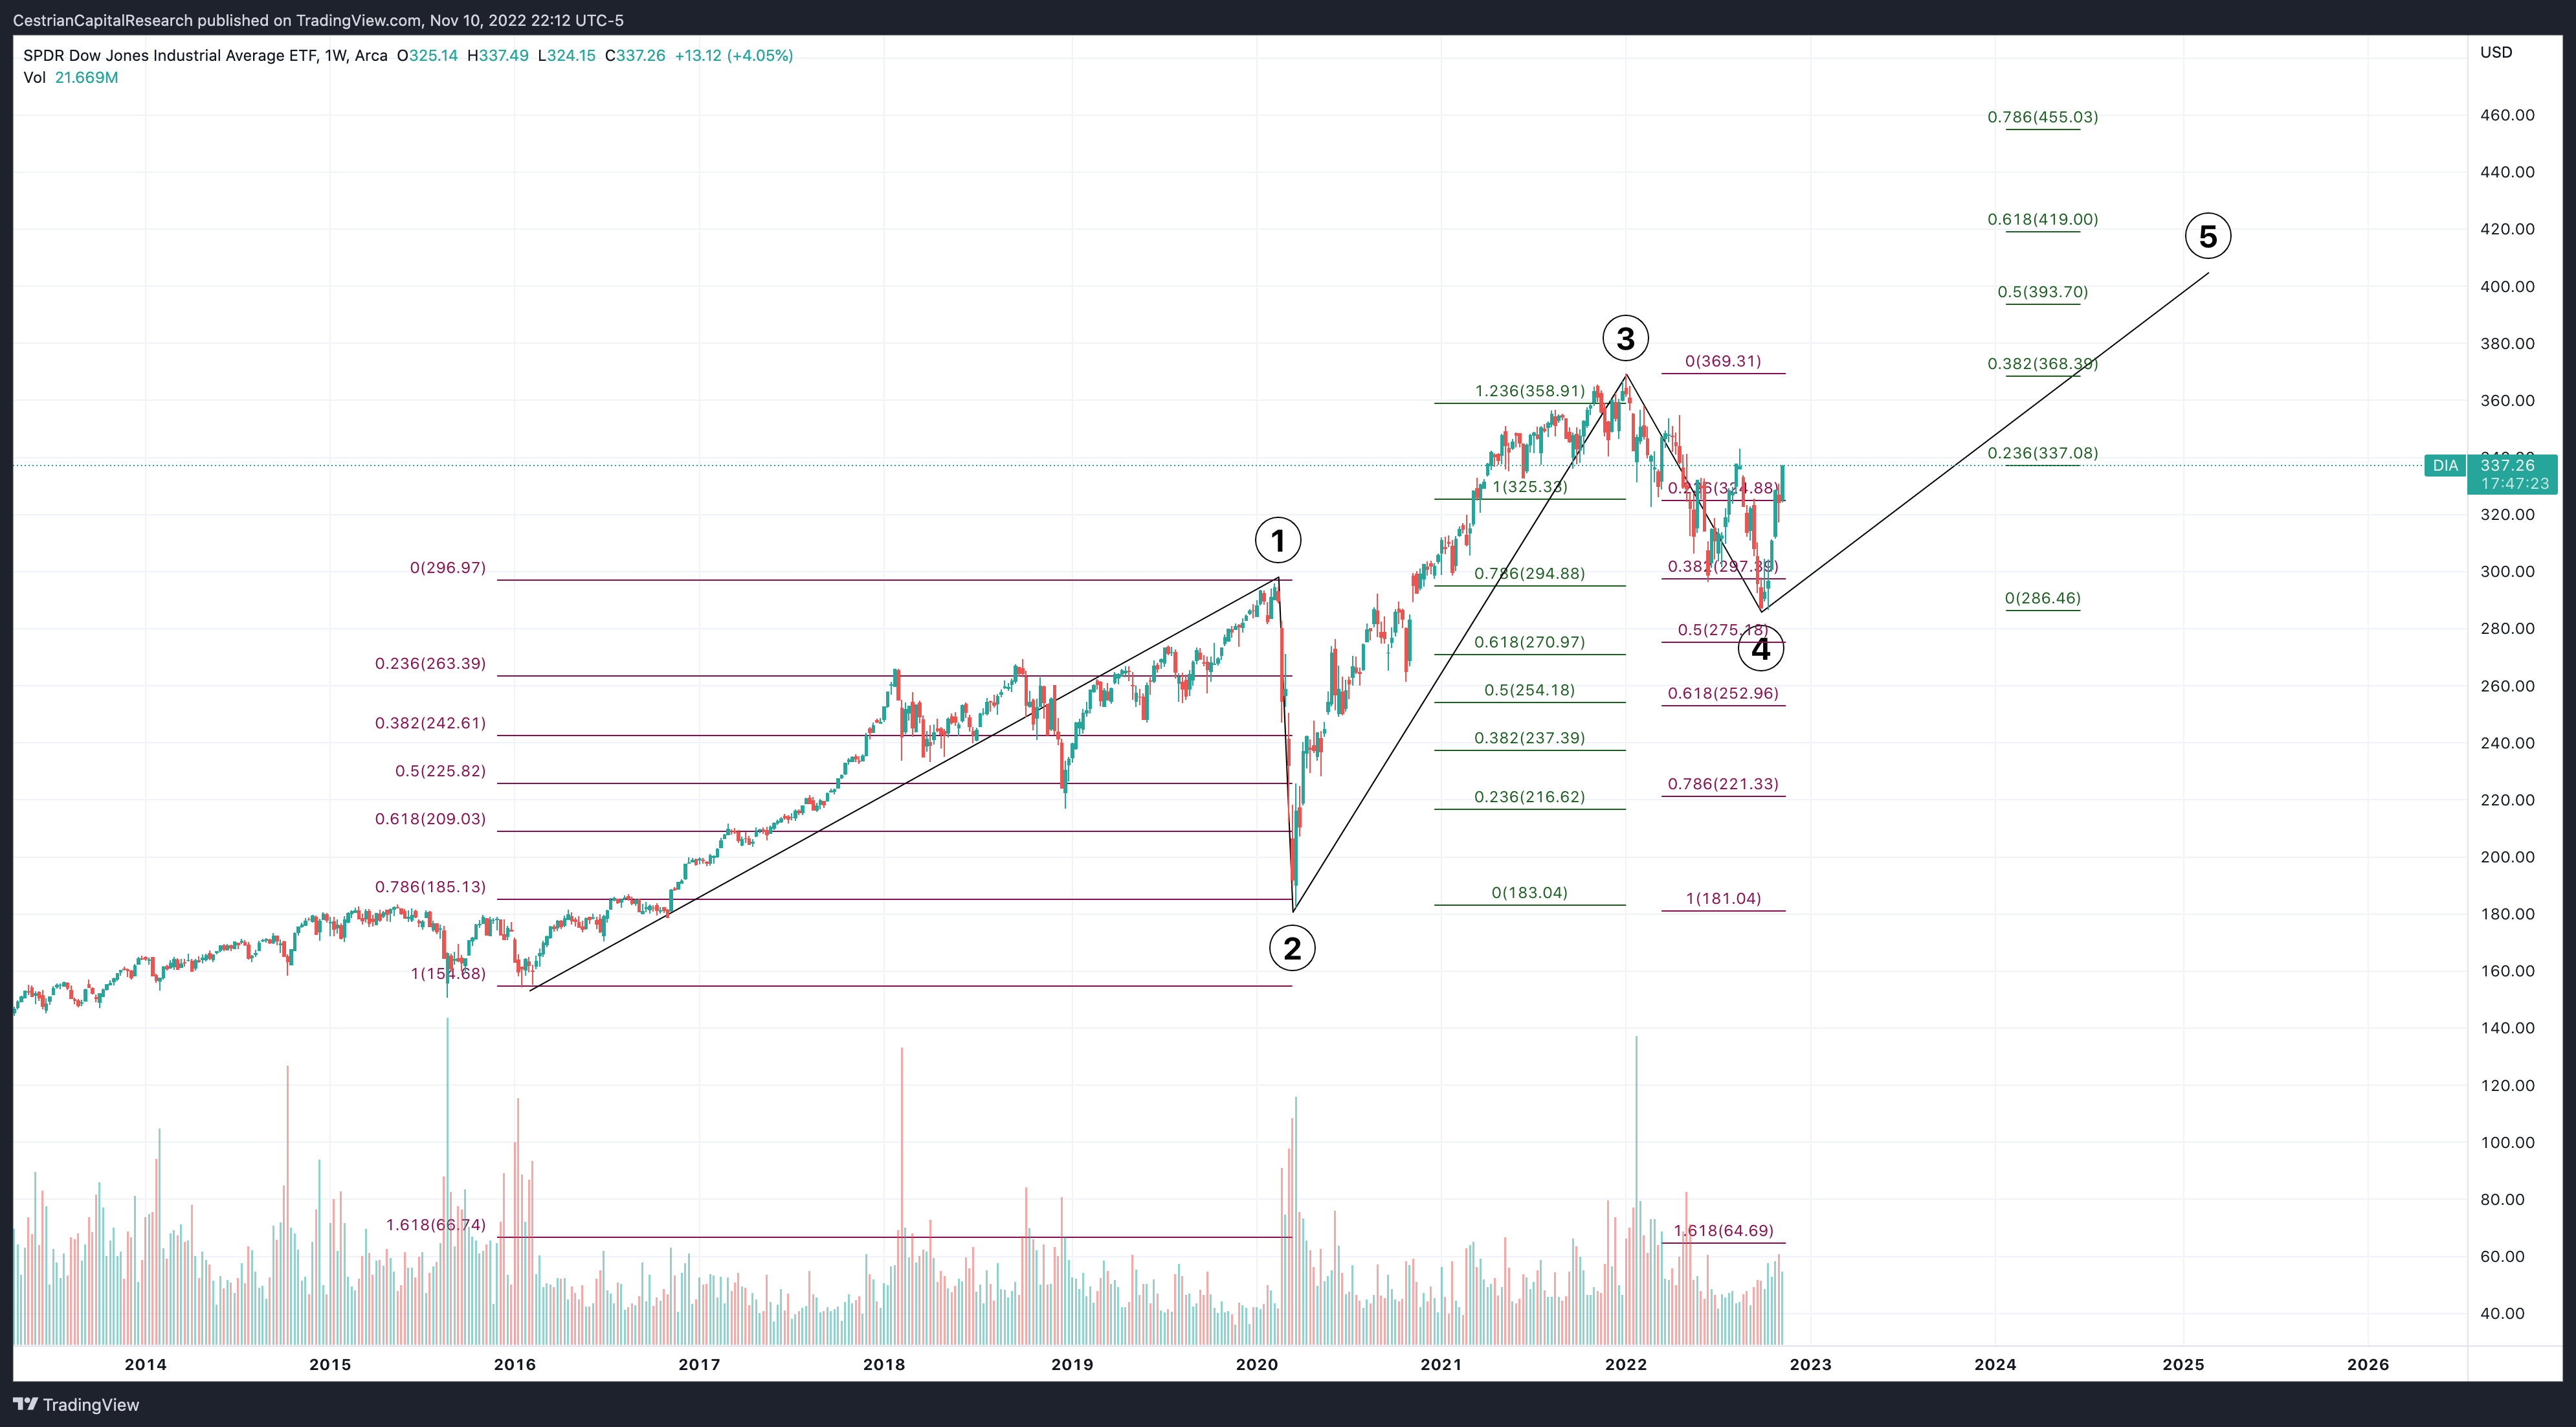
DIA Chart (TradingView, Cestrian Analysis)
So whilst we are bullish on the Nasdaq – more bullish than most, since this is far from our first Tech Wreck Rodeo (we’re old folks here at Cestrian) and we remember the doom and gloom in 2001 and the it-won’t-ever-make-new-highs-not-ever-again-ever in 2011 – we think it has some work to do yet.
Here’s Grandpappy Dow, Big Brother S&P and errant teenager QQQ, % off highs over the last 12 months.
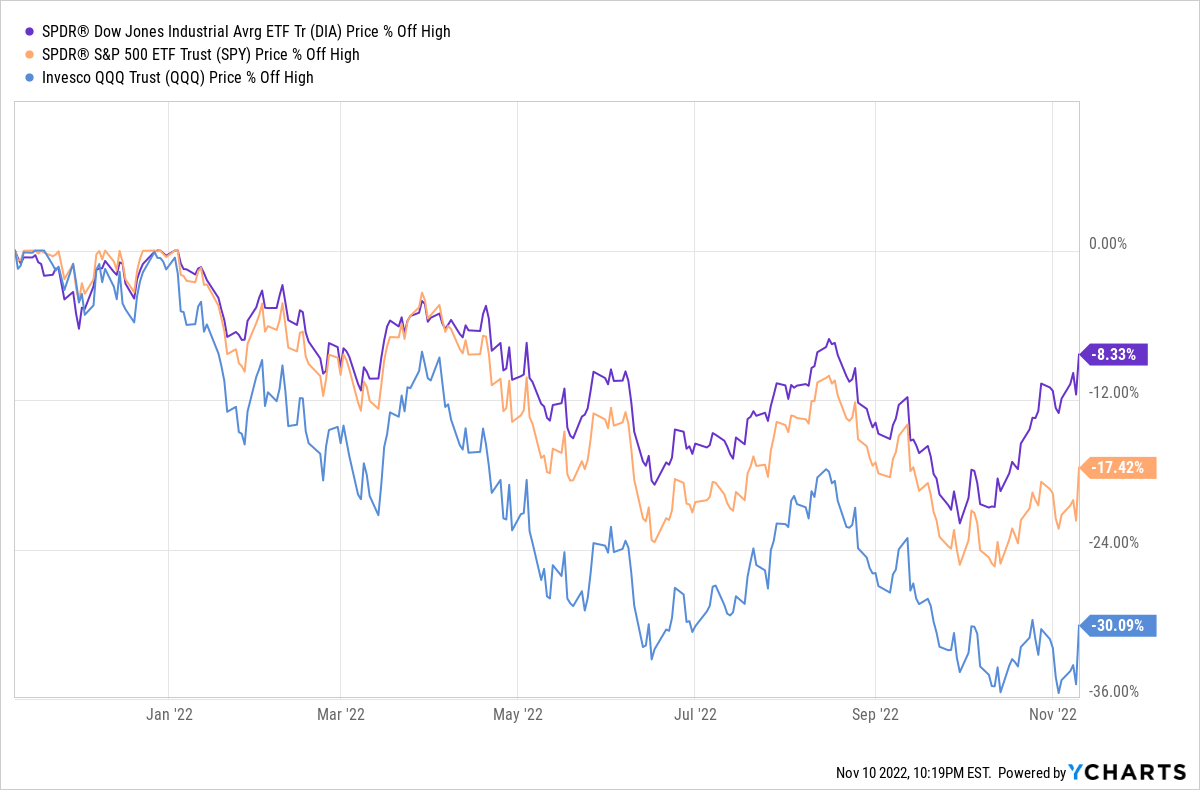
Dow vs SPY vs QQQ % Off Highs L12M (YCharts.com)
We’re now hedged in our Growth Investor Pro service and in staff personal accounts. The hedges may glow a little red for a while but we’re confident we can cash them out green with a little patience, before the Qs set off once again in pursuit of that good dopamine high.
But What Really Happened And Why?
We can’t wait to find out from talking heads everywhere why Thursday happened. Now, pass the popcorn, Marjorie, and turn up tomorrow’s instalment of the news soap opera!
Cestrian Capital Research, Inc – 10 November 2022.
Be the first to comment