Darren415
A Look Back
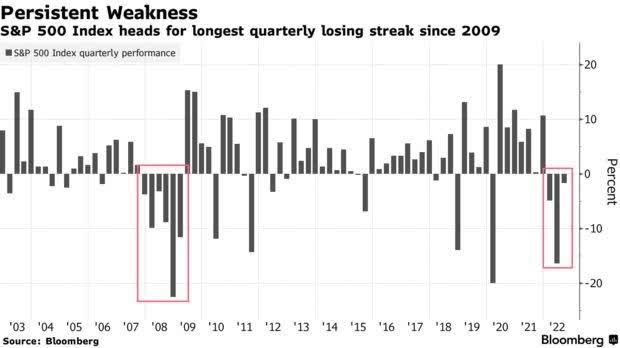
Most investors would like to forget the third quarter, which marked the S&P 500’s third consecutive negative quarterly return. We haven’t seen a worse streak since the financial crisis, when the S&P 500 fell for six consecutive quarters, erasing ~48% of its value. This past September was particularly bad, with the S&P 500 down 9.3%, the NASDAQ 100 declining by 10.6%, and the Russell 2000 falling by 9.7%. Global investors weren’t spared, either, with the FTSE 100 down 5.2%, the Euro Stoxx 50 index losing 5.2%, and the Nikkei falling 7.0%.
Even investors in “safe” U.S. 10-year Treasuries experienced a price decline of over 5%, and the Bloomberg Commodity Index lost 8.4%. Investors had no place to hide in September except in the safety of cash (historically a terrible long-term investment, especially amid high inflation), so it’s hardly surprising that they withdrew $20.9 billion from U.S. stock funds during the third quarter, based on estimates from the Investment Company Institute.

Should You Adjust Your Portfolio Based on the Midterm Election Results?
The midterm elections are just around the corner, and our crystal ball’s view of the results is cloudy. Regardless of the outcome, investors should not make significant changes to their portfolios based on election results. David Dubofsky writes in Barron’s that the stock market has historically been strongest under a Democratic president combined with a divided or Republican Congress, but by his own admission, his sample size is incredibly small. Of the 19 presidential elections since the end of World War II, only 10 brought a change in the party occupying the Oval Office.
Likewise, the 38 Congresses during that same period saw only 8 changes in control of the House and just 14 in control of the Senate. So, no matter how high emotions run over politics, investors would do well to keep their emotions in check and focus instead on the fundamentals of the companies they own or would like to buy.
A Look Ahead
What should U.S. stock market investors expect for the near and medium term? The historical record might provide some comfort. According to data from the Stock Trader’s Almanac, since World War II twelve bear markets (which represents most bear markets that have taken place over the same period) have ended in October: 1946, 1957, 1960, 1962, 1966, 1974, 1987, 1990, 1998, 2001, 2002, and—for all practical purposes—2011. (At one point in 2011 the S&P 500 had declined 19.4%, just shy of the technical definition of a bear market.)
Even more encouraging, seven of these years coincided with a midterm election (as 2022 does, with congressional elections occurring on November 8). As Jeff Hirsch of the Stock Trader’s Almanac notes, “The fourth quarter of the midterm years combines with the first and second quarters of the pre[presidential]election years for the best three consecutive quarter span for the market, averaging 19.3% for the DJIA and 20% for the S&P 500 (since 1949), and an amazing 29.3% for the NASDAQ (since 1971).”
In addition, according to the Wall Street Journal, the S&P 500 has moved higher in every 1-year period following a midterm election since 1942 and has posted an average gain of ~15% for post-midterm years since the end of World War II.
We would not be surprised to see a fourth-quarter rally, as the U.S. equity market is giving every impression of being majorly oversold at present, but investors should temper their expectations in the face of many near-term headwinds, including the war in Ukraine, a hawkish Federal Reserve, ongoing supply chain concerns, and continuing high inflation.
In another sign that the worst of the selloff could be behind us, demand for bullish S&P 500 index call options has resulted in their highest price relative to bearish puts since 2017. It is also worth noting that the latest reading from the American Association of Individual Investors (AAII), surveying members’ views on where the stock market will be in the next six months, was negative compared with its historical average (45.7% of respondents had a bearish view vs. its 30.5% historical average).
As the AAII website states, “[t]he Sentiment Survey is a contrarian indicator. Above-average market returns have often followed unusually low levels of optimism, while below average market returns have often followed unusually high levels of optimism.”
While the S&P 500 is not particularly cheap by historical standards at ~16.4x earnings (fwd.), the S&P 500 equal-weighted index is selling at valuations similar to those seen in April 2020, when COVID-19 lockdowns were in full swing, and the stock market was in freefall. Since we invest across the market capitalization spectrum and not just in mega-capitalization names, we see the S&P 500 equal-weighted index (currently selling at ~14.0x earnings [fwd.]) as offering a more apt valuation comparison than the traditional S&P 500, which weights the largest companies far more heavily.
Hopeful Signs for Moderating Inflation
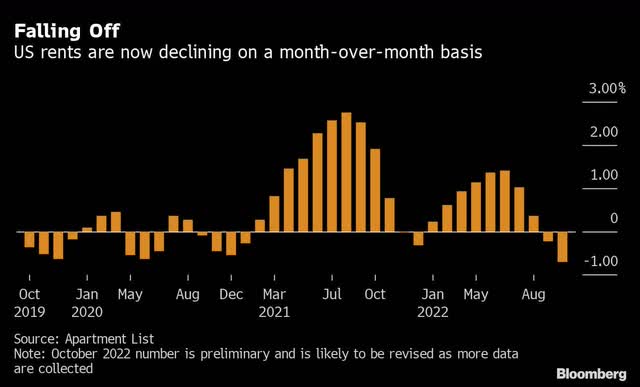
The unrelenting pace of inflation looms large among the many reasons for the current stock market swoon, as does the hawkish stance the Federal Reserve is taking to combat it. However, signals from the housing market (shelter accounts for about a third of the Consumer Price Index [CPI], which measures inflation) show that conditions may finally be moderating, with preliminary data for October from Apartment List showing the steepest month-over-month decline in household rents since 2017.
Because the CPI measures what renters are currently paying and implicit rent that owner occupants would have to pay if they were renting their homes without furnishings or utilities, this downward trend will take some time to meaningfully show up in the CPI (perhaps up to 6-9 months, according to Mark Zandi, chief economist at Moody’s). Nevertheless, it is a promising sign that inflation could soon start to slow.
Fueled by rapidly rising mortgage rates (fixed-rate 30-year mortgages started 2022 at a little over 3% but are now above 7%) that significantly increase the cost of financing a home, housing prices have fallen for the third straight month since reaching a record high of $413,000 in June. Demand, and likely prices, should continue to fall, with the mortgage applications purchase index down 38% from a year earlier for the week of October 14.
Other areas of the economy that contributed to the inflation problem also seem to be slowing significantly, as CNBC’s Ron Insana pointed out on October 14, 2022:
- The cost of shipping a container from Asia to the U.S. West Coast has reportedly fallen from about $20,000 to roughly $2,400 in just a year. At the same time, the queue of ships heading into western ports, once clogging shipping lanes, has dropped sharply.
- Oil prices, after a surge on the OPEC+ move to cut production by 2 million barrels per day, have dropped below $88, putting a lid on gasoline prices, which are very tightly correlated to CPI.
- Industrial commodity prices, like those of lumber and copper, often a measure of excess demand for everything from cars to computers to houses, are also down sharply from their most recent highs.
Investors should remember that just as inflation took a long time to increase, the return to normal levels will also take some time—inflation cannot be turned off and on like a switch. Unfortunately, market participants (and Federal Reserve officials) are unbelievably impatient. At present, we are most concerned (for the sake of both the real economy and the stock market) about whether the Fed will act too aggressively to tame inflation, causing more harm than good.
How Do Bear Markets End?
Many clients have asked us whether a full-blown equity washout, à la 2007-2009 (where the S&P 500 fell 56.8% from its October 2007 peak to its March 2009 trough), is needed to kill the bear. CNBC’s Michael Santoli (and a previousThe World According to Boyar podcastguest) answered this question well:
“There is no single textbook manner with which bear markets end. Often there is a crescendo of panic reflected in wholesale liquidation of stocks and a desperate bid for downside protection that registers in a vertical spike in the Volatility Index to a new high near or above 40. Then there are times when a combination of time and grinding price declines continues until selling dries up and investors lose interest.”
The good thing about both recessions and bear markets (if history is any guide) is that they eventually do end, although whether they end with a bang, or a whimper is not set in stone. Regardless, as we have said many times, trying to time stock market entries and exits is a fool’s errand (and a recipe for financial disaster). Instead, investors should focus on identifying good businesses selling at attractive prices—we find that generally when you do so, good things tend to happen (provided you are patient and can take the pain of an extended bear run).
Do Higher Interest Rates Mean That Stocks Need to Decline?
Pundits see higher bond yields as a sign that equity valuations need to further compress (after all, higher bond yields are competition for stocks), but a look at the historical record contradicts that notion. According to Bespoke Investment Group, the yield on the investment-grade bond index is ~5.6%, right around the 35-year median yield, and at the same time the P/E of the S&P 500 is close to its historical average, which Michael Santoli sees as a sign that “‘average’ equity valuations are not far out of whack.”
Approximately 7 months ago, investors were willing to accept that same 5.6% yield they are currently receiving for investment-grade fixed income for lower-rated junk bonds. Times sure have changed! As Santoli also points out, “the most extreme overvaluation of large-cap stocks and wildest speculation in no profit upstarts occurred at a time when Treasuries yielded 5-6% in the late-’90s. Appetites and crowd psychology drive markets in the shorter-term, not math.”
Are We in the Run-up to a Small Cap Rally?
Small cap companies are particularly attractive, in our opinion, and have been hit hard during the selloff, with the S&P 600 (an index consisting of smaller capitalization companies) declining 17% YTD through October 25. Not only are they historically cheap, trading at just 11.5x expected earnings (below their 20-year average of 15.4x and the S&P 500’s 16.5x), but they are significantly more insulated from the negative effects of a strong U.S. dollar than multinational companies that sell more of their goods/services overseas.
According to the Wall Street Journal, components of the S&P 600 generate just 20% of their sales abroad versus 40% for the larger-cap S&P 500.
Will Today’s Losers Be Tomorrow’s Winners?

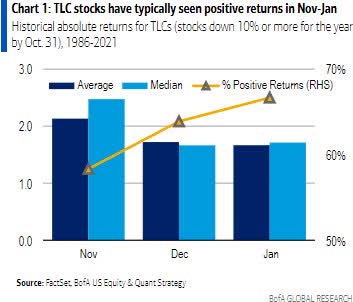
Nothing is certain in investing, but historically, stocks that have been down 10% or more from January 1 through October 31 have risen by an average of 5.5% in the remainder of that year, according to Jessica Menton of Bloomberg: “Most mutual funds have to sell stocks by the end of October in order to register the losses and offset them against gains in other equities. After that, they can resume purchases.
Not surprisingly, then, a strategy of owning tax-loss candidates (TLC) from November to January has a stellar track record, with those shares up 100% of the time in years when the index was down through October.” 2022 may turn out to be a particularly fruitful year for this strategy with well over 300 stocks down more than 10%, compared to the typical 100 or so stocks that decrease 10%+ in a given year,” according to the Bank of America.
Deal or No Deal?
The once red-hot IPO market has come to a standstill, and the performance of the stocks that went public during the pandemic frenzy has been abysmal. According to Sujeet Indap writing in the Financial Times in an article that was published on October 18, 75% of large U.S. companies that went public during the pandemic are selling below their IPO price, and the group’s median return is a negative 44%.
With so much money already having been raised by private equity firms (according to Preqin, U.S. private equity firms are sitting on more than $500 billion in dry powder), it will be interesting to see whether they take private some of these former high-flyers that have now crashed down to earth. We expect a reasonable amount of deal activity due to the amount of cash that private equity must deploy, but we would be surprised if former market darlings such as Robinhood (down 84.6% from high), Lyft (down 78.0%), or Peloton (down 95.5%) ever see prices anywhere near their pandemic fury peaks again.
RIP Negative Interest Rates
Forgive us for being old-fashioned, but we have never understood the concept of negative interest rates. What rational investor would buy a bond guaranteed to lose money over the life of the investment? Fortunately, the negative interest rate experiment seems to be ending (with predictably dreadful results). According to the Financial Times, at the end of 2020, ~$18 trillion in debt was trading at negative interest rates, but that number has fallen to less than $2 trillion (all in Japan).
At the height of the pandemic, as JP Morgan reports, 40% of the government bonds universe had a negative yield—but how did this turn out for investors holding these bonds? Consider, for example, the German 30-year federal bond: “investors” who bought it in August 2019 are now nursing a paper loss of 46%.
Although stock market results for the year to date (and September’s results in particular) have been extremely disappointing, patient long-term stock market investors should not be disheartened. As counterintuitive as the idea might feel at the moment, bear markets are our friends because they create opportunities for us to purchase businesses at bargain basement prices. Without months like this past September, we wouldn’t be able to set ourselves up for potential future outsized gains.
As famed investor Shelby David once wrote, “Out of crisis comes opportunity. You make most of your money in a bear market. You just don’t know it at the time.”
Best regards,
Mark A. Boyar | Jonathan I. Boyar
IMPORTANT DISCLAIMERPast performance is no guarantee of future results. Investing in equities and fixed income involves risk, including the possible loss of principal. The S&P 500 Index is included to allow you to compare your returns against an unmanaged capitalization-weighted index of 500 stocks designed to measure performance of the broad domestic economy through changes in the aggregate market value of the 500 stocks representing all major industries. The Russell 2000® Value Index measures the performance of the small-cap value segment of the U.S. equity universe. It includes those Russell 2000® companies with lower price-to-book ratios and lower forecasted growth values. The S&P 1500 Value Index measures value stocks using three factors, the ratios of book value, earnings, and sales to price, and the constituents are drawn from the S&P 500, S&P Midcap 400, and S&P SmallCap 600. The Dow Jones Industrial Average is a price-weighted average of 30 significant stocks traded on the New York Stock Exchange and the NASDAQ. The volatility of the above referenced indices may materially differ from that of your account((s)), and the holdings in your account((s)) may differ significantly from the securities that constitute the above-referenced indices. Your results are reported gross of fees. The collection of fees produces a compounding effect on the total rate of return net of management fees. As an example, the effect of investment management fees on the total value of a client’s portfolio assuming (A) quarterly fee assessment, (B) $1,000,000 investment, (C) portfolio return of 8% a year, and (D) 1.50% annual investment advisory fee would be $15,566 in the first year, with cumulative effects of $88,488 over five years and $209,051 over ten years. This material is intended as a broad overview of Boyar Asset Management’s philosophy and process and is subject to change without notice. Account holdings and characteristics may vary, since investment objectives, tax considerations, and other factors differ from account to account. |
Editor’s Note: The summary bullets for this article were chosen by Seeking Alpha editors.


Be the first to comment