

NASDAQ 100, NIKKEI 225, ASX 200 INDEX OUTLOOK:
- Dow Jones, S&P 500 and Nasdaq 100 indexes closed -0.44%, +0.23% and +1.25% respectively
- Cyclical-linked energy, financials and industrial sectors underperformed
- Futures in Japan and Australia are lower, setting a sour tone for APAC stocks at open
Tech Rally, Pandemic, Oil, Gold, Asia-Pacific at Open:
Wall Street stocks traded mixed on Monday, with technology stocks outperforming. The Nasdaq 100 index rallied 1.25% to an all-time high, lifted by large-cap stocks such as NVIDIA (+5.01%), Facebook (+4.18%) and ASML (+2.61%). A strong rally in the Nasdaq 100 could boost sentiment for technology stocks across APAC. 7 out of 11 S&P 500 sectors closed higher, led by information technology (+1.11%), communication services (+0.82%) and utilities (+0.61%), whereas energy (-3.33%) registered a big loss as oil prices declined.
The upcoming earnings season could provide the stock market another boost as analysts forecasted a solid period of growth. This may pave the way for Nasdaq 100 to attempt higher highs in the weeks to come.
Daily Performance of Nasdaq 100 Top 10 Stocks – 28-06-2021
Source: Bloomberg, DailyFX
Crude oil prices pulled back from two-and-half year highs ahead of this week’s OPEC+ meeting, in which the oil cartel is expected to announce a production hike plan for August. Weaker oil prices may dampen the appeal of commodity-linked currencies such as the Canadian Dollar and Norwegian Krone.
Gold prices continued to consolidated in a range between $1,760 – $1,795, forming a “Bearish Pennant” pattern. It suggests further price weakness is likely if the yellow metal breaks below the rising trendline.
Asia-Pacific markets look set to trade mixed today. Futures in Japan, mainland China, Australia, South Korea, Singapore and Thailand are in the red, whereas those in Hong Kong, Taiwan and India are in the green. Viral resurgence in the UK and Australia may weigh on sentiment as countries tightened travel bans.
The Nikkei 225 index is struggling to breach the 100-day SMA line, which remains a key resistance level in the near term. Japan removed the state-of-emergency measures in the Tokyo and Osaka regions last week. Eased Covid-related restrictions could pave the way for the index to aim higher levels, while a resilient Japanese currency may cap stocks’ upside potential.
Australia’s ASX 200 index continued to consolidate as Sydney entered Covid-related lockdowns last week. Sector wise, information technology (+0.55%) and healthcare (+0.24%) outperformed, whereas real estate (-2.28%), utilities (-2.10%) and energy (-1.79%) were among the worst performers at open.
Nasdaq 100 IndexTechnical Analysis
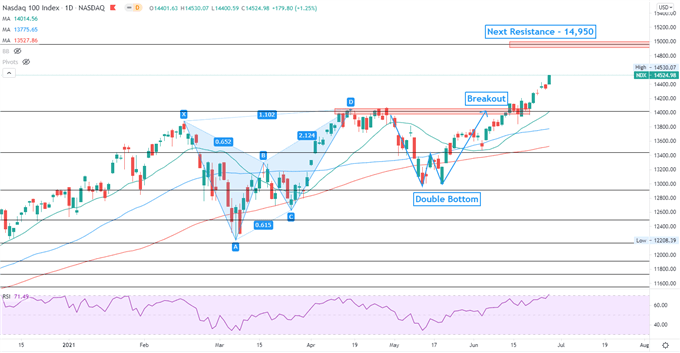
The Nasdaq 100 index breached a key resistance level of 14,013, thus opening the door for further upside potential. Prices may aim for higher highs in the days to come as the overall trend remains bullish-biased. The next major resistance can be found at 14,950 – the 261.8% Fibonacci extension. The previous resistance (14,013) has now become an immediate support. The RSI oscillator penetrated into the 70 mark, suggesting that prices may be temporarily overbought and vulnerable to a technical pullback.
Nasdaq 100 Index– Daily Chart
Nikkei 225 Index Technical Analysis:
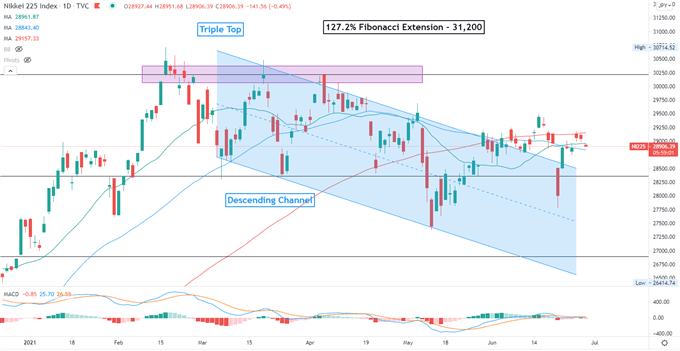
The Nikkei 225 index is attempting to breach the 100-day SMA line, which is an immediate resistance level. The index has also likely broken the ceiling of a “Descending Channel” and thus opened the door for further upside potential. The next key resistance level can be found at 30,200- the 127.2% Fibonacci extension and where the “Triple Top” resistance lies.
Nikkei 225 Index – Daily Chart
ASX 200 Index Technical Analysis:
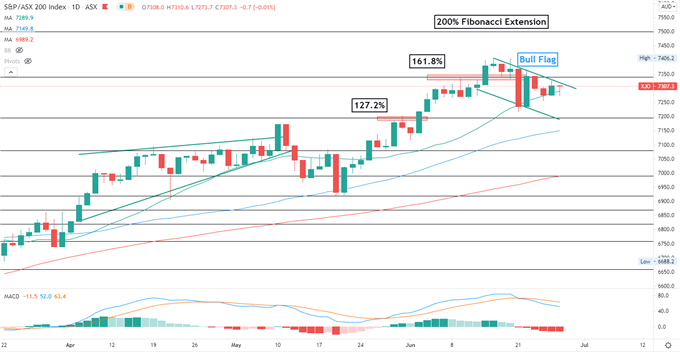
The ASX 200 index pulled back from its all-time highs this week and entered a technical correction. Prices have likely formed a “Bull Flag” pattern, which hints at further upside potential after a period of consolidation. Immediate support levels can be found at the 20-day SMA line (7,290) and then 7,200 – the 127.2% Fibonacci extension. The overall bullish trend remains intact as suggested by the upward-sloped SMA lines.
ASX 200 Index – Daily Chart
— Written by Margaret Yang, Strategist for DailyFX.com
To contact Margaret, use the Comments section below or @margaretyjy on Twitter
Be the first to comment